

Typhoon Tip
-
Posts
44,568 -
Joined
-
Last visited
Content Type
Profiles
Blogs
Forums
American Weather
Media Demo
Store
Gallery
Everything posted by Typhoon Tip
-
Yeah... I agree with y'all ... The orographic shadowing cannot really be avoided - that is physically imposing geological constraint. But, to be concise - which I thought I was but I dunno ... If there is enhancing lift of relatively warmer (saturable) marine air over a cold BL, that may 'rob' in over proficiency .. What that might do then is then exaggerate the orographic effect ... You end up with 0.3" over Tolland, CT say ... Obviously we all hope and pray for that to happen...then, have some weird snow phantasm form like anime, sneak in his bedroom window with it's ice dong and be unkind while all that is happening ... But, in the off-chance that doesn't occur... Sometimes when modeling processes in the environment .. when systemic events effect one another those 2ndary results can blow up in significance. It's the "hardest" thing to model- seriously
-
also...I was trying to be somewhat droll humored in the previous but ...yeah...I don't care about a teleconnector -derived superlative for a D8 juggernaut that sounds like, " ...man, that'd be one of those 1 to 2 footers..." If it really mattered to me, I don't honestly like it but I've got far bigger problems in life lol
-
I have been wondering about this and I "think" I have a plausible explanation why we are seeing these aggregated clusterings of QPF showing up in some of the recent guidances, packed within 50 miles of coasts N of NJ - I'm noticing as we are nearing the neared side of the mid range and about to relay off to the outer range of the short range ( ...phew, hate those kind of sentences ), the models are getting interestingly quite cold in the BL at all the major hubs, PHL-NYC-BOS-PWM.. I think we may be getting a bit of long-fetch immediate coastal lift over CF effects there - I am not sure even the depictions of the higher resolution Euro species would really be illustrating that in the l-level discreteness ... but it might be there embedded in the on-going din of everything that's going on in the model physics. I just think with that deep longitudnal flow coming in normal to what is getting colder and colder in the guidance, there's likely to be some interesting QPF issues on the flop ( west) sides of those interfaces.. And I also wonder if said processing in the models may even be doing too much - as in over compensating for that interface. This could be causing some QPF shadowing to get exaggerated out in western zones where there's orographic effects then compounding.
-
I'm not a huge fan of the "1-2" numerology for snow ranging .. heh Its sneaky evasive and self-preservation that is SO J.B. setting up a weasel out. 12" between those end points ( roughly the length of the CD ironically )... ? Folks, can we show some sacktitude and say 18-24" ...or, 12-18" ... ? new rule - no ranges less than 6" end points
-
bump - nyuk nyuk nyuk
-
yeah...it's maybe an obscure, less important observation but I think it's interesting just how thermodynamically cold this air mass is at onset and during, yet the heights at 500 mb are so elevated relative to that.
-
hmm... I like symbolism - one of my hypocrisies as a self-proclaimed realist so bite me .. But, systems that begin imposing problems in California have a way of imposing problems eastward across their continental reigns of terror. Ever heard of the turn of phrase, "...This system has a history of producing...." ? ...sometimes even when all's said and done in aftermath, back-office conversations at NCEP even say, "...it's funny - that system had a long history of creating problems, too " Well, this is causing flooding and damage out that way so... Perhaps it means nothing for how hard it snows at TTN - HFD - BED Mass ... or does it - muah hahahahahaha
-
There's a metrical comparison on this that no one's mentioned - it's not a knock..it's a bit esoteric to common dig-in But take the NAM at 78-84 hours. It's a got broadly close 500mb isohypses region at 546 decameters...which probably means the absolute nadir is within a click or two of 540 yet > ... etc. But the thermal plumb from 750 mb down to the surface at PHL-NYC-BOS appears colder at those time frames than is typically found at those heights. The 2-meter at Boston is 29 F but that appears to be sea component modulated... inland to PHL ...it's like 24 F ... It should be 534 dm and I wonder what the sounding curves will look like ... Snowgoose69'er mentioned this season's had it's fair share of oddities - that's been the profound statement of the thread, frankly ...because it's true for one. But that whole thermal layout on this one in both the W and U - Y relationships appears to be off compared to the classical model. So add this this one to the list
-
love the way you worded that - lol ahahaha NOT better ... just you know, less shitty
-
...Now's about time for the Euro to come with 32" from Willamantic CT to ASH ... lol
-
Not surprising... With the distraction in the foreground, the 'losing' and/or muting the significance of a cutter was already covered a couple days ago and yesterday - it's not really new. But, that said... to re-iterate: it's odd because there is a conflict of signals in play. The -EPO has a siggy tendency to dump heights first as inside slider in the west, loading the Rockies and high Plains with cold first, and the flow concomitantly tips N at larger synoptic response scales in the SE... blah blah. That's that, buuut, ...the fast flow that is plaguing the Earth ( for f! sake) doesn't really physically allow the wave lengths to buckle and shorten in the x( u) coordinate... - code of stretching the flattening. Those two are offset indicators. The GGEM at 12z completely sides with speed, severs the initial slider look as Will mentioned, takes half of that momentum and carves out a ( probably ) erroneously deep cut off/Baja... and while N aspect post bifurcation smears out as a Lake Effect producing Mammoth mummification cold wave -
-
This is a way the the totality of the atmosphere achieves as slow pattern/blocking tendency, ...while conserving the velocity surplus shit. It is - Because, one wonders if this could ever have truly "stalled" at a deeper system with a hurried flow going on all around it - so the ..the physical "compromise" ( to put is imply ) is a busted ravioli that the smears and wobbles poorly focus multi-nodel low centers inside a bag of moderate impact. Slow, but no stall... And I'm looking that total painting by the Euro and GGEM and GFS... - i gotta say..typically a "season defining" system has a lull in active patternization and a dearth in frequency that last for a while afterward. These guidance seem already overtaking this whole mess quickly into regime change back into raging gradient/speed. -EPO ...cold loading and wow. I mean, it's already like we're skipping over this and can't wait to get out there to the rip flow.. Of course, that 'typology' described may be more of a previous climate mode - frankly...all teleconnector inference applications have been resulting in oddities.
-
Clearly ... weaker in the overall wave space through the trough, x and y plain...at 500mb -- > less panache. GGEM did that.. I think I'm in beta-mode state of high confidence for a pedestrian climate Nor'easter ... It'll be fun! ...though, those with blue nuts for allowing their "plausible-design" engines gin up their lust too much may not see things that way.... but consider where we were 2 weeks ago when there was nothing interesting any way cut things up and spun them. Finally belief system tomorrow/night
-
It maximizes fast because the forcing is weak ...so it attains it max potential early - really simple... Folks keep bangin their hope-heads against their computer screen ever 6 hours for the new run, and until this gets a stronger mechanical feed in of S/W kinematics, it's only going to fluctuate around those distracting observations.
-
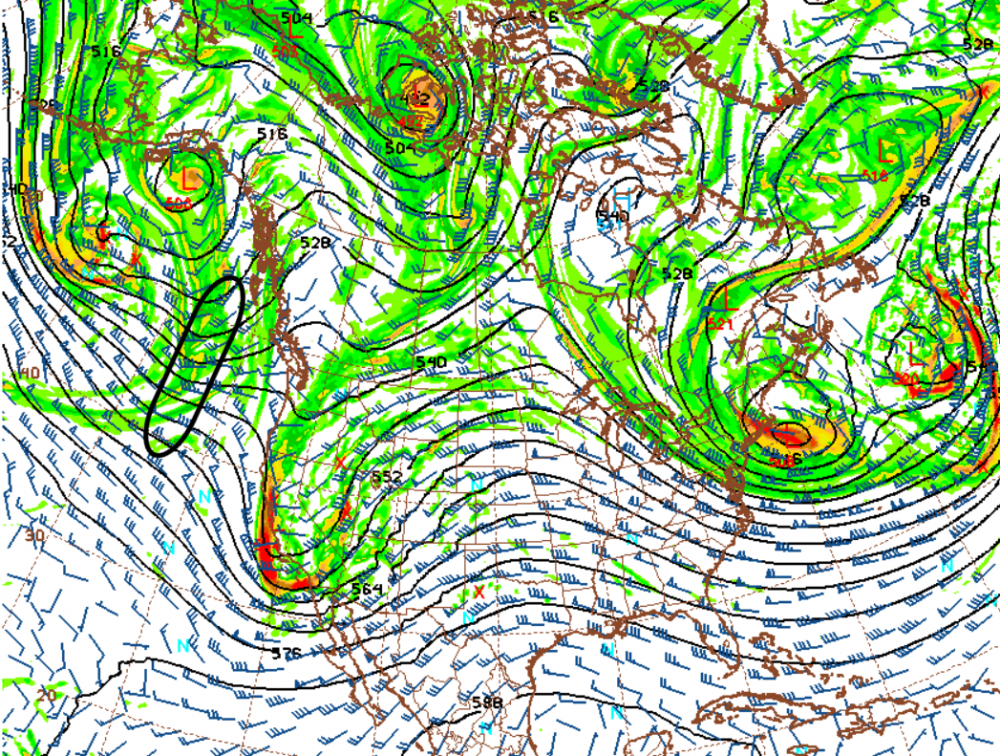
-- NAM has a NW bias beyond 48 ...and particularly 60 hours ..wrt to west Atlantic/near-coastal cyclogenesis and subsequent axis of movement. This has been repeated ~ 10 times per season, now going back ... pretty much to the beginning of weather-related, Internet graphics consuming hobby-ism. -- This system still appears to be a moderate impact K.U. event; despite all peregrinations beautifully formulated across the last 4 or so days of its epic poetic life cycle, ...that's still appears the bounce-back position. -- Having said that, I do think this is entire evolution, thus far handled across all guidance ... , is not maximizing the hemispheric signal. That is a facet I have found interesting about this whole thing ( not that my interest matters to anyone ...). But, this slow moving +PNA modality --> +PNAP western height expansion, while there is a vestigial western limb -NAO collapsing through the 60W/55N ~ region of the Canadian Maritime, really does offer a superb mass-field signaled opportunity or a slow moving, deep height nadir through 90W-60W ...S of the 50th latitude line - a box that places the M/A -- NE regions under watch for significance cyclogenesis. We got it, but it's shirked on qualitative/quantitative maximization of what can fit in that geography. -- Can that change? Believe it or not ...this can go weaker, or stronger as an actual cyclonic response. I have been watching this aspect (blw) now for almost three days worth of cycles, ...from where/what model free-sources ( lol ) allow. There is a sneaky intermediary S/W dosing that is being handled with subtle momentum signature variance, run to run, in the 500 mb charts in every guidance. This is the 06z GFS from Golden Gate ( this morning...), used only to elucidate the concern ( only ...): This annotation off the west coast over the open ocean SSE of the GOA, I have noted, is behaving like a crucial piece to the total amplitude puzzle as all this coalesces upon the eastern seaboard ~ 72 hours post this frame. What's new... low curvature trajectory at planetary scales, means circumstantially that everything modeled to pass over the continent has to be 100% integration of dubious physical data and a whole truck load of (sat soundings + assimilating)/2 ... leads to confidence -related issues. The problem is ... assimilation has improved markedly over the last 10 years ( I have personally noticed..)... The Boxing Day correction event is the most notable occurrence I can recall..where a late mid range system was physically lost ..only to come demonstratively back at time frames < 72 hours. ...particularly 48 hours actually! That was 10 years ago. The synopsis leading that event was a flattish sort of speedier set up ...with the causal wave spacing coming in on a flat, shadowy trajectory like we see above. It came in stronger, rolled out more S/W ridging ahead of it... and together with a similar +PNAP expansion as we see modeled now ( about 72 hours out)... the rest was history. What makes this above, "possibly" different is that the wave space in that ovoid circle in question is HUUUGELY sensitive to 'permutation-al analysis' to put it nicely. It's like a piece of stem-ware situated between a couple of elephant ass physical presences in the flow/ grids, and I wonder if the assimilation might be prone to 'eclipsing effects' - so to speak - because it is sandwiched delicately between.. I think it is going to matter... when that feature has come in like 5 kts stronger, I have noticed the tenor coefficient of forum-gaiety gets larger, joy abounds.. at the [enter superlative ...] impact some model has delivered the region. And ..of course, when it has come in slightly weaker, 'Ho god ...no. Not again'. This piece of momentum feeds into the backside of this ... sneaky...and helps what is otherwise a rather starved system for momentum. Some of the recent guidance has been less with that little feature. It's not the whole potato salad ...I'm not saying that. But, every bit helps ... Summary: What we have is a favorable hemispheric window per the super synoptic/synoptic background/teleconnector, one that is merely getting paltry S/W feed-in. I am definitely seeing that when that feature above is ever so slightly stronger, coming through the SW on the heels of the "Outside slider"/California initial relay above, it seems to constructively interfere ..fusing in nearing the TV. Then, in not being a fan of coincidences, 2 to 4 dm deeper height cores up along NE coast and that "photogenic" better look, I suspect is related..
-
Like I joked earlier today ... horse blinders
-
The ICON rots a CCB conveyor after a 4-6 hours of heavy frontage -... probably 7-10" in 6 hours, followed by another 10" over the next day to day and half with that stall and mid level evolution working in tandem. That's probably about the best run I've seen ..close contender with the Euro ...for photogenic look, as well, maximizing what moderate S/W mechanics can do in an overall ( wasted? ) favorable large synopsis. heh... stinger of the CCB down in Va Beach! that be a whack big low man
-
mm... how long since we've had a significant "EC" winter storm tho - three years by my count minimum... Have to go back a ways to get a K.U. true and blue ribbon winner. seems we've been in a decreasing frequency for that type, while in an overall increased frequency for active weather - probably owing to fast flows and gradient flow types rapidly transporting things along .. But we probably don't need to be too ridged in what defines a K.U. ? I mean is there a check list - I always thought of those "EC" threats as being DCA flirts while PHL-NYC-BOS are all under hard headline warnings and blizzard rumors
-
I don't know if I agree with this assessment outside of this pattern type It's not a good model in slow hemisphere -no. It's got that weird x-coordinate ( west to east ) velocity bias, and when the blocking hemisphere kicks in, it's in constant fight against. Remember just 40 days ago, the Euro was bullied on, and the GFS was performing better? ... later next week, we may be crying for mercy from the Euro D8 bombs while the GFS takes it to the shed because the gradient appears slated to retake the dominant characteristic of the hemisphere when the -EPO tipping bucket dumps its loading into Canada and vroom -
-
Yeah ... I just see this still as a powerful 'placeholder' that is only getting a fraction of what it could take ... heh. But just a little more in-feed of wind momentum kinematic S/W material and this thing really would wind up like a top and congeal tighter through the sfc-700 mb disks ... This open broad bs is because the focusing UVM is distributed aloft... Kind of an annoying waste of said favorability - The Euro run appears to absolutely maximize what it can, given said feeds. It reminds me of that run like 3 or 4 cycles ago..when it was also pretty to look at. Thing is...for those holding out on more potent congealed realization ... I don't know if assimilation and sonde stuff matters in this case as much as even 10 years ago. It seems to me that if anything, features relayed off the Pacific are always proving pubes too much when the pass on shore. I have really seen something come in more potent like we used to, lately - But it may. I'm starting to get event fatigue already ... jeez.
-
Ha...this storm coincides with the 'Neap tide' ...
-
also, 'Spring' tide ...I think what I was having trouble find before -
-
yeah ...maybe that changed - i'll give it a whirl... but, the impetus is also to supply them here ? - I just wanted to the discussion too.
-
Okay okay ... heh... Not willing ( personally ) to go that far. Not caring to see those ancillary products based upon other products ...based upon numerical guidance tech grape-vines, protects me personally. I'm a mid 1990s, 500 mb trend guy - do just fine man. You know though, it does point out: this engagement? whether hobby, obsession... to just dropping by to get an 'insider idea' on an impending over-aggrandized CNN headline of impending doom...etc, it's all new to humanity? This has never happened before, ever, a sociological/cultural mode... in history. There is no archeological bases for this - interesting. It's 20 years tops... in fact, could argue that it's really only the last 10 years that it has become a real empiric/demonstratively motivating influence on behaviors and even to the extent of motioning macro-ethos... But that all hints at an op-ed segway, - any takers.. haha. Didn't think so - No, but I do think it's interesting sociologically that the "storm" experience isn't really waking up to red sky at morning, and battening down the hatches and seeing what it has in store. The storm experience is often an exhausting... jesus, it can be a 2-week ordeal Point is, yikes...
-
Yup ... Will and I commented on this yesterday and now these guidance gone wild with a -EPO ... Deep deep cold loads into the Canadian shield... Well prior to the governing larger synoptic driving any western continental, mid-latitude ridging, the cold is already spreading out with suppressed polar boundary S of 40 N... This is creating a petri-dish of baroclinic instability, so... needless to say - As far as Euro, I'd also watch for just a smidge of over carving in to the SW/bias therein


