Typhoon Tip
-
Posts
44,568 -
Joined
-
Last visited
Content Type
Profiles
Blogs
Forums
American Weather
Media Demo
Store
Gallery
Everything posted by Typhoon Tip
-
1.6" here looks like medium confidence for a low grade heat wave next week... Wed-Fri. 89-92/72 type
-
tremendous wet snow winter for upstate NY back west throughout the Lakes, and we're having a record number of STJ jacked coastals/Nor'easters of all rain. wah wah wahhh Can't keep raising the back ground then super impose a record ocean warmth and expect to keep getting timely cold. Eventually, we're getting a winter that's just too damn warm. Oh it'll snow once or twice... sure. Excluding the delusion enabler events though, p.o.s. flooder incoming?
-
Yeah... the synoptic forcing is weak. Hence the mere 1001 mb low. But when that's the case ( for the general readers...) that means there is less unity of physical forces occurring above and below the threshold of model grid ... the model processing only partially handles ... we end up with a dart board Subtle example of relativity ... even though the forcing/mechanics are petty, since there is nothing else to offset them, the actual rain production and impact ends up being rather high - or higher than it should be for 1001er. It also (obviously) doesn't hurt the scenario that there's a heavy PWAT in this mess. The former and this latter facets on top of each other ... viola! It was/is both difficult to pin point where, but somewhere is likely to get zonkered because the whole of it doesn't require much triggering
-
Does anyone know of any sources that extends the cyclone phase diagram/tech outside of just tropical applications? I am well aware of this found Bob Hart's found here, https://moe.met.fsu.edu/cyclonephase/ I recall seeing this method applied to other cyclone types in the past, but I'm not finding those sites. I'm just been sort of frustrated by the models insistent on sub 1000 mb low spin up over NJ, amidst 570+ thickness in all radial directions. That latter circumstance is odd. It is not the typical baroclinic model ( to some degree ) low, which is physically necessary for extratropical cyclones. You know? warm sector, cold sector, cool sector. So I'm just wondering if we're seeing some kind of a quickly evolving hybrid warm core leaning type low pressure here... It may account for the more robust solutions, if some of the thermodynamic/UVM forcing were sharing space. Regarding rainfall... we seem to be peaking PWAT against climo - which is a pretty tall order. What comes along with that is bigger rain relative indicators - synergy of sorts. Basically, it is an increased chances that locations will observe bigger results from surprising smaller reasons to do so. That's what happens in heavier moistened events; suspending a fall column through them, what reaches the ground is closer to source. etc.. So this system is slow-ish moving. A training band even in a weaker total low that (say) proves the NAM/Euro are over sensitive at "boundary of existence" - which I don't see how this thing can be a 995 mb low unless the phase might expose it has shared thermodynamic processes... - could end up being hefty anyway. EDIT: okay I did find this... same site actually. heh. It does seem there's a bit of warmer lean to this thing's profile. interesting https://moe.met.fsu.edu/cyclonephase/ecmwf/fcst/archive/26072800/231.html
-
A, wrong ... the whole region averages a multi-seasonal on-going deficit. This may be obscured by recency, but as usual in this particular social media space ...the constituency divorces that sort of longer term awareness/reality from whatever recency has done to form their immediate impression. So "need" as an objective empirical data is still there, despite that fallacy. B, correct ... 4 straight days is miserable for most sane people. Sure. However, if it is any consolation, at least "I" don't believe the blend of the available/dependable guidance really signals 4 straight days of rain. It's most likely an over billed front wall of what will likely turn out to be less, followed by unstable showery weather, but not raining all the time. It won't be sunny mind you. Per se. But it'll be gradually improving through Friday. Even if this scenarios figures out how to initially rain more than what it can ( lol ), it still likely a non-inundating decay.
-
What about just needing the rain ?
-
I'm still suspecting the whole of it has been over amped in guidance, and as we near the organized coherence might unravel ... at least some. But ultimately trimming back. how much so, heh Won't be butt hurt if that's not the case - just a suspicion in this case. Lot of tl;dr read to support why -
-
It's funny how those that don't like hot(cold) air ... attempt to gaslight any hot(cold) air as being less significant when it is clear to everyone else that a given region is highly likely in a state of misery because of the hot(cold) air. Yet, they are not actually even a part of a given region that is "not suffering" the hot(cold) air, too ... LOL
-
it’s tentative but we may be seeing a spring 2023-like global thermal surge beginning. Air and sea presently lurching in tandem.
-
The models seem overly sensitive/bad physics somehow in these feathery weak gradients/higher thickness synopsis. I mean look at the NAM. All protestations aside … still, it takes a thunderstorm complex over Milwaukee, turns it in a small low then counties evolve it from these spontaneous looking origins as it carries it to the Del Marva … where uses it to generate -2 relative to season SD 990mb coastal gale … I guess I dunno part of me just wonders if we’re getting a reality check fake out when we’re on top of the thing … something less “engineered” By the way … it’s tentative but we may be seeing a spring 2023-like global thermal surge. Air and sea presently lurching … we’ll see
-
Well, I guess if the models always predict 5 to 10 one of these times, they’ll nail it
-
Didn't we just do that 2 weeks ago and ended up with 2-3" ?
-
Agreed ... but aren't they almost mutually exclusive? 50 years ago ( personal conjecture) this on-setting NINO and it's weird 'ominous' portends that seems almost metaphysically prescient ... whatever it is and all of it probably can't happen. Why? Because this has a non-linear force - not readily observable - coming from 'unrealized' climate change. An aspect that is quite plausibly constructively interfering. The oceans have absorbed 90% of the warming that "should have" been atmospherically kinetic and or stored in WV, since the Industrial Revolution. How much absorption can happen before something is forcibly given back..? Realization forcibly occurring, incrementally. Like what happen in the 2023. That global pan-systemic temperature burst that spring is give back. As an aside... maybe that synergy is sensible, like collectively in a subconscious awareness, which is why-for ( probably ) the prescient portends. It doesn't hurt that the models are actually jacking the historical this and that, either. But it's like watching a comeback in sports. The team may still be down 10 points with time a factor, but you know somehow some way they're winning that game. In this case tho, we're the losing side... It seems this NINO is catapulting off a background that is "elastically" under tension. It trying to restore to equilibrium at all times. That restorative force is in the upward ( climate change ) direction ... 2023, this NINO, they become like leaks in the damn, and that tension is squeezing through. Seriously though, I speculate that the this NINO is in a sort of synergistic/constructive feedback with the background state. A state that could not have been the case 50 years ago, because obviously the background was significantly enough different. Less donuts in the doughnut stuffing machine's cartridge that Homer Simpson experienced in Hell.
-
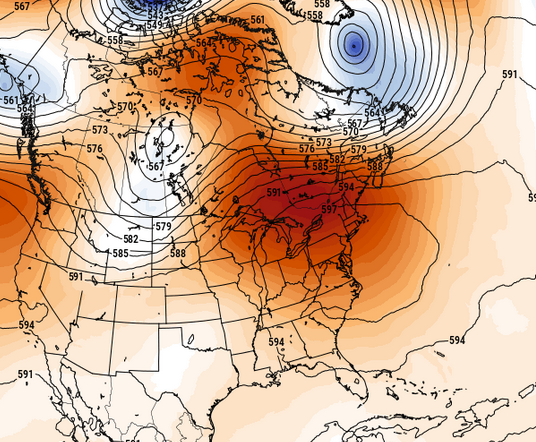
I don't think the trough parks on the EC tho... That almost never happens in JJA climo pattern/records. In fact, models will tend to over amplify that trough at this range, while getting the western N/A ridge probably closer to accurate compared to handling the east. Which ends up just being a weakness with a 500 mb flow paralleling the coast. That's why I suspect if that D8-14 range CPC temperature probability aligns with the pattern, BB is what we'd end up with in reality. Having said all that... if the CPC PNA outlook is correct, the correction vector is probably more WAR influence - if that starts emerging more and more in outlooks, that wouldn't surprise me... but WAR is also not really eye-stingin' heat, either. It goes sorta like this: Sonoran Release 102/62, WAR 92/72, Bahama Blue 82/78
-
It's probably 82/78 a Bahama Blue circulation mode... "Heat" is in the DP in that scenario, reflected in average highs over sweltering lows. Welcome to Nassau
-
Plus ... we've gone and made 'merica so goddamn great again ...Measles cases have soared to a 35-year high. Fuck yeah!
-
The extended operational GFS and Can are trying to go hot but ... mm, the indices say no.
-
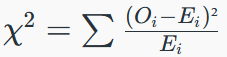
heh...some afterthoughts.. It's primarily used in experimenting theorems - create a model based upon a theory that describes how whatever in nature being observed, works. Then, feed it inputs, test the output for significance (chi test) against the other result that occurred naturally. If the output ( as it goes...) lands on .05, and in particular, there was pig ton of data going into the the test ( sample size) then one's theory that describes the system is robust. Blah blah blah, but what is fascinating about the the last 20 years of human folly we lovingly refer to as "civility" ... arguably the more advanced technologically we are getting, "civility" as a qualitative distinction is eroding in proportion... That's A. B, the reason for that is that ( perhaps conjecture) is the Law of Lessening Returns ...together with perhaps the natural Law of Least Physical Action. Together, human kind expresses their background forcing via having spontaneously created this refrain that if one does not understand complexity, than it is "their right" to automatically dismiss its insignificance - therefore, seee? I don't have to obey any rationalism that I don't like, therefore, I don't have to deviate from my course ... Which leads us perhaps to C, the precise mechanism in the Fermi Paradox explanation that our species is now on a collision course with...
-
Oh, o-kay. I see. yeah, and that's going to be dubious for obvious reasons. Of course, muah hahaha if it is a climate threshold being breached. Ha. I guess that would be easily sussed out though if we looked at all sites and if they all exhibited the same behavior than the ( speak of the devil) significance of that above would be more useful.
-
'normal' is a result of all events mixed together. Conceptually, even bone-heads ( well.. not Trump supporters) can see that the odds of any future event landing a result squarely on a number that is a mix of everything is thus remote. That means that actually hitting an arbitrarily occurring value dead on whatever that "normal" value is, is no different than the Lotto. Very low odds. Basically ... everything that occurs in nature, perhaps well over 90% likelihood, is going to be ABnormal. This is particularly true for decimals (to the right) of the whole number - the more of them ... the more likely you will not ever see a 'normal' daily high temperature. The significance of the abnormality is what is really needed to be evaluated for that ... we can rely in large part on common sense. If the normal is 82 and it is 104 that quite dope-slapping is obviously more significant that 82.1. But it sounds like y'all could use a refresh, or perhaps a first time introduction to what is known in statistical science as 'Chi-Square test'. A formula that produces a rational value, then interpretive as a method for determining if the frequency differs from expected result and by how much. It looks like this ... ( ...that outta clear things up )
-
how and perhaps what on Earth are you seeing here that looks like anything
-
Yeah but you don't deserve it 'cuz you've been chiding and debasing warmth all along haha 'Sides, solar max doesn't exit until ~ the 9th of August
-
heh
-
Meh... this summer appears hell-bent on wasting all the solar max in a flat trough with no or only brief heat penetration N of the Mason Dixie. If Mr BAM's heat/ridge and all that does manifest after the 10th of August, it's more likely the meridian flow up the EC/'Bahama Blue' type. That's not mid 90s/70 ...more like 86/78 In which case the Atlantic MDR will deliver 0 anything while that is happening so stop typing that. And the "heat" is more expressed in a high DP that is getting warmed by a seasonally transitioning solar/dimmer sun. It would all just be more black mold and lone star tick migration type, incredulous because it's slow moving and therefore not directly observable CC apocalypse shit than anything else.
-
2026-2027 Super El Nino
Typhoon Tip replied to Stormchaserchuck1's topic in Weather Forecasting and Discussion
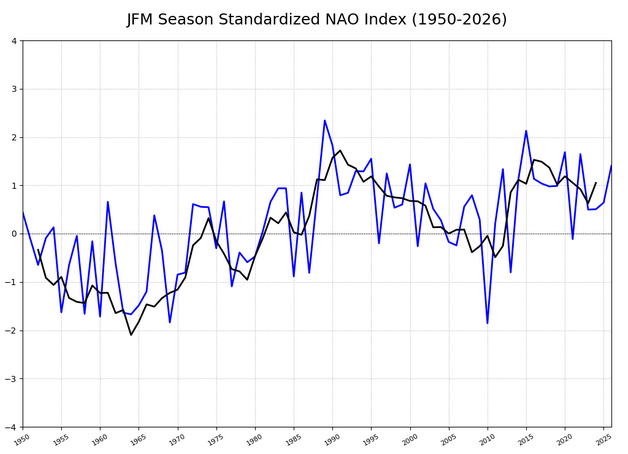
I have a personal conjecture offering plausible explanation for the cold blob emergence. The NAO has been predominately positive since 2000. That means increased occurrences of west wind in the SS stressing distribution. There may in fact be an AMOC thing going on associated with CC... but, the anomalous amount of westerly wind/low level occurrences interacting with a region that's inherently covered by a very gossamer thermocline should really be explored as factoring in why that region is having trouble recovering from cold upwelling events, over time and aggregated, taking place at large scales. So, ... pretty simple idea really. But here is the NOA's going back many decades. There may in fact be some AMOC involved ..where if the AMOC is 'deflecting' S, due to more surface pooling in the super thermohaline circulation conditioning ( fluxing off Greenland of melt water...), then... introducing the westerly low level wind flux anomaly on balance, those two would certainly be easily and rightfully interpreted as a positive/constructive feed-back in cooling that region.