GaWx
-
Posts
14,716 -
Joined
Content Type
Profiles
Blogs
Forums
American Weather
Media Demo
Store
Gallery
Everything posted by GaWx
-
The 12Z Euro ens is back to 96L being hardly any threat to the US.
-
12Z UKMET gives flooding rainfall from SW GA through SW VA keeping in mind that this is based on a track that’s well east of 11 AM NHC track:
-
12Z Ukmet is quite a bit east of the NHC forecast track with it crossing the FL/GA/AL point and then moving NNE through GA instead of AL: TROPICAL STORM FRED ANALYSED POSITION : 25.6N 84.6W ATCF IDENTIFIER : AL062021 LEAD CENTRAL MAXIMUM WIND VERIFYING TIME TIME POSITION PRESSURE (MB) SPEED (KNOTS) -------------- ---- -------- ------------- ------------- 1200UTC 15.08.2021 0 25.6N 84.6W 1010 30 0000UTC 16.08.2021 12 26.7N 86.0W 1006 36 1200UTC 16.08.2021 24 28.0N 86.1W 1004 35 0000UTC 17.08.2021 36 29.3N 85.8W 1001 38 1200UTC 17.08.2021 48 31.1N 85.0W 1005 30 0000UTC 18.08.2021 60 33.3N 84.0W 1007 24 1200UTC 18.08.2021 72 37.3N 82.3W 1012 15 0000UTC 19.08.2021 84 39.3N 80.2W 1014 25 1200UTC 19.08.2021 96 CEASED TRACKING
-
This is setting up to bring unneeded heavy rain for the Atlanta area. Most of that area has had above normal rainfall this summer and thus this could be setting them up for flooding concerns. The NHC projected track 100 or so miles to their west and northwest into NE AL is the type of track that often brings them multiple inches of rain within a short period. Fortunately, it looks to not be a slow mover, however (more like average speed for a TC in that area in August).
-
Any potential east coast threat from 96L may be higher early next week vs late this week. The 6Z Euro ens is similar to the 0Z with again a handful of threatening members out of 51. So, though not a high threat right now (6Z GEFS still says hardly any threat from this), it will be interesting to see whether or not this later evolves into a significant threat, especially NC north:
-
The 0Z Euro ens says the US E coast may have to watch 96L in about a week as all of those members offshore the SE are from 96L (out of 51 members though): https://i.imgur.com/2tbUJK7.png
-
Although the 18Z GEFS members are overall weaker than many earlier runs, the 18Z Euro ens has a good number of strong members out of its 51 members with it easily the most active run of today. Also, watch Invest 96L for the possibility that it does something not well modeled that then disrupts the steering flow enough to cause a significant deviation in Grace’s track vs modeling.
-
The 18Z GEFS started off with all weak members but suddenly became much more active near the SE coast.
-
18Z GFS is very weak into the Gulf. 18Z GFS ens members so far (hour 90) look weak.
-
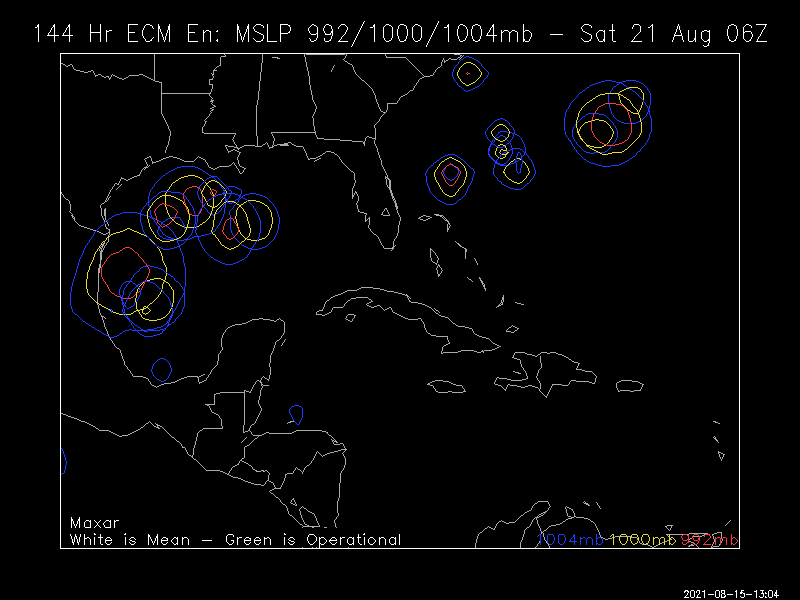
The 12Z Euro ens has only one strong member (out of ~51) landfalling over the SE US and that hits Daytona Beach on 8/21.
-
More good news with the 12Z Euro having only a very weak low over S FL at 132.
-
The 12Z GFS ens fortunately has only one strong member out of the ~31 members. It goes from Bahamas to FL Straits to E GOM to US gulf landfall.
-
Good news from 12Z UKMET but it tends to be conservative: TROPICAL DEPRESSION 95L ANALYSED POSITION : 15.1N 48.7W ATCF IDENTIFIER : AL952021 LEAD CENTRAL MAXIMUM WIND VERIFYING TIME TIME POSITION PRESSURE (MB) SPEED (KNOTS) -------------- ---- -------- ------------- ------------- 1200UTC 13.08.2021 0 15.1N 48.7W 1014 24 0000UTC 14.08.2021 12 CEASED TRACKING
-
Climate Change Leading to More NAO and PNA Extremes
GaWx replied to bluewave's topic in Climate Change
The amazing early August +PNA event has just ended. There were amazing new records set (records back to 1950): 1. The old record high PNA for any date prior to this event was the 3.40 of 9/24/2008. This was obliterated by a 4.00 on 8/6/21 (right at the top of the chart): 2. This event had four days in a row of a 3+ PNA. This is amazing because during the prior 71 years, there was only one time that there were as many as two days in a row (Sep of 2008)! 3. This event had 6 days of 2.75+, easily exceeding the previous event record of 3 days set several times. 4. So, this event is by far the greatest +PNA event in terms of magnitude during the 71 years of recorded history. Could this have been a once in several hundred+ year event? Quite possibly. 5. Not surprisingly, this event occurred during the July-early Oct period (see my earlier post on this). All six PNA events on record with a peak of 3+ occurred during the July-Sep period. For whatever reason, very strong PNA events like to occur at this time of year. In contrast, met winter has had only three days of 2+ (highest 2.35) and those were in very late Feb of two Febs (1968 and 1983). Link to thread following this as it was happening:
-
The main cluster of stronger 12Z Euro ensemble members crosses S FL and then goes into the NE Gulf. This is followed by a move into the FL Panhandle and then into AL or W GA. A secondary cluster largely misses FL barely to the east or skims it followed by a N movement and landfall anywhere from SAV to ILM.
-
Hey Jessy, Based on the current drop in SSTs, the cooling subsurface, the forecast models, solidly positive 30 and 90 day SOI averages, +OLR, and the fact that we're already into August, I see very little chance for El Nino by winter despite my preference for it. Check out this animation showing significant recooling: SOI: https://www.longpaddock.qld.gov.au/soi/ OLR: https://www.cpc.ncep.noaa.gov/data/indices/olr
-
0Z UKMET does develop 94L into a TD in the NE Caribbean Tuesday and takes it to just SE of S FL at 144 hours moving WNW (end of run) but it never gets stronger than TD. The UKMET fwiw can be conservatively weak. So, we’ll see. The Euro, GFS, and CMC are pretty similarly weak and also suggest it will move toward S FL. This is just guidance. NEW TROPICAL CYCLONE FORECAST TO DEVELOP AFTER 60 HOURS FORECAST POSITION AT T+ 60 : 17.3N 63.3W LEAD CENTRAL MAXIMUM WIND VERIFYING TIME TIME POSITION PRESSURE (MB) SPEED (KNOTS) -------------- ---- -------- ------------- ------------- 1200UTC 10.08.2021 60 17.3N 63.3W 1013 28 0000UTC 11.08.2021 72 18.7N 66.3W 1012 27 1200UTC 11.08.2021 84 19.6N 69.0W 1011 28 0000UTC 12.08.2021 96 20.7N 71.5W 1011 29 1200UTC 12.08.2021 108 21.7N 74.0W 1012 26 0000UTC 13.08.2021 120 22.4N 76.2W 1012 25 1200UTC 13.08.2021 132 23.2N 78.0W 1013 22 0000UTC 14.08.2021 144 23.9N 80.0W 1013 26 ——————————————— Regardless of development, progged steering suggests this may very well cause an increase in rainfall over parts of FL/SE US by early next week.
-
Record PNA of 4.00 on 8/6/21 obliterates old record
GaWx replied to GaWx's topic in Weather Forecasting and Discussion
Today, we got one last 3+ with a 3.40. That makes four 3+ days in a row. This is amazing because during the prior 71 years, there was only one time that there were as many as two days in a row! So, this event is by far the greatest +PNA in the 71 years of recorded history. Could this have been a once in several hundred+ year event? Quite possibly. -
Record PNA of 4.00 on 8/6/21 obliterates old record
GaWx replied to GaWx's topic in Weather Forecasting and Discussion
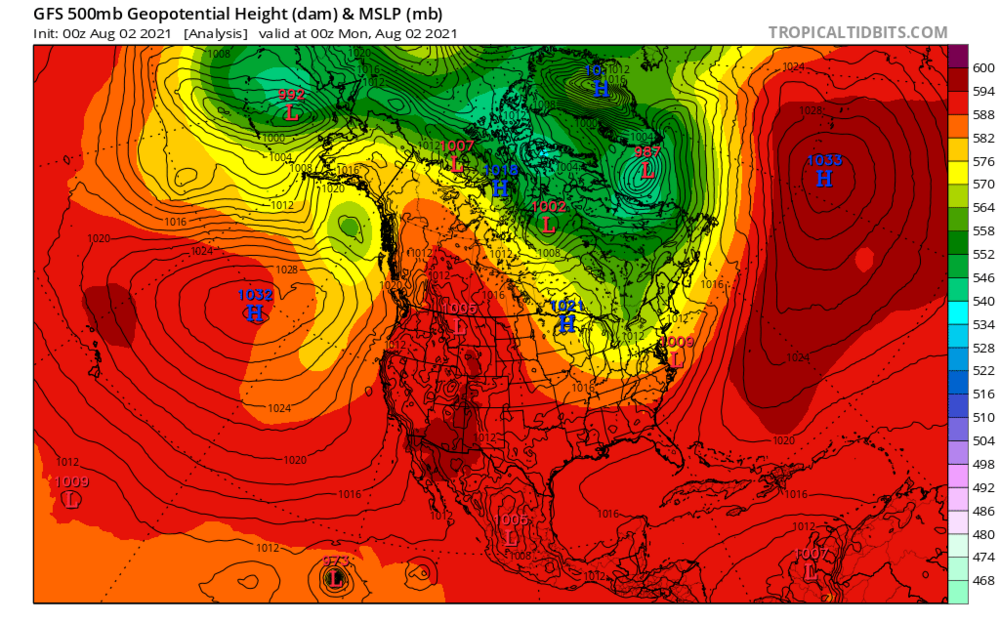
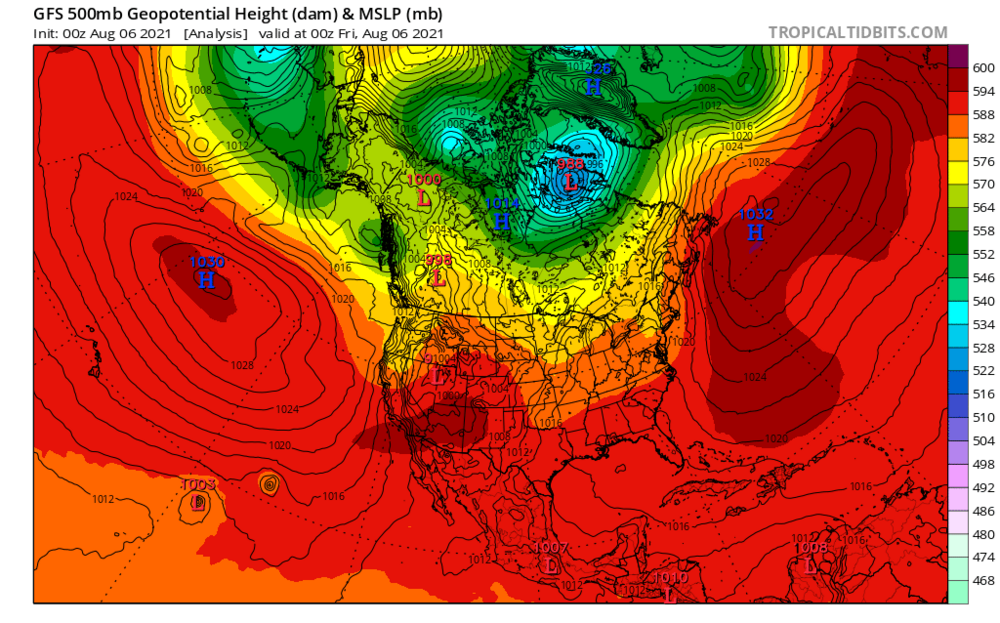
Thanks, Chuck. We got an even higher PNA of 4.00 today (smack dab at the top of the chart), which absolutely obliterates the previous all-time old record peak for any date back to 1950 of 3.40!! This also makes it three days of 3+ for this event, which breaks the previous record of two days in 2008, and we may even get one more tomorrow: Yeah, I have noticed that despite this record high PNA today, the 500 mb pattern today doesn't look nearly as impressive to the eye as prior days. To be sure, the W NA ridge/E NA trof was quite impressive for summer/most impressive to me on August 2, when the PNA was "only" at 2.88: However, today's H5 on the day of the PNA peak is already much flatter: It is almost as if there's a lag in the daily PNA calculation. So, nothing is showing up of note now at h5 but it was showing up impressively a few days ago.
-
Record PNA of 4.00 on 8/6/21 obliterates old record
GaWx replied to GaWx's topic in Weather Forecasting and Discussion
Today, the PNA is at an amazing 3.73, which obliterates the old record high going back to 1950 of 3.397, set on 9/24/2008! The GEFS suggests there will be one more very high day tomorrow:
-
Record PNA of 4.00 on 8/6/21 obliterates old record
GaWx replied to GaWx's topic in Weather Forecasting and Discussion
Today's update has the first 3+ PNA day since 8/1/2009 with a 3.21 This is only the 7th on record. Still looking for an all-time record high during the next two days. The current record (back to 1950) is 3.397.
-
Record PNA of 4.00 on 8/6/21 obliterates old record
GaWx replied to GaWx's topic in Weather Forecasting and Discussion
Aug 2nd update: Today's PNA didn't quite make it to 3 as it was 2.88. Even so, it's the highest in 12 years and the fun is just starting. Today's GEFS forecast, if anything, is for a slightly higher peak than the prior run had meaning it is still calling for a new all-time record high. It is forecasting 3+ for 8/3-6 with a close call for 8/7. So it is calling for 4-5 days of 3+. The current record for any one peak is only 2 days of 3+ (records back to 1950) , which was in Sep of 2008. So, this would shatter that record!
-
Climate Change Leading to More NAO and PNA Extremes
GaWx replied to bluewave's topic in Climate Change
To give me a feel for the PNA trends, I looked at the monthly data since 1950, which is shown here: https://www.cpc.ncep.noaa.gov/products/precip/CWlink/pna/norm.pna.monthly.b5001.current.ascii.table I also looked at this site, which is great because it uses the same data (completed through Feb of 2019) while also showing the yearly and monthly averages as well as using color coding to make it easier to see trends: https://www.daculaweather.com/4_pna_index.php Looking at the trends: 1. Average annual by decade (2010s includes 2020's +0.21): 1950s: -0.07 1960s: -0.03 1970s: -0.11 1980s: +0.15 1990s: +0.07 2000s: +0.19 2010s: +0.16 This tells me the trend was fairly flat from the 1950s to the 1970s. Then there was a pretty sharp increase from the 1970s to the 1980s. However, although the sharp 1980s increase has held, it actually has been pretty flat overall since as the 2010s were about the same as the 1980s. Now when looking at the last 7 years, alone, they have all been positive. This is the first time since 1950 to have 7 positive years in a row and they've averaged +0.24. However, way back during 1977-1983, those 7 years averaged about the same at +0.23. Also, the highest 7 year average was the +0.34 of 2004-10. Furthermore, the first half of 2021 is the 3rd most most negative since 2000. Even with August likely ending up strongly positive (at least close to +1 and probably a good bit higher), Jan-Aug will likely still average negative and the odds are that 2021 will remain negative considering no El Nino. So, that 7 year positive streak has a good chance to end in 2021. 2. Next I looked at the trend for each month and found some interesting things: Jan: After averaging negative in the 1950s-70s, it skyrocketed to +0.78 in the 1980s, came back down but remained solidly positive in the 1990s and 2000s, and then went back up to +0.78 in the 2010s. Feb: also rose pretty sharply in the 1980s to +0.44, fell to neutral in the 1990s, followed by a rise back to 0.30 in the 2000s, and then followed by a fall back to neutral. So, certainly no positive trend since the 1980s. Mar: similarly rose to +0.41 in the 1980s but like Feb has fallen back to neutral in the 2010s. Apr: similarly rose to +0.37 in the 1980s but fell back to -0.25 in the 2010s. May: neutral in the 1980s, rose to +0.25 in the 1990s, but has since plunged to -0.48 in the 2010s. Jun: rose to +0.46 in the 1980s, dropped sharply to neutral in the 1990s and then -0.57 in the 2000s, but then rose sharply back to neutral in the 2010s. Jul: rose to +0.20 in the 1980s and has been solidly positive and rising significantly since with +0.70 in the 2010s. Aug: was unusual with it falling to -0.57 in the 1980s but then followed by sharp rises to neutral in the 1990s, +0.42 in the 2000s, and +0.67 in the 2010s. Sep: like Aug it plunged to -0.50 in the 1980s followed by sharp rise to -0.13 in the 1990s, +0.65 in the 2000s, and then a slight drop to a still solid +0.47 in the 2010s. Oct: neutral in the 1980s, then fell to -0.37 in the 1990s, rose to neutral in the 1990s/2000s, and +0.25 in the 2010s. Nov: rose to +0.30 in the 1980s, dropped to -0.17 in the 1990s, rose to +0.18 in the 2000s, and then plunged to -0.32 in the 2010s. Dec: rose to +0.35 in the 1980s, dropped to neutral in the 1990s, skyrocketed to +0.68 in the 2000s, and then plunged back to +0.12 in the 2010s. So, my analysis by month shows that Jul-Oct were the months that suggest a rising trend since the 1980s with Jan and Jul-Sep impressively positive in the 2010s. However, the 2010s for Feb-Jun and Nov have fallen a good bit below their respective 1980s levels. So, there are very mixed messages regarding the trend since the 1980s depending on the season. Mid summer through early to mid autumn has risen substantially since the 1980s while late winter through early summer has done the opposite. Does anyone have a feel for why there are these opposing seasonal trends? I'll note that mid summer through early autumn is when SSTs max out. Would there be any connection between that and the sharp rise in the PNA then? If so, why? From the paper bluewave quoted from: "This trend is particularly strong for the summertime PNA during the period 1979–2016 (0.27 per decade, p < 0.01), with the pattern shifting from a negative phase in the 1980s through the mid-1990s to a strong positive phase after the mid-1990s (Fig. 1c)." -------------------------------------------------------------- Regarding the summer, I noted that July and August both showed large increases since the 1980s and that Aug averaged solidly negative in the 1980s followed by a sharp rise. However, June and July both averaged positive during the 1980s making for an overall neutral JJA then (about half the years positive and the other half negative). Also, I have JJA averaging pretty much neutral during the 1990-1996 period (only very slightly negative). So, I don't see why it refers to a negative phase in the 1980s through mid 1990s for the summer. I'd call it neutral. But I do agree with calling it a strong positive phase after the mid 1990s thanks solely to Jul and Aug. -
Record PNA of 4.00 on 8/6/21 obliterates old record
GaWx replied to GaWx's topic in Weather Forecasting and Discussion
Today’s PNA started the very sharp rise as has been forecasted by the GEFS for days although it didn’t quite reach 2 with it at 1.67 vs yesterday’s 0.51. Today’s GEFS PNA forecast peak (see below) is even higher than the last 3 days. It implies a higher chance to exceed the daily record high of 3.397 (records back to 1950), which was set on 9/24/2008! Moreover, it suggests an even better chance to exceed the current record of two days at 3+ during one peak, which was set 9/23-24/2008. Today’s GEFS suggests a good chance for it to exceed 3 tomorrow. It still has a slight fall for 8/3 and then near steady on 8/4 although both may barely remain at 3+ (will be close). Then, it still has a second rise, which is even more prominent than the prior forecasts. It has it easily above 3 on 8/5-6 with a new record high peak above 3.397 quite possibly being set on one or both days! It is suggesting over 3.5 on both days! Then it falls some on 8/7 although it may still be at 3+ for the last time. Afterward there is a sharp fall 8/8+. So, today’s forecast suggests not just a good shot at a new record high peak but also a very good shot at a new record high # of days at 3+ with as many as six days during 8/2-7, which would absolutely obliterate the current record (back to 1950) of Sep of 2008’s two days at 3+!
-
Today's GEFS is actually slightly stronger. So that I don't clutter this excellent thread up with more posts on this very strong upcoming +PNA being that there is no clear-cut indication that it is related to CC, I decided to create a thread here to cover it: