GaWx
-
Posts
14,716 -
Joined
Content Type
Profiles
Blogs
Forums
American Weather
Media Demo
Store
Gallery
Everything posted by GaWx
-
It continues to go downhill in New Orleans and the pressure gradient is now up to 6 mb over just a 15 mile distance! 5 PM CDT: N.O. INTL ARPT HVY RAIN 76 75 97 E48G74 29.16F VSB 1/2 N.O. DWNTWN HE HVY RAIN 77 75 93 E23G46 29.27F VSB 3/4 N.O. LAKEFRONT HVY RAIN 77 76 96 E54G78 29.34F VSB 1/2
-
The latest wobble due north is bad news for the New Orleans area, especially for Kenner and even Metairie. Keeping in mind how bad it got in 1965 with Betsy (which was about 12 mb weaker at landfall and on a similar path) and with Ida still holding quite strong, this isn't going to be pretty for that area.
-
So, there's now a 3.3 mb gradient in N.O. over the less than 15 miles from the international airport, which is closer to the projected path, to the lakefront station.
-
3 PM CDT N.O. stations show a continued increase in winds and rapid drop in pressure along with a continued very strong gradient reflected by the 0.10" difference between the airport and lakefront: CITY SKY/WX TMP DP RH WIND PRES REMARKS N.O. INTL ARPT RAIN 77 74 90 E46G67 29.37F FOG N.O. DWNTWN HE RAIN 77 74 90 E24G40 29.41F FOG N.O. LAKEFRONT HVY RAIN 77 75 93 E51G72 29.47F VSB 1/4
-
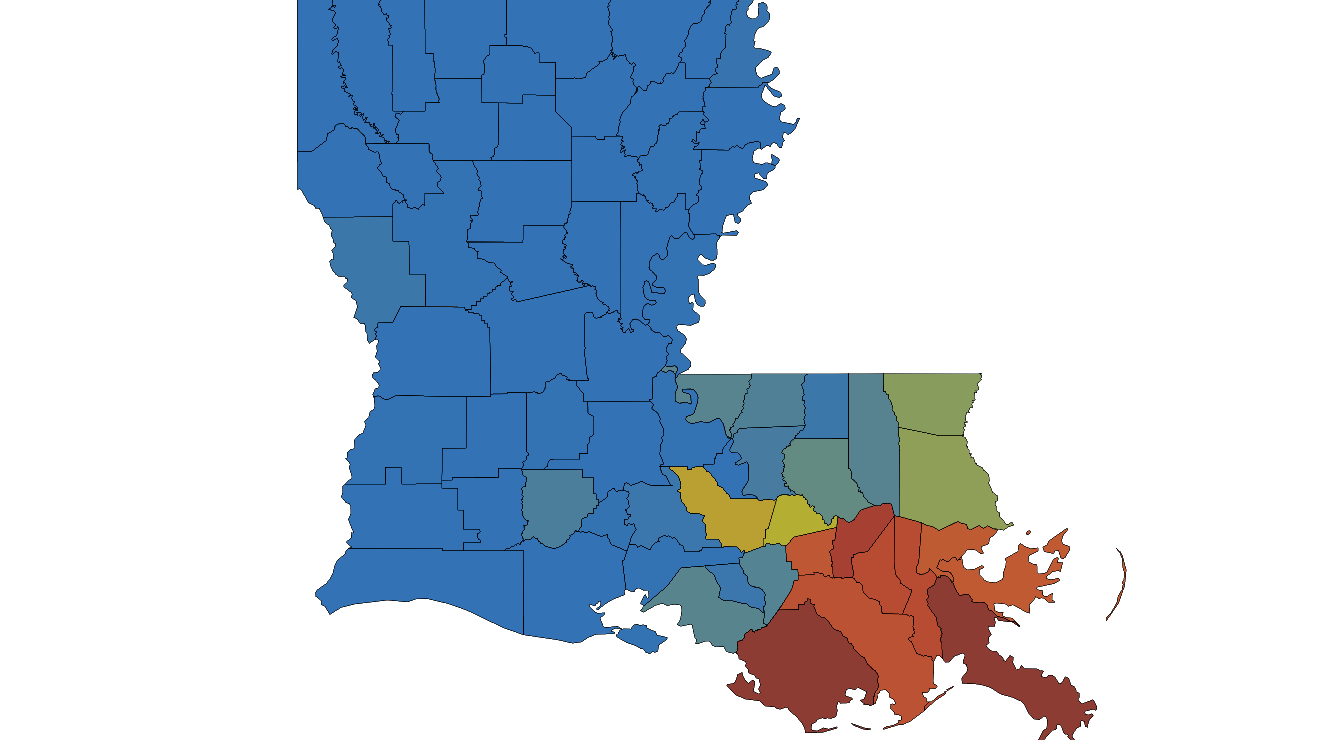
LA power outages are now 85-90% in darkest colored counties and already almost 50% N.O. area:

-
2PM CDT N.O. stations: rapid pressure falls continue and winds increasing at Lakefront. Also, note how tight the pressure gradient is based on the 3 mb/.09” difference between the airport and lakefront: CITY SKY/WX TMP DP RH WIND PRES REMARKS N.O. INTL ARPT RAIN 78 74 87 E36G59 29.43F FOG N.O. DWNTWN HE RAIN 78 74 87 NE12G35 29.47F FOG N.O. LAKEFRONT LGT RAIN 78 75 90 E53G66 29.52F FOG
-
These are the noon CDT conditions in N.O. showing gusts already to 61 mph. These will likely get much worse there during the next few hours. For a comparison, Betsy, which hit N.O. very hard, was 12 mb higher at 942 at about the time of landfall to the south vs the 930 of Ida in about the same location on a similar trajectory:1200 PM CDT SUN AUG 29 2021 CITY SKY/WX TMP DP RH WIND PRES REMARKS N.O. INTL ARPT LGT RAIN 80 74 81 NE32G61 29.58F N.O. DWNTWN HE LGT RAIN 79 74 84 NE10G26 29.60F N.O. LAKEFRONT LGT RAIN 81 75 82 E44G61 29.64F
-
That 930.8 mb makes Ida about 11 mb stronger than the 942 mb of Betsy of 1965 in about the same location on a similar trajectory.
-
0Z UKMET: LA vs 12Z at TX NEW TROPICAL CYCLONE FORECAST TO DEVELOP AFTER 60 HOURS FORECAST POSITION AT T+ 60 : 23.2N 86.0W LEAD CENTRAL MAXIMUM WIND VERIFYING TIME TIME POSITION PRESSURE (MB) SPEED (KNOTS) -------------- ---- -------- ------------- ------------- 1200UTC 28.08.2021 60 23.2N 86.0W 1007 31 0000UTC 29.08.2021 72 25.0N 87.9W 1003 36 1200UTC 29.08.2021 84 26.7N 89.8W 999 39 0000UTC 30.08.2021 96 28.2N 91.2W 990 49 1200UTC 30.08.2021 108 29.5N 91.9W 978 60 0000UTC 31.08.2021 120 30.8N 92.1W 981 39 1200UTC 31.08.2021 132 32.5N 92.1W 983 30 0000UTC 01.09.2021 144 33.3N 91.7W 990 25
-
I dug more into how far each average August model projection for fall/winter trimonthly peak missed for 2012-2020: Year: Forecast/Actual/Miss 2020: -0.6/-1.3/+0.7 2019: +0.4/+0.5/-0.1 2018: +0.9/+0.9/0.0 2017: 0.0/-1.0/+1.0 2016: -0.6/-0.7/+0.1 2015: +2.3/+2.6/-0.3 2014: +0.7/+0.7/ 0.0 2013: +0.9/-0.4/+1.3 2012: +0.9/-0.4/+1.3 2012-20 avg miss: +0.4 2021: -0.6/????/???? Note that the average miss of +0.4 doesn't tell the whole story as there are two distinct groups: - big positive misses: average of +1.1 from +0.7, +1.0, +1.3 +1.3 (2020, 2017, 2013, 2012) - small misses: average miss of -0.1 from -0.1, 0.0, +0.1, -0.3, 0.0 (2019, 2018, 2016, 2015, 2014) So, if 2021 ends up in the big positive miss group, the actual trimonthly peak would easily end up at least well into moderate La Nina range. But if it were to end up in the second group, the actual trimonthly peak would end up either as either weak La Nina or high end cold neutral. For reasons given earlier (mainly current weekly Nino 3.4 SST anomaly but with some backing by the July SOI and the OHC), I'm predicting that the fall/winter trimonthly Nino 3.4 peak will be within moderate La Nina (-1.0 to -1.4). That means I'm expecting 2021 to end up closer to the 1st group (big positive miss for August model average prediction) than the 2nd group. By the way. I'm expecting a general increase in the SOI over the next week or so. Thus the August to date average should rise. Currently August MTD is only ~+1.5. However, August as a whole should rise to over +3 and may even rise to over +4. Then we'll see whether or not Sept turns out to be a more strongly positive month more like July's +16. ----------------------------------------------------------------------- Source of August ENSO model prediction data 2012-20: IRI – International Research Institute for Climate and Society | August 2021 Quick Look (columbia.edu) Source of ONI data: https://origin.cpc.ncep.noaa.gov/products/analysis_monitoring/ensostuff/ONI_v5.php
-
I’m going moderate La Niña trimonthly peak at some point this fall/winter most likely followed by weak La Niña and then strong La Niña. Keep in mind that the August ENSO models have had on average a 0.25 C warm bias in Nino 3.4 through the fall/winter based on data from 2012-2020. Just last August, the model average for last fall and winter was for merely a borderline weak La Niña and yet it ended up with a solidly moderate trimonthly peak of -1.3 C. The models were similarly off with the prior La Niña in 2017. The last time the models were too cool in 3.4 was in 2016 when that La Niña warmed back to cold neutral more quickly than the model average predicted.
-
This week's Nino 3.4 dropped sharply from -0.4 to -0.9. The OHC remained near -0.9. OLR remains positive. The July SOI of +16.3 was the 11th most positive on record. La Nina continues to be favored for fall/winter per this: https://www.cpc.ncep.noaa.gov/products/analysis_monitoring/lanina/enso_evolution-status-fcsts-web.pdf I agree with this that La Nina is pretty heavily favored for later autumn/winter based on this combination of factors. I think the best chance is for a moderate La Nina. Consider this: Similar 3.4 SST anoms around August 18th and the subsequent winter's ENSO: 2017: -0.5 MLN 2016: -0.5 WLN 2007: -0.6 SLN 2011: -0.8 MLN 2020: -0.8 MLN 2021: -0.9 ?? 2010: -1.2 SLN Also, check out the fall/winter ENSO peak when the prior July SOI was within 5 of the 16.3 of 2021: 12.8 SLN 1998 13.4 MLN 1893 13.6 WEN 1979 14.8 NN 1878 16.3 ?? 2021 16.6 SLN 1955 17.2 WLN 1938 18.7 SLN 2010 19.0 MLN 1910 19.6 NN 1950 20.2 MLN 1879
-
Henri gets into 2nd place in the list of wettest tropical storm or hurricane at NYC with 8.05” as of 8AM! Sept of 1882, the wettest at 10.63”, was from a TS (storm #4) moving up the east coast and it wasn’t as slow a mover it appears:
-
Then why does their Twitter that I linked above say that Central Park ASOS had 1.94" 10-11 and 1.84" 11-midnight? Are we talking about the same station? "In addition to being the wettest day since 2014... the 1.94" of rain that fell from 10pm to 11pm at Central Park last night was the wettest hour on record for New York City." "The Central Park ASOS broke the daily maximum rainfall record for 8/21 with 4.45 inches of rain! Most of this rain fell over a 2 hour period, with 1.84 inches falling from 11pm to midnight."
- 1,603 replies
-
- 1
-

-
- hurricane gusts
- flooding rains
- (and 2 more)
-
Did Central Park have two hours on 8/21/21 rather than just one that belong at the top of this list? Per the NYC NWS Twitter, NYC got 1.94" 10-11 PM and 1.84" 11PM-midnight:
- 1,603 replies
-
- 1
-

-
- hurricane gusts
- flooding rains
- (and 2 more)
-
With Central Park now well over 6" and likely already approaching if not already exceeding 7" with significant rain still falling, there's a high chance based on your chart that Henri later gets to 2nd place with only Sept. of 1882 wetter.
- 1,603 replies
-
- 1
-
-
- hurricane gusts
- flooding rains
- (and 2 more)
-
And here is a 0Z UKMET image: Henri is then moving NNW as it just misses the far eastern tip of Long Island
-
And here is a 0Z UKMET image: Henri is then moving NNW as it just misses the far eastern tip of Long Island:
-
0Z UKMET: more ominous run for CT/RI/inland MA as it goes NNW to near RI/CT border and then continued NNW into west central MA TROPICAL STORM HENRI ANALYSED POSITION : 29.7N 68.2WATCF IDENTIFIER : AL082021LEAD CENTRAL MAXIMUM WINDVERIFYING TIME TIME POSITION PRESSURE (MB) SPEED (KNOTS)-------------- ---- -------- ------------- -------------0000UTC 19.08.2021 0 29.7N 68.2W 999 501200UTC 19.08.2021 12 29.5N 70.6W 984 640000UTC 20.08.2021 24 29.4N 72.7W 978 741200UTC 20.08.2021 36 29.7N 74.3W 977 660000UTC 21.08.2021 48 30.6N 74.7W 974 731200UTC 21.08.2021 60 32.7N 73.9W 967 790000UTC 22.08.2021 72 36.1N 72.4W 958 851200UTC 22.08.2021 84 39.9N 71.5W 958 810000UTC 23.08.2021 96 42.0N 72.0W 984 44 (CT/MA border)1200UTC 23.08.2021 108 43.0N 72.4W 1001 250000UTC 24.08.2021 120 43.2N 71.8W 1005 191200UTC 24.08.2021 132 43.8N 69.4W 1007 190000UTC 25.08.2021 144 CEASED TRACKING
-
0Z UKMET: more ominous run for CT/RI/inland MA as it goes NNW to near RI/CT border and then continued NNW into west central MA TROPICAL STORM HENRI ANALYSED POSITION : 29.7N 68.2W ATCF IDENTIFIER : AL082021 LEAD CENTRAL MAXIMUM WIND VERIFYING TIME TIME POSITION PRESSURE (MB) SPEED (KNOTS) -------------- ---- -------- ------------- ------------- 0000UTC 19.08.2021 0 29.7N 68.2W 999 50 1200UTC 19.08.2021 12 29.5N 70.6W 984 64 0000UTC 20.08.2021 24 29.4N 72.7W 978 74 1200UTC 20.08.2021 36 29.7N 74.3W 977 66 0000UTC 21.08.2021 48 30.6N 74.7W 974 73 1200UTC 21.08.2021 60 32.7N 73.9W 967 79 0000UTC 22.08.2021 72 36.1N 72.4W 958 85 1200UTC 22.08.2021 84 39.9N 71.5W 958 81 0000UTC 23.08.2021 96 42.0N 72.0W 984 44 (CT/MA border) 1200UTC 23.08.2021 108 43.0N 72.4W 1001 25 0000UTC 24.08.2021 120 43.2N 71.8W 1005 19 1200UTC 24.08.2021 132 43.8N 69.4W 1007 19 0000UTC 25.08.2021 144 CEASED TRACKING
-
12Z UKMET: Nantucket to Cape Cod most threatened TROPICAL STORM HENRI ANALYSED POSITION : 29.9N 66.1W ATCF IDENTIFIER : AL082021 LEAD CENTRAL MAXIMUM WIND VERIFYING TIME TIME POSITION PRESSURE (MB) SPEED (KNOTS) -------------- ---- -------- ------------- ------------- 1200UTC 18.08.2021 0 29.9N 66.1W 1004 40 0000UTC 19.08.2021 12 29.7N 68.4W 999 51 1200UTC 19.08.2021 24 29.5N 70.6W 987 61 0000UTC 20.08.2021 36 29.5N 72.5W 983 63 1200UTC 20.08.2021 48 30.0N 73.9W 981 65 0000UTC 21.08.2021 60 31.3N 74.3W 976 68 1200UTC 21.08.2021 72 33.7N 73.2W 961 85 0000UTC 22.08.2021 84 37.4N 71.3W 960 81 1200UTC 22.08.2021 96 41.1N 70.2W 962 79 near Nantucket 0000UTC 23.08.2021 108 42.4N 69.9W 986 46 near Cape Cod 1200UTC 23.08.2021 120 43.0N 68.0W 996 35 0000UTC 24.08.2021 132 43.4N 65.5W 1003 27 1200UTC 24.08.2021 144 44.2N 62.5W 1005 25
-
12Z UKMET: comes slowly west for 3 days and then turns back safely OTS TROPICAL DEPRESSION 08L ANALYSED POSITION : 31.9N 63.0W ATCF IDENTIFIER : AL082021 LEAD CENTRAL MAXIMUM WIND VERIFYING TIME TIME POSITION PRESSURE (MB) SPEED (KNOTS) -------------- ---- -------- ------------- ------------- 1200UTC 16.08.2021 0 31.9N 63.0W 1013 23 0000UTC 17.08.2021 12 31.0N 63.2W 1012 24 1200UTC 17.08.2021 24 30.7N 63.8W 1012 25 0000UTC 18.08.2021 36 30.7N 65.0W 1012 26 1200UTC 18.08.2021 48 30.7N 66.6W 1014 26 0000UTC 19.08.2021 60 31.1N 68.2W 1014 25 1200UTC 19.08.2021 72 31.1N 69.6W 1013 25 0000UTC 20.08.2021 84 31.7N 70.1W 1011 27 1200UTC 20.08.2021 96 32.9N 69.9W 1010 29 0000UTC 21.08.2021 108 34.4N 68.4W 1009 30 1200UTC 21.08.2021 120 35.6N 65.7W 1010 29 0000UTC 22.08.2021 132 35.9N 62.3W 1010 29 1200UTC 22.08.2021 144 35.0N 59.1W 1010 30
-
Indeed, the 0Z EPS had some members threatening the E coast as you showed. However, the 12Z was less threatening.
-
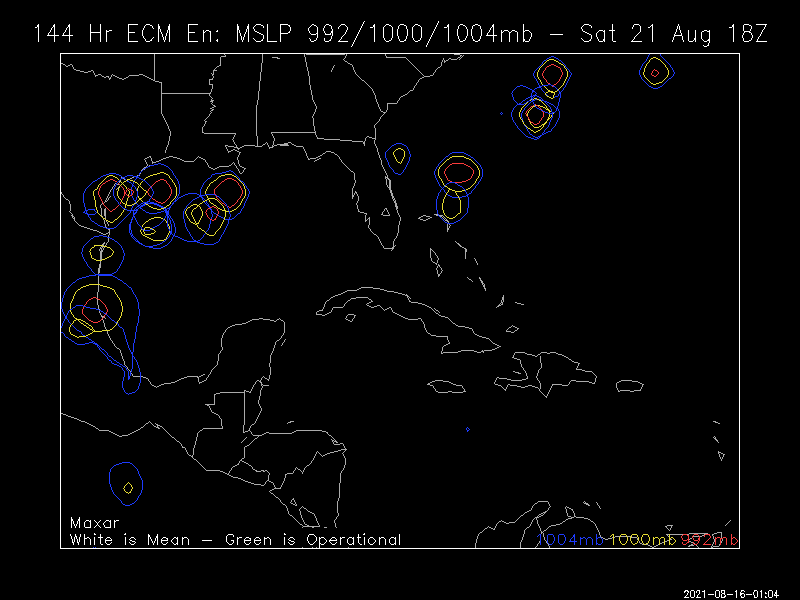
The 18Z Euro ens goes back to having a few US threats from 96L, similar to the 0Z and 6Z, with 3 members showing a TS+ moving toward the SE US at the end of the run though keep in mind that's only 6% of the members thus making them outliers:
-
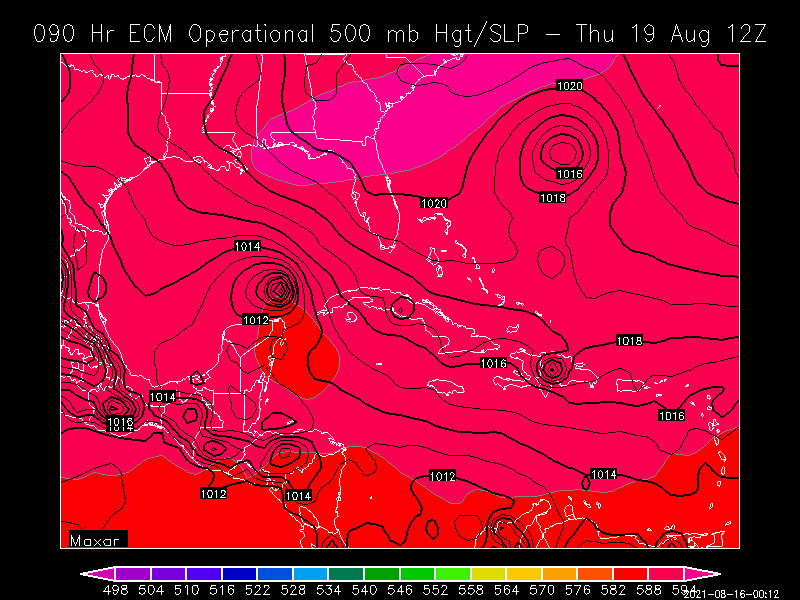
Here's the end of the 18Z Euro. It would likely recurve rather sharply soon after because the 500 mb ridge is then weakening rapidly and prior Euro runs did recurve it then. However, this run is the strongest yet and it is the furthest west. So, even though odds per current models strongly favor a safe recurve, the more important thing here to note may be the Euro trend. Also, how does Grace affect the steering, a possible fly in the ointment? Also, let's see what the 18Z Euro ens members do. The 0Z and 6Z both had a handful of E coast threats (5-10% of the members). Then the 12Z pretty much backed off.