GaWx
-
Posts
14,720 -
Joined
Content Type
Profiles
Blogs
Forums
American Weather
Media Demo
Store
Gallery
Everything posted by GaWx
-
Thank you. Yes, it is working. It has -1.4 for AS.
-
I haven’t tried it. Please provide a link.
-
https://www.cpc.ncep.noaa.gov/data/indices/wksst9120.for - Nino 3.4, is at -0.8 vs -0.6 a week before - It appears that they've just restated past weeks to reflect on the new dataset. Remember my post about that last week's showing a 0.7 cooling from 0.0 to -0.7? Now last week shows only a 0.1 cooling from -0.5 to -0.6
-
It doesn't get much more awesome than today with temps in the low 70s and dewpoints in the low 40s here...near ideal weather for outdoors!
-
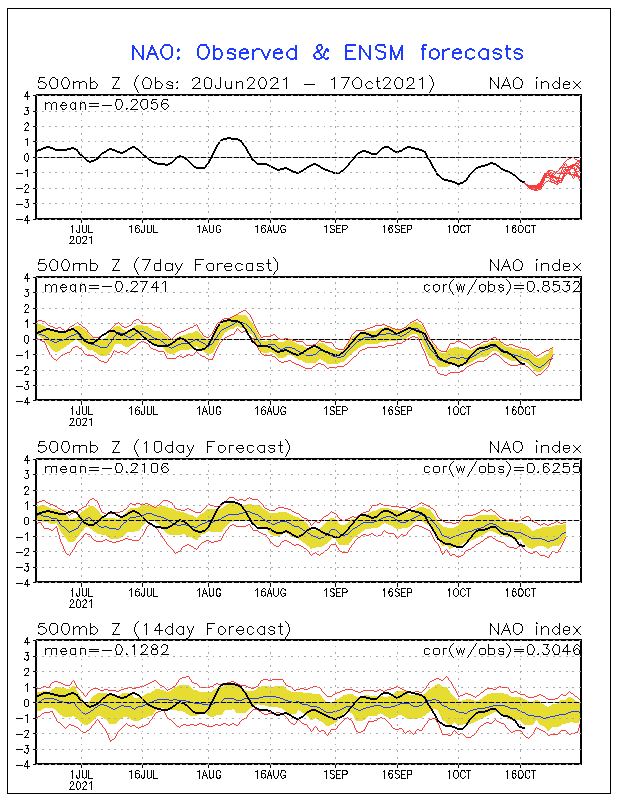
It is a shame (for those who prefer cold E US winters) that there is virtually no correlation of Oct NAO to winter NAO during La Niña because there's a chance for it to be the most -NAO October on record for a non-El Nino (back to 1950), which is currently 2012’s -2.06. For whatever reason, the monthly NAO is often close to double what the dailies average out to. At a minimum, it seems to be at least 1.67 times the daily average. Based on that, this month has a good chance of ending up sub -1.8 and could easily end up sub -2.0 (see GEFS based forecast below). Here is the link to the monthlies back to 1950: https://www.cpc.ncep.noaa.gov/products/precip/CWlink/pna/norm.nao.monthly.b5001.current.ascii.table The following Octs were sub -1.7: 1960, 1968, 1980, 1992, 1997, 2002, 2006, and 2012 The subsequent DJF NAO along with ENSO: 1960: +0.3/not El Niño 1968: -1.4/El Niño 1980: +0.7/not El Niño 1992: +0.9/not El Niño 1997: -0.2/El Niño 2002: -0.2/El Niño 2006: +0.4/El Niño 2012: 0.0/not El Niño Only one of the 8 subsequent winters had a strong -NAO (1968) and it was El Niño. Two others were slightly -NAO and they were also El Niño. The 4 non-El Niño winters were in the 0.0 to +0.9 range and averaged +0.5. Looking at all 8 winters, they averaged +0.1. Conclusion: Despite the forecast for Oct of 2021 to have one of, if not THE, most -NAO on record for any Oct, it by no means is predictive of a -NAO this winter. Of course, that doesn’t mean it can’t end up that way. I’m just saying that history says that this month being so strongly -NAO doesn’t mean an increased chance for -NAO this winter vs climo based chances. Furthermore, this winter being La Niña, if anything, reduces the chances based on ENSO climo. Here’s the impressive GEFS NAO forecast:
-
Today's SOI was +28 (though that should be a peak for awhile as it will now drop) , the 30 day is +11, and the 90 is at +9. https://www.longpaddock.qld.gov.au/soi/
-
The 0Z GEFS maintains the moderate signal for W Caribbean genesis mid to late next week that then moves NE toward far south FL or FL Straits.
-
The period in and around 10/17-21 has been quite active in terms of frequency on and near south Florida/Bahamas based on past seasons. It is essentially the final peak period for that area for the season. Will there be another for around that period? The 12Z GEFS was also pretty active. Perhaps this one isn’t a fake like the one earlier. Let’s see if future GEFS runs persist with this activity.
-
Model consensus is suggesting that the SOI will spike up to the +30 to +40 range within a few days before a short term plunge that may take it briefly slightly negative before it rises back up.
-
Lol, I had just posted the same thing about the changed data source while you were typing. So, how much of the 0.7 drop is due to it is an unknown. There could still have been a legit decent drop embedded in that.
-
I'm not getting carried away. I just think the rarity is interesting, not necessarily important from a predictive standpoint. Besides, a big move like this is hardly ever immediately folIowed by another big move in the same direction. It is almost as if it needs to take a breather. I also noted a similar rarity here a couple of months ago when Nino 3.4 warmed by 0.6 in just one week. Rare large moves in either direction are fun for me to compare vs history. So, Nino 3.4 is now at -0.7, which is still a good ways from implying an oncoming moderate 3 month (ONI) peak. The weeklies would likely have to reach -1.3 or so. Having said all of this, something very interesting was noted in today's weekly ENSO report: "Starting this week, the weekly sea surface temperature data is based on OISSTv2.1". So, a portion of today's "cooling" may have been due to a changed dataset.
-
I just checked all of the weeks on record (~1,650 of them back to 1990) in Nino 3.4. It turns out that today's reported 0.7 anomaly cooling ties the largest on record with 11/8/2017 and 6/3/1998. So, this much of a cooling in just one week has been about a once every 10 year occurrence when averaged out over the 31 year record. I find stats like this fun to follow.
-
Wow, Nino 3.4 anomaly cooled a whopping 0.7 C to -0.7 C! I’ll check the records when I have time to see how this amount of anomaly cooling in just one week ranks with other weeks. It has to be near the top. Perhaps this is a reflection of the strong +SOI trends of recent weeks. There often is a couple of week lag from SOI to SST. Also, keep in mind that the Monday reports are based on the average forecast the prior week meaning about a 5 day reporting lag.
-
The medium range model consensus has clearly trended cooler since the Friday morning runs for later this month for the E US. They have the upper trough at that time further west into the E US vs having been mainly offshore in older runs. That has continued through the 18Z GFS/GEFS today.
-
Don, The medium range model consensus has clearly trended cooler since the Friday morning runs for later this month for the E US. They have the upper trough at that time further west into the E US vs having been mainly offshore in older runs. That has continued through the 18Z GFS/GEFS today.
-
Wow, down below -1.5! Despite a still very reluctant drop in the SSTs to this point, that along with 30/90 day SOI averages near +10 still give me a good deal of confidence that the upcoming Nina ONI based peak will still reach moderate levels. We'll see.
-
Today's 15 day EPS 2M temp anomaly map (see below) is even warmer than the one I posted above with anomalies of +5 to +8 for most of the active SE members! This takes us through early 10/18. With progs like this and if no cooldown shows up within a few days, we would then start to look at a decent shot at a top 3 warm October in some areas of the SE: Warmest Octobers on record (hopefully I didn't miss any when I looked at the list): 1. RDU: 69.3 1919 68.1 1941 67.4 2007 65.8 2019 2. ATL: 70.8 1919 69.8 1984 69.6 2016 69.4 1941 3. Nashville, TN: 68.2 1919 67.9 1947 67.8 1941 67.7 2016
.png.bbf18751909e27867a3ecd474d2cd5bc.png)
-
The 9/21 OHC of -1.28 is the coldest for any month since 12/10 and it appears to be cooling more. Back to 1979, the only cooler Septs were in 2010, 1998, and 1983. When also considering the strongly +SOI of late Sep along with general +SOI trends, I still see no reason to back away from a moderate La Nina peak this fall/winter.
-
I vaguely recall something similar about a specific set of analogs that i once analyzed (perhaps ENSO related)...maybe weak El Nino? But anyway based on current knowledge, I see no reason to expect a cold winter based strictly on this October being warm (assuming it ends up that way). I just looked and see no reverse correlation. Any correlation appears to be rather small and may be a small positive one, if anything. Moreover, based on it being La Nina, there still being near record warm anomalies in the W Pac/MC (which is generally a warm indicator in winter because it tends to favor the warmer MJO phases like has been the case overall for 10+ years), with there having been a gradual longterm trend of warmer winters due to GW, and with the Euro/CFS/Maxar favoring warmth, I see no reason to go for a cold winter at this time. My wild guess right now is to go NN to slightly AN for Dec and then AN for Jan and Feb. But even then, I'm very much still looking forward to my favorite season because climo tells me that it will still be at least 15-20 cooler than what we're now having along with much lower dewpoints. That can never be a bad thing as I don't get hung up on where we are vs normals as much as I used to. I just want to be able to go outside to enjoy refreshing air on a alot of days. Also, keep in mind the lack of skill in longterm /seasonal forecasting. And even in a "warm" winter, there will almost always be a few cold snaps. So, big swings/variety is typical of most winters unlike monotonous summers.
-
Don, Check this 12Z EPS 2M anomaly map out for the first half of October: this would be about as warm as it has ever been on record for the eastern 3/4 of the US overall. These temps would be normal for the first half of Sept! The 12Z GEFS and GEPS are similar. At NYC, this implies a first half of Oct that is 10+ warmer than normal when taking into account a 3 F cold bias there over the last month, which means that temps would be near their normal for Sept 1-15:
.png.154f6c4e177e3b9a5cfd9d154ade22b5.png)
-
Great news for warmth lovers (I'm not one of them but I'm just glad summer is over): this is about as warm as it has ever been on record for the eastern 3/4 of the US overall (though not specifically the SE) in the first half of October on the EPS (CMC and GEFS similar): these show +4 to+7 for most of the active SE US members and the EPS has done well recently: These temps would be normal for the first half of Sept!Aside: At NYC, this implies a first half of Oct that is 10+ warmer than normal when taking into account a several degree cold bias there over the last month! That implies it would be close to the normal for Sep 1-15 there:
.png.acf2fc6b6df66dc8168aac3c506a4114.png)
-
12Z UKMET says look out Bermuda as this run’s center only barely misses it to the east and thus hits it hard with its northern and western side as still a major hurricane (although Bermuda can still probably handle it well. If I were going to have to be stuck on an island in a hurricane, I’d pick Bermuda for sure): GLOBAL MODEL DATA TIME 1200UTC 26.09.2021 HURRICANE SAM ANALYSED POSITION : 13.9N 50.2W ATCF IDENTIFIER : AL182021 LEAD CENTRAL MAXIMUM WIND VERIFYING TIME TIME POSITION PRESSURE (MB) SPEED (KNOTS) -------------- ---- -------- ------------- ------------- 1200UTC 26.09.2021 0 13.9N 50.2W 947 104 0000UTC 27.09.2021 12 14.5N 50.6W 963 88 1200UTC 27.09.2021 24 15.4N 51.5W 970 76 0000UTC 28.09.2021 36 16.3N 52.3W 975 66 1200UTC 28.09.2021 48 17.1N 53.4W 976 67 0000UTC 29.09.2021 60 17.8N 54.4W 978 61 1200UTC 29.09.2021 72 18.6N 55.8W 978 63 0000UTC 30.09.2021 84 19.8N 57.6W 971 72 1200UTC 30.09.2021 96 21.1N 59.7W 966 74 0000UTC 01.10.2021 108 23.3N 61.5W 964 79 1200UTC 01.10.2021 120 25.9N 63.4W 962 79 0000UTC 02.10.2021 132 29.4N 64.5W 956 85 1200UTC 02.10.2021 144 33.7N 63.8W 943 105
-
The 12Z EPS 51 members have no SE US landfalls with only one that skirts the Outer Banks. However, it does have several that landfall in the NE US:
-
0459 PM HEAVY RAIN SAVANNAH AIRPORT 32.13N 81.20W 09/20/2021 M5.40 INCH CHATHAM GA ASOS THE SAVANNAH/HILTON HEAD INTERNATIONAL AIRPORT (KSAV) HAS MEASURED 5.40 INCHES OF RAIN SINCE MIDNIGHT. THIS IS A NEW DAILY RECORD, BREAKING THE PREVIOUS RECORD OF 2.12 INCHES FROM 1885. ADDITIONAL RAINFALL WILL OCCUR THROUGH THE REST OF THE EVENING. Edit for update: Followup: the rain has been near constant and widespread much of the day into this evening. There has been no thunder/lightning/wind. Just rain, rain, rain. Sometimes heavy, sometimes moderate or light. Then the heavy would return. Lots of street flooding, made worse this evening by a high tide. On radar, the rain area seems to be stuck with moisture continuing to converge on this area from both the gulf and Atlantic. THE SAVANNAH/HILTON HEAD INTERNATIONAL AIRPORT (KSAV)IS UP TO 6.36 INCHES OF RAIN SINCE MIDNIGHT.UNOFFICIALLY, THIS NOW RANKS AS THE 17TH WETTEST DAY ON RECORD ALL TIME(RECORDS GO BACK TO 1871). ADDITIONAL RAIN EXPECTED THROUGH MIDNIGHT.
-
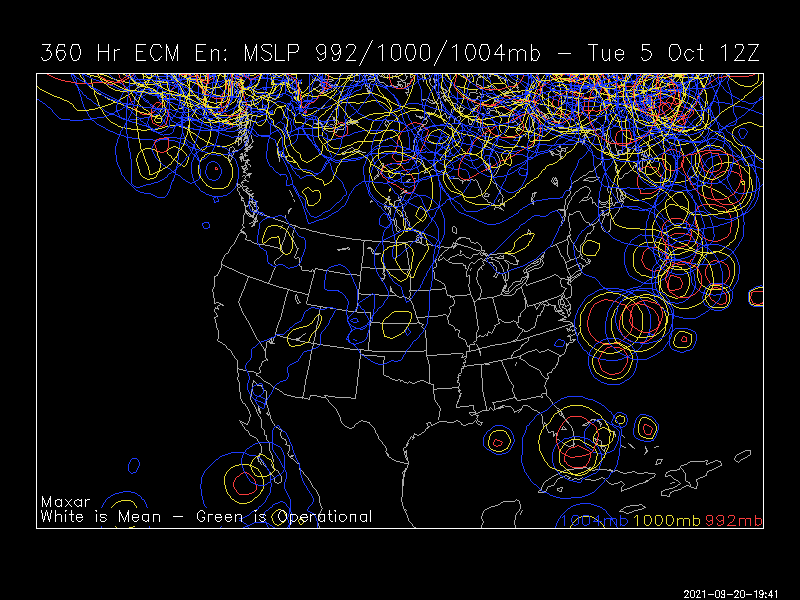
Good news for turtlehurricane as his boredom may have a chance to end! Out of 51 12Z EPS members, 2 hit S FL from the SE/S as hurricanes, 1 member is in the GOM moving NE, and just about all of the rest miss the CONUS. Even though there are only three assumed hits, ~25% make it at least as far W as 70W, which is uncomfortably too close to feel confident about a safe recurve from the CONUS based on this run. You can see the two S FL hits on this 360 hour map as well as the one in the GOM, which is moving NE: