GaWx
-
Posts
19,219 -
Joined
Content Type
Profiles
Blogs
Forums
American Weather
Media Demo
Store
Gallery
Everything posted by GaWx
-
Charlie, 1) This chart was posted by Chris in his thread on the Midwest warming hole: note the reduced warming or even slight cooling in much of the MW during summer vs most other areas. This is despite large increases in crop sizes. 2) From Midwest pro meteorologist Mike Maguire: “On the albedo of global greening absorbing more sunshine and warming the planet. I can debunk that myth quickly. We know that the MOST warming is taking place in the coldest places and at the coldest times (higher latitudes during the Winter and at night). Those are also the times when albedo from the sun has the LEAST impact.” “The nights (with no sun) have been warming the most, days the least. Also, the driest locations with the lowest humidity are warming the most. This is because of the radiation physics of CO2 and H2O and not albedo. In areas with the highest water vapor content, water vapor crowds out much of the CO2 absorption from the same bands of absorption. Some of the radiation absorption bands are already saturated from H2O in areas with very high dew points. In drier areas........which includes ALL cold places, CO2 is able to absorb more long wave radiation because of the absence of H2O absorbing at the same bands. There's no disputing this proven law of radiation physics!”
-
It has been ~tied w/‘22 & ‘23 since ~Mar 23rd.
-
Starting yesterday, absolutely awesome wx from my perspective. This will continue through the weekend.
-
This reminds me of an important point, the CO2 fertilization effect. Increased atmospheric CO2 increases plant growth due to increased photosynthesis. Also, warmer higher latitudes can lead to an increase in vegetation at higher latitudes due to a longer growing season. This increased plant growth has increased the net greenness of the earth over the last few decades (see image below). That includes much of the US Midwest, which has lead to a cool down there in summer: “Carbon dioxide is not only a pollutant but a fertilizer — a key ingredient in photosynthesis that helps plants grow. Some farmers inject CO2 into their greenhouses to accelerate plant growth. But now we’re fertilizing plants on a global scale: In the last two centuries, NASA reports, humans have increased the CO2 content in the air by roughly 50 percent. All that extra CO2 is accelerating leaf growth, and satellites can see it.” The above writeup and the image below are from here: https://www.vox.com/down-to-earth/2024/2/7/24057308/earth-global-greening-climate-change-carbon So, this is a natural negative feedback to AGW. Between the cooling due to increased greenness blocking the sunlight as well as holding soil moisture better and an increase in the amount of CO2 being absorbed due to increased vegetation, there is an increase in uncertainty as to how much the globe will actually end up warming in total. Could it eventually cause an equilibrium and halt GW at some point? Is this negative feedback being properly modeled? Furthermore, the increase in crop sizes has been resulting in an increase in food supply. So, although I’m not trying to minimize the negative effects of increased CO2, I’m saying the effects of increased CO2 are not all bad and thus the good effects should be included in any discussion to give a more honest assessment of the effects of increased CO2. Bad effects include: - worse/more frequent land heat waves, which increases deaths from excess heat - increased sea level due to melting land ice leading to increased coastal inundation - increased energy usage for AC - increased marine heatwaves/coral bleaching - increased frequency/intensity of flooding events due to increased atmospheric moisture content that can be held by warmer air - increased/stronger hurricanes due to warmer oceans - increased flooding from hurricanes due to slower average movement speed due to slower average steering Good effects include: - increased food supply due to CO2 fertilizer effect - less frequent/intense cold waves. There’s evidence that extreme cold has killed more people than extreme heat. Thus, more lives may be saved when netting out decreased cold related deaths vs increased heat related deaths: https://www.forbes.com/sites/joshuacohen/2023/07/19/excessive-summer-heat-can-kill-but-extreme-cold-causes-more-fatalities/amp/ - decreased energy usage for heating. Current US natural gas storage is near record high levels for late March due largely to the warm winter. In summary, increased CO2 has many very detrimental effects. However, there are some beneficial effects that should also be acknowledged in an honest assessment even if we assume that CO2 increases are more harmful than beneficial. Also, is it possible that negative feedbacks due to increased vegetation eventually will halt GW and can climate models accurately account for this?
-
Hopefully for the US 2024 will end up like 2010, one of their analogs. That year there were zero H hits and only 2 TS hits (one on the low end) on the lower 48.
-
Historic -NAO intensity coming Mar 31 through early April
GaWx replied to GaWx's topic in Weather Forecasting and Discussion
Today’s NAO is -2.00, which is the most negative of any day Feb 15th through April 7th for the years 1950-present. The old record for that period was -1.84. Also, there have been record daily -NAOs the last five days: https://ftp.cpc.ncep.noaa.gov/cwlinks/norm.daily.nao.gefs.z500.120days.csv -
Today’s NAO is -2.00, which is the most negative of any day Feb 15th through April 7th for the years 1950-present. The old record for that period was -1.84. Also, there have been record daily -NAOs the last five days: https://ftp.cpc.ncep.noaa.gov/cwlinks/norm.daily.nao.gefs.z500.120days.csv
-
The Conyers, GA, tornado was rated as EF-2. Fortunately no more than a couple of minor injuries were a result: "An EF-2 tornado with maximum winds of 115 mph traveled ENE 9.5 miles across Rockdale County, including the city of Conyers, downing hundreds of trees, many on homes, cars and businesses. Two injuries were reported.”
-
So far it has been a warm spring averaged out. April will likely end up warmer than normal, too. These intermittent cooldowns can’t keep up with the warm periods.
-
Historic -NAO intensity coming Mar 31 through early April
GaWx replied to GaWx's topic in Weather Forecasting and Discussion
This very strong -NAO has included record daily strong -NAOs Mar 31 through today with another record for the date expected tomorrow. Tomorrow’s is being forecasted by GEFS to be the strongest -NAO daily of this stretch. Daily records go back to 1950. -
And this -NAO has consisted of record daily strong -NAOs Mar 31 through today with another record for the date expected tomorrow. Daily records go back to 1950.
-
That Conyers tornado looked very scary on the radar with a clearcut circulation. Hopefully nobody got hurt and the damage wasn’t too bad. ———— “There have been 71 recorded wind events in Conyers. The most severe event was an F2 tornado, which occurred in 1973. Spotlight: An F2 Tornado Damages: $275,000,000 Date: Mar 31, 1973” https://riskfactor.com/city/conyers-ga/1319336_fsid/wind
-
They’ve just increased the tornado threat level somewhat for tomorrow for E NC/far SE VA/far NE SC from 2-5% to 5-10%.
-
Eastern AL/western GA overnight... In response to the amplifying midlevel trough/deepening cyclone over the MS/OH Valleys, deep-layer flow and low-level moisture advection will increase tonight across AL/GA. A surge of upper 60s boundary-layer dewpoints and strengthening low-level shear both appear supportive of supercells/tornadoes overnight in a broken band ahead of the synoptic cold front. An isolated strong tornado or two will be possible. https://www.spc.noaa.gov/products/outlook/day1otlk.html
-
Regarding just GA/NC/SC/FL: Look out for potential tornadoes tonight in much of GA, especially W portion, as well as in the W portions of NC/SC/N FL. The overall threat is higher than it appeared on Sunday when I last posted about this. Eastern AL/western GA overnight... In response to the amplifying midlevel trough/deepening cyclone over the MS/OH Valleys, deep-layer flow and low-level moisture advection will increase tonight across AL/GA. A surge of upper 60s boundary-layer dewpoints and strengthening low-level shear both appear supportive of supercells/tornadoes overnight in a broken band ahead of the synoptic cold front. An isolated strong tornado or two will be possible. https://www.spc.noaa.gov/products/outlook/day1otlk.html
-
In GA, new record high minimums will likely be set for April 2nd in Atlanta, Athens, Rome, Gainesville, Macon, and Valdosta among other locations. Among the official obs in GA, all lows as of this morning were 61-68. The warmest was at Peachtree City, which is often one of the cooler cities. In SC/NC Greenville, Charlotte, Asheville, Raleigh, and Fayetteville among others look to set new record high lows while Columbia looks to tie. If Asheville’s 63 holds, it would be the warmest low so early in the season.
-
At KSAV (airport) March came in near normal with precip (3.81” actual vs 3.50” normal) and 3.4 warmer than normal (63.4 vs 60.0). Heaviest day of rainfall was 1” (1st). There were 11 days of measurable rain. Warmest was 87 (15th) while coldest was 40 (11th, 19th). Six days averaged BN (2 or more BN) and only one day MBN (8 or more BN) while 20 days averaged AN (2 or more AN) and 6 days MAN (8 or more AN).
-
Fwiw (not much with this very small sample plus the new climate we’re in and predicting ONI this far out very difficult)(I’ll need to delete this post/image soon due to attachment limits):
-
Regarding 1850-1950 per Eric Webb’s table for those who may be curious, 1916-7 was a similarly very strong Niña with a -2.1 trimonthly dip (super Niña). No other 1850-1950 Niña is comparable per Webb as the next strongest are two that dipped to -1.4 during the early 1890s. https://www.webberweather.com/ensemble-oceanic-nino-index.html
-
The next strong cold front will bring ahead of it convection into the SE mainly Tue night into Wed. Severe potential chance is highest in N GA though even that isn’t too high. After the front goes through, much cooler dominates the rest of the week. The coldest lows will be mainly in the mid 30s north to low/mid 40s over S SC/S GA/N FL. Some frost will be possible early Fri and Sat mornings where it gets down into the mid 30s though winds may stay up enough to keep it limited even in those areas. Marginal freezes will be limited to the mountains. Highs will be great for outdoor activities with mainly upper 50s to mid 60s GA/SC/NC and low 70s N FL together with low RHs, which will increase the fire danger Thu-Sat afternoons.
-
Happy Easter wishes to everyone! The wx here has been awesome for so many days in a row! Had two good walks prior two days and enjoyed sitting IMBY yesterday evening just relaxing and watching Mother Nature. Stopped to smell the roses.
-
0Z UKMET has light accumulating snow as far south as Long Island, similar to its two prior runs. There is a forecasted record strong -NAO for 3/31-early April to take into consideration in trying to determine the chances for a further south storm track. So, the CMC, though not the best model, isn’t alone among the more credible models with accumulating snow that far south due to a similarly further south surface low track on the UKMET vs the GFS/ICON. Regardless, the ridiculously heavy snow amounts that far south on the CMC are hard to take seriously at this time. There’s no big Arctic airmass in place like was the case in 1982.
-
There was also a strong -NAO then but not as strong as what’s coming.
-
Historic -NAO intensity coming Mar 31 through early April
GaWx replied to GaWx's topic in Weather Forecasting and Discussion
Not much directly as it will fortunately be over before then. -
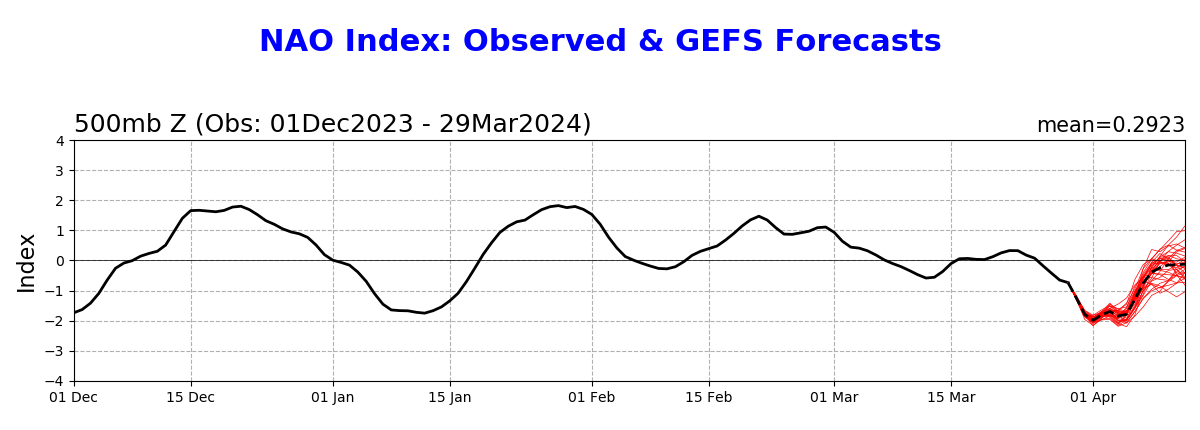
- The 3/29 0Z GEFS run’s mean NAO prediction (see image below) of ~-1.75 for 3/31 is ~tied for the daily record low NAO for all of March (records go back to 1950)! The current March record is -1.75 (3/22/1980). It will also easily beat the current record low for March 31 of -1.3 (1975). - This run is predicting the lowest NAO to be ~-1.95 to -2.00 (on 4/1). Should that verify closely, it would be a record low NAO (back to 1950) for the entire period covering Feb 15th through April 7th! It will also obliterate the current record low for April 1 of -1.2 (1975). - This run implies there will be daily record low NAOs March 31-April 2nd and possible daily record lows April 3rd-5th. - Related to this, the model consensus has a very strong nor’easter for ~April 4th. Daily NAO back to 1950: https://ftp.cpc.ncep.noaa.gov/cwlinks/norm.daily.nao.cdas.z500.19500101_current.csv