GaWx
Members-
Posts
18,051 -
Joined
Content Type
Profiles
Blogs
Forums
American Weather
Media Demo
Store
Gallery
Everything posted by GaWx
-
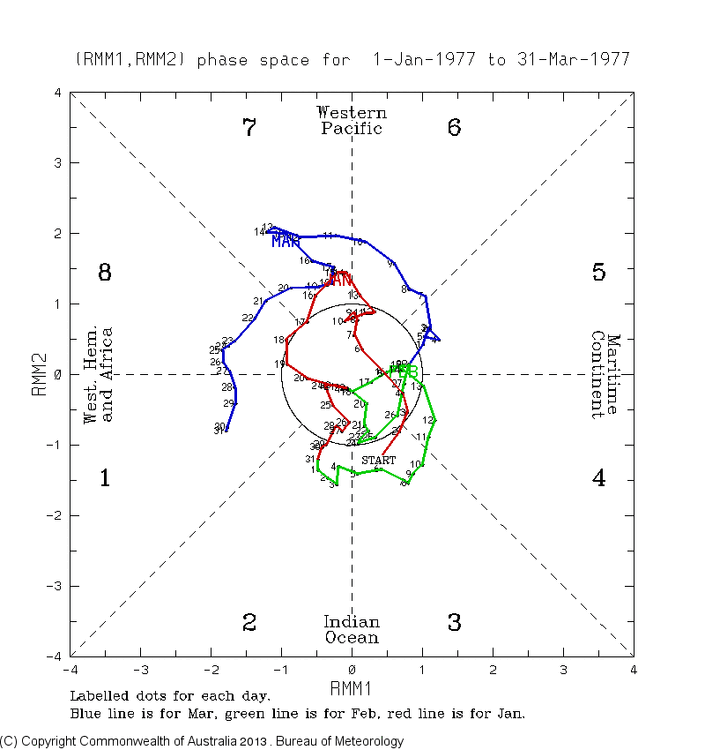
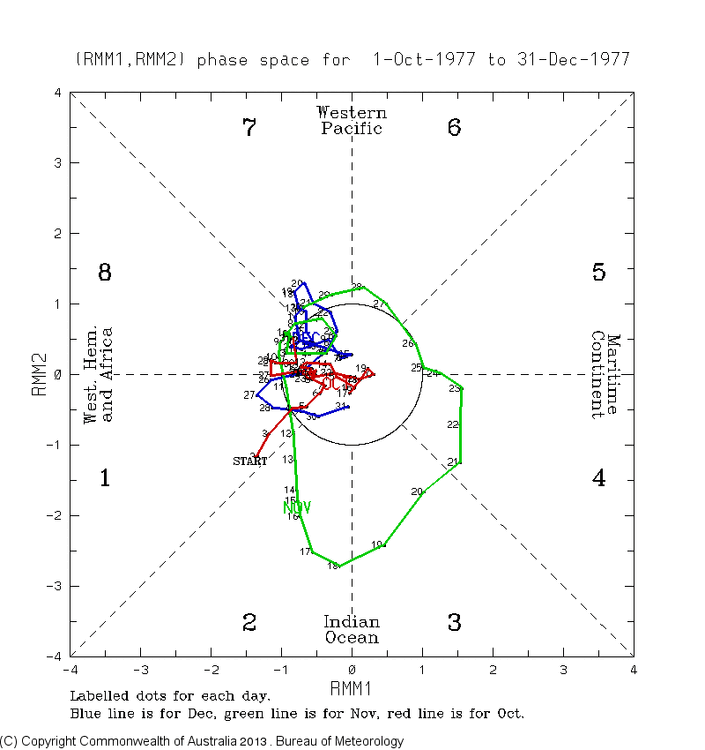
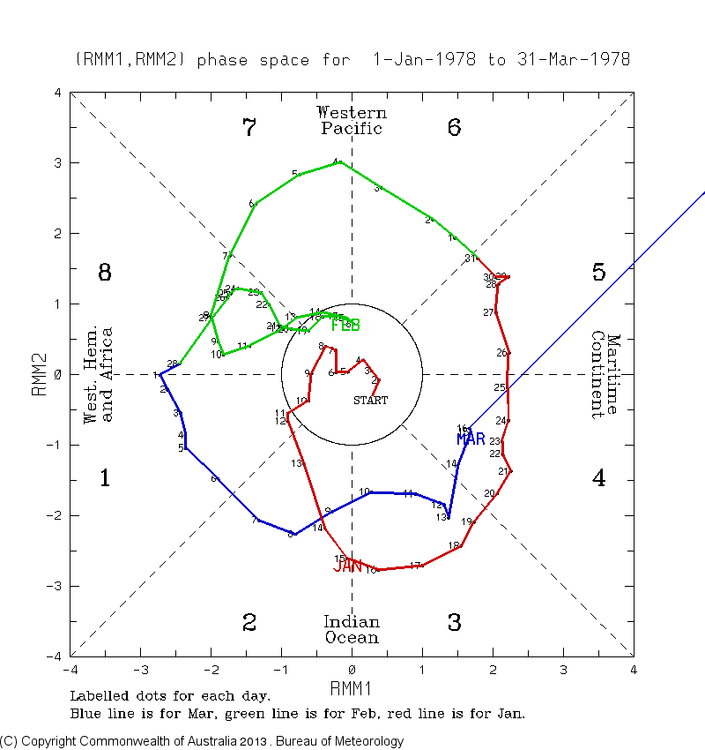
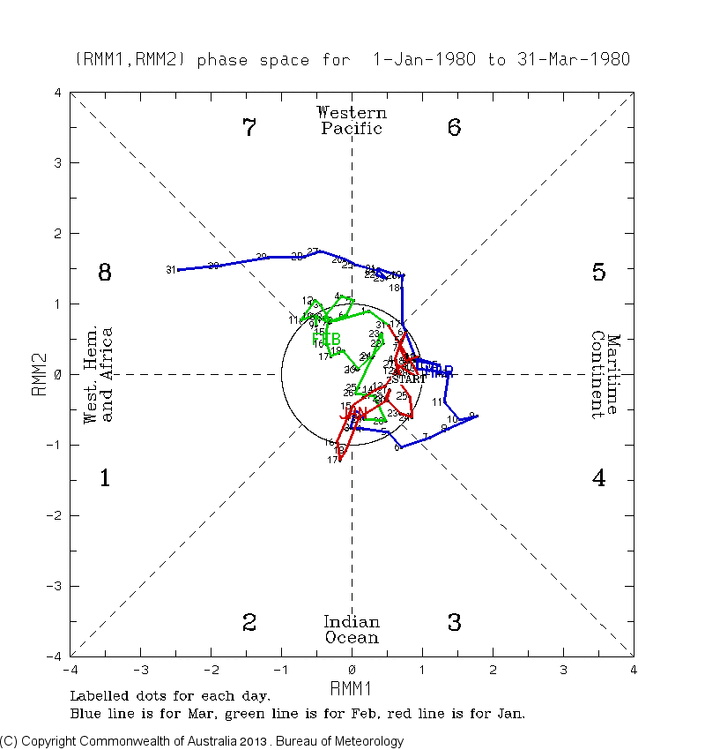
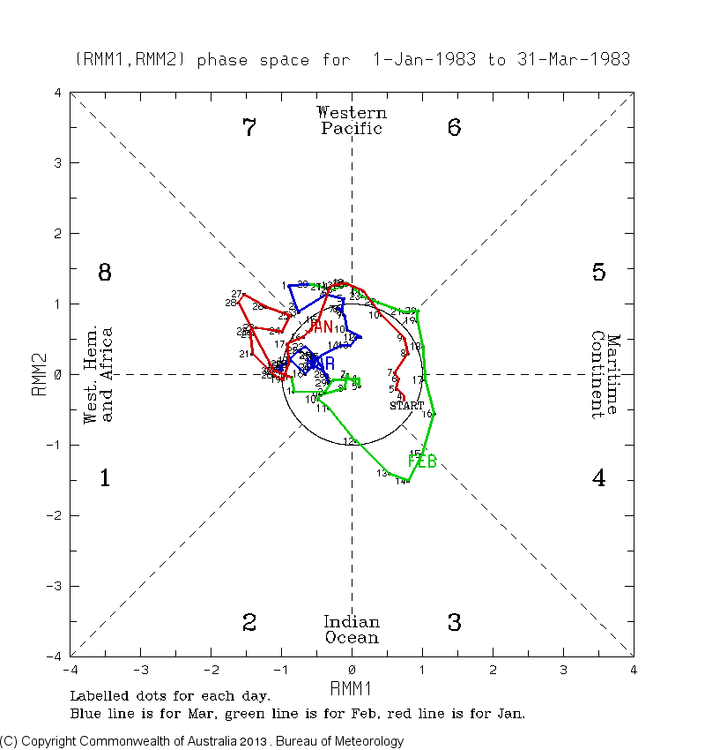
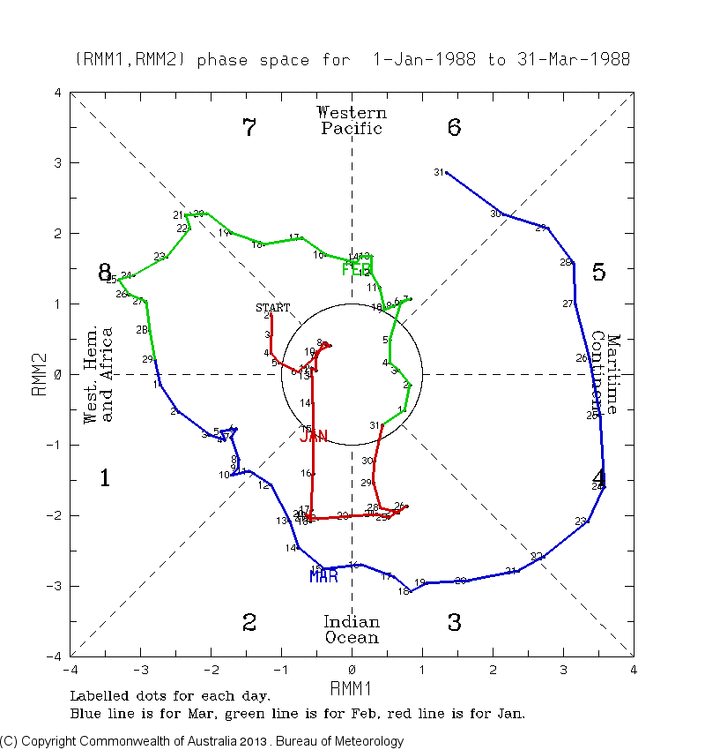
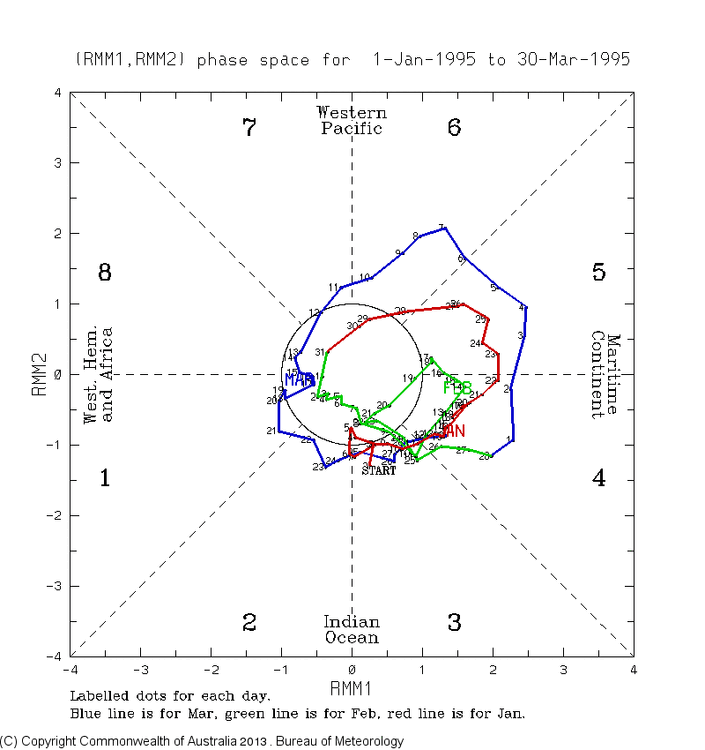
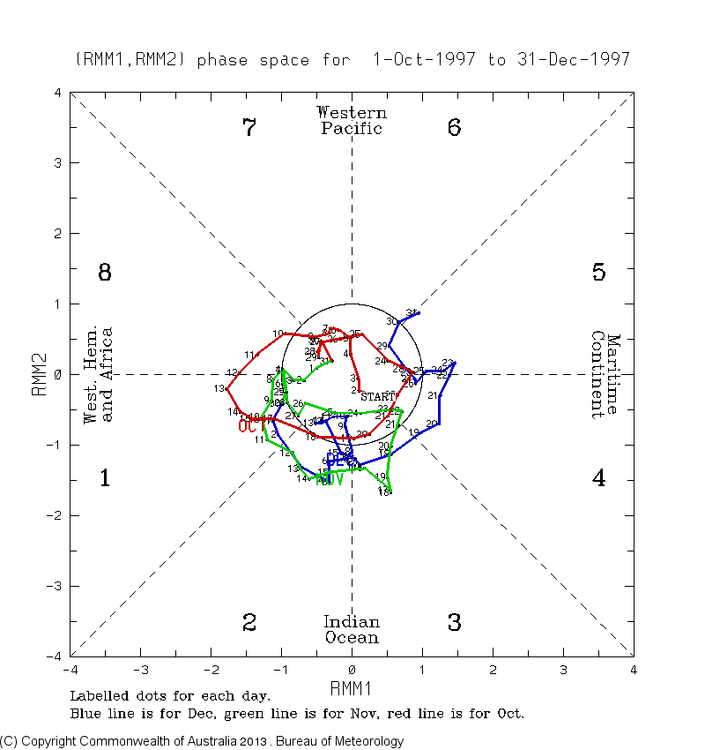
I just posted this in the main ENSO thread and feel this is very relevant to prospects for cold in the SE during the upcoming winter. Bottom line: best chances for extended intense cold during El Niño winters are suggested (based on Nino winters since 1976-7) to be when the MJO is weak (including inside the COD), especially when mainly left side weak:
-
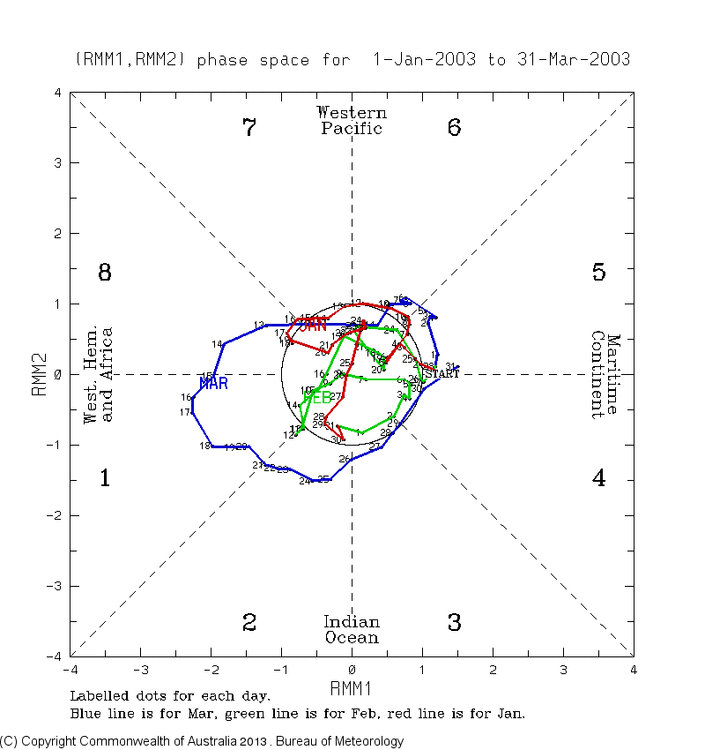
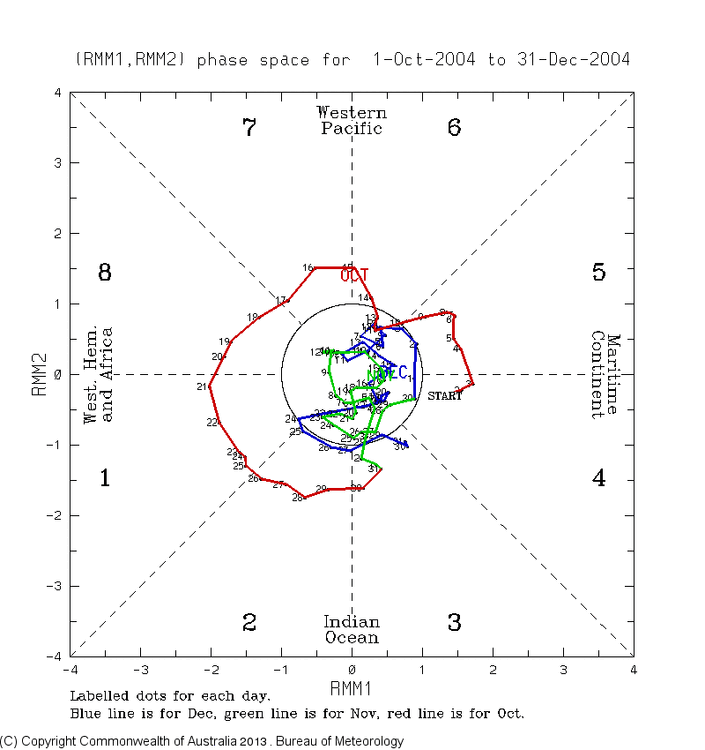
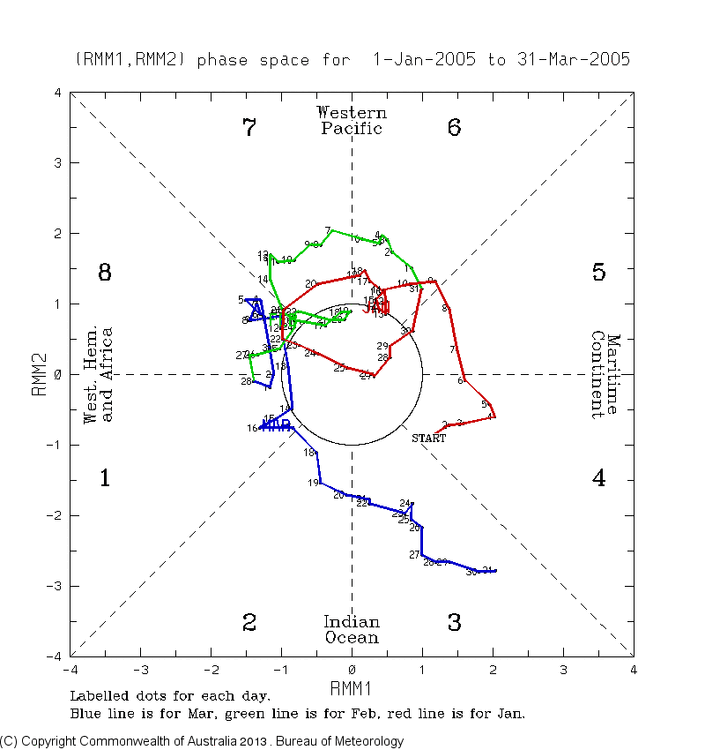
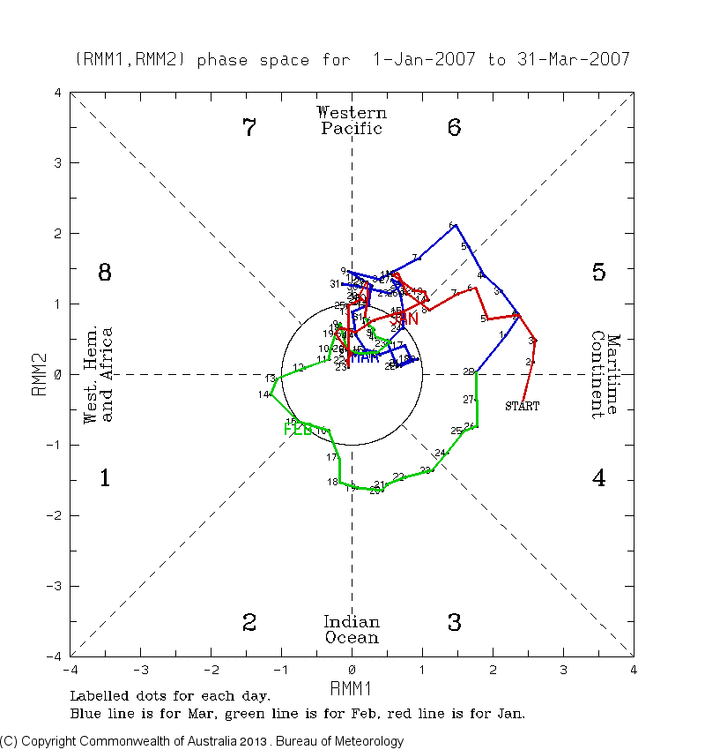
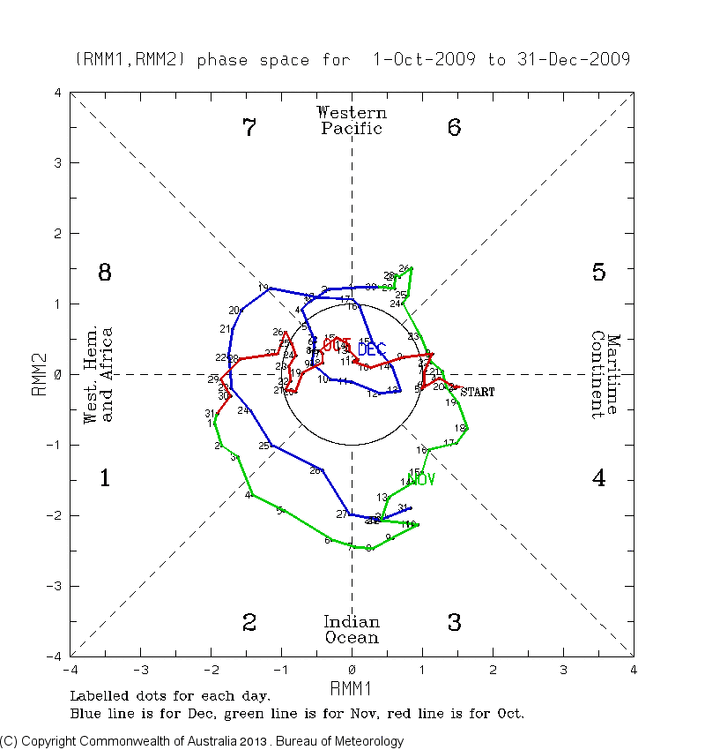
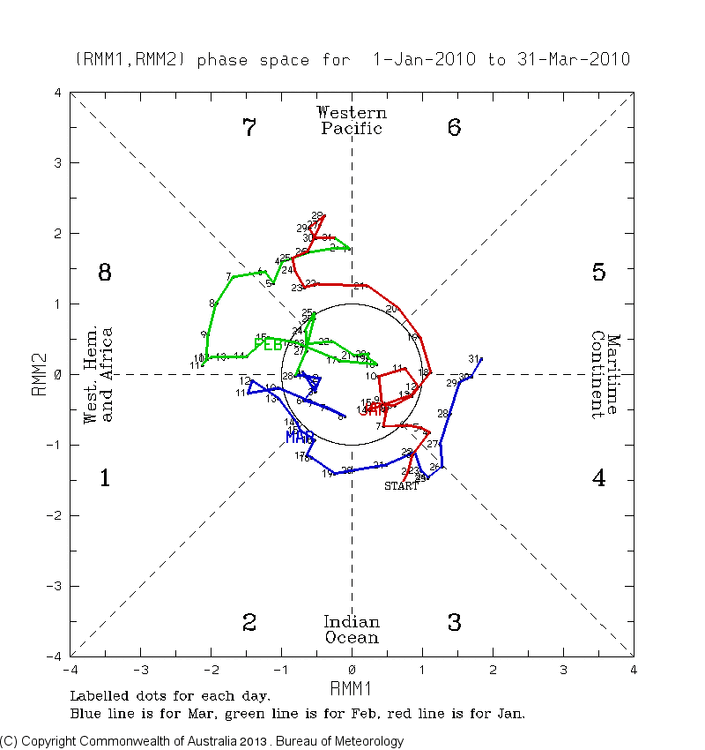
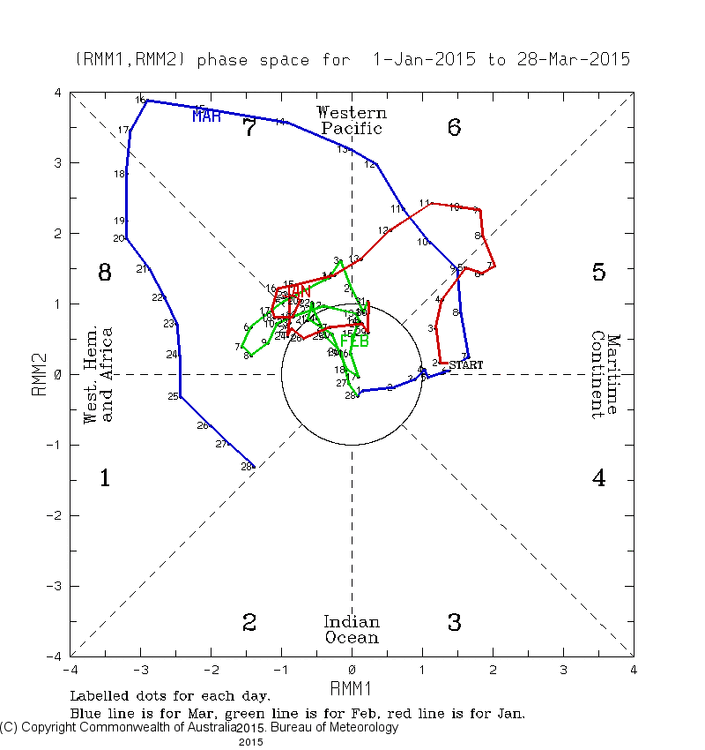
Weak 8-1-2 dominating during El Niño often favors a cold to very cold E US, especially SE US. As one who prefers cold, I would want a lot of weak 8-1-2 to keep cold chances the highest. Back in the 2010s, I analyzed the SE US going back to the 1970s and found that in general, weak left side of MJO diagram, including inside the COD, was coldest, while right side of diagram outside of COD, was warmest. Weak averaged colder than strong for all phases. This was often the case also for a good portion of the E US. Here are 15 MJO diagrams covering El Niño periods with weak MJO, (dominated by the left side in almost all cases) with inside the COD or just outside for (almost) all of the days, along with temp. anomalies for ATL and NYC: -Jan 1-Feb 2, 1977 (red/green): ATL -13, NYC -9 -Dec 21-30, 1977 (blue): ATL -9, NYC 0 -Jan 1-13, (red) and Feb 11-22 (green) 1978: ATL -7, NYC -4 -Feb 1-20 (green) and Mar 1-4 (blue), 1980: ATL -10, NYC -4 -Jan 12-Feb 13 (red/green) and Mar 9-31 (blue), 1983: ATL -5, NYC +1 Jan 1-16, 1988 (red): ATL -8, NYC -7 Jan 30-Feb 10, 1995 (red/green): ATL -6, NYC -4 Dec 1-15, 1997 (blue): ATL -6, NYC -2 Jan 11-27, 2003 (red): ATL -10, NYC -8 Dec 14-28, 2004 (blue): ATL -8, NYC -5 Feb 27-Mar 10, 2005 (green/blue): ATL -8, NYC -5 Jan 28-Feb 19, 2007 (red/green): ATL -8, NYC -9 Dec 1-21, 2009 (blue): ATL -5, NYC -3 Jan 1-14 (red) & Feb 14-Mar 22 (green/blue), 2010: ATL -9, NYC +1 Feb 12-28, 2015 (green): ATL -14, NYC -15 These 15 diagrams cover periods that were during 12 of the 16 (75%) El Niño winters between 1976-7 and 2018-9. The only 4 of these El Niño winters not covered by a diagram were 1986-7, 1991-2, 2015-6, and 2018-9. Other than Dec of 1986, those 4 didn’t have many weak left sided MJO days. So, for ATL, these 15 portions of El Niño winters with weak mainly left-sided MJO averaged a very cold 8 BN over 346 days. The 15 periods varied between -14 (MBN) and -5 (BN) with 11 MBN and 4 BN. So, for NYC, these 15 portions of El Niño winters with weak mainly left-sided MJO averaged a cold 4 BN over 346 days. The 15 periods varied between -15 (MBN) and +1 (N) with 5 MBN, 6BN, and 3N. So, with @snowman19 now suggesting weak 8-1-2 MJO likely to dominate much of the upcoming winter, I feel the chances for a cold E US winter and especially SE US are elevated vs if that weren’t the case. Now if we could get the cold Oct I’ve been hoping for since that’s a leading indicator!
-
How long do you expect weak MJO 8-1-2 to dominate? All of the way through winter or just through autumn?
-
To get a BN October, we’ll likely need a BN last week. As of now, that’s not being suggested by the longer term models. Hopefully that will change and there’s still plenty of time since that’s in week 3, easily far enough out for the models to be off. Fingers crossed as a BN Oct during El Niño is partially correlated to a BN winter.
-
The article linked below, which was written 8/9/22 suggests that the Hunga Tonga eruption caused major strat cooling in the S Hem in 2022. It also claimed some correlation between a cold S Hem strat in Jul-Sep and a -NAO the next NDJ, which would have been for 2022-3. But NDJ of 2022-3 was dominated by a +NAO. From the article: “If we look at the winter seasons following anomalously cold south stratospheric years, we can see a great example of a negative NAO pattern.” Comments? https://www.severe-weather.eu/global-weather/cold-anomaly-stratosphere-polar-vortex-volcanic-cooling-winter-influence-fa/
-
SN El Niño/-QBO RDU/ATL (excludes ZR): 51-2: 4.7”/3.9” 53-4: 7.1”/0.1” 58-9: 13.5”/2.4” 65-6: 11.8”/0.7” 68-9: 12.0”/2.2” 72-3: 11.3”/1.0” 76-7: 3.6”/1.0” 79-80: 18.3”/4.4” 86-7: 10.8”/4.8” 91-2: T/5.0” 09-10: 8.0”/5.3” 14-15: 7.9”/T AVG RDU Nino/-QBO: 9.1” vs 6.4” norm; so AN avg; median 9.4” AVG ATL Nino/-QBO: 2.6” vs 1.9” norm; so AN avg; median 2.3”
-
But he didn’t say E QBO favors opposite. Instead he implied (see his H5 map that backs this) still +PNA but with storms on avg going more quickly offshore vs more up coast with +QBO Nino. Both are +PNAs
-
NYC/Boston SN El Niño/-QBO 51-2: 19.7”/31.9” 53-4: 15.3”/23.6” 58-9: 13.0”/34.1” 65-6: 21.4”/44.1” 68-9: 31.2”/53.8” 72-3: 2.8”/10.3” 76-7: 24.5”/58.5” 79-80: 12.8”/12.5” 86-7: 23.1”/42.5” 91-2: 12.6”/22.0” 09-10: 51.4”/35.7” 14-15: 50.3”/110.6” AVG NYC Nino/-QBO: 23.2” vs 25.8” norm; so NN avg though median is less, 20.6” AVG Boston Nino/-QBO: 40.0” vs 43.7” norm; so NN avg though median is less, 34.9”
-
Nowhere in that preview of 09-10 did he say that a -QBO Nino favors a -PNA. Actually, his H5 map suggests +PNA is favored with the AN hts NW US and BN hts SE US. He did say less SN for Boston/NYC when -QBO vs +QBO because storms tend to go OTS too quickly with -QBO vs going more up the coast with +QBO. I’ll check the data and see.
-
We will have a -QBO in 2023-4. These Ninos had a -QBO/+PNA for DJF (and NDJFM) averaged out: 1976-7, 1979-80, 1986-7, 1991-2, 2009-10, and 2014-5: six cases While only these had -QBO/-PNA: 1951-2, 1965-6, 1968-9: 3 cases These had a -QBO/neutral PNA: 1953-4, 1958-9, 1972-3: 3 cases So, -QBO/+PNA has won out in -QBO Ninos by a 2:1 ratio over -QBO/-PNA. Chances during Nino/-QBO based on actual data since 1950: 50% +PNA, 25% neutral PNA, 25% -PNA QBO: https://psl.noaa.gov/data/correlation/qbo.data PNA: https://www.cpc.ncep.noaa.gov/products/precip/CWlink/pna/norm.pna.monthly.b5001.current.ascii.table
-
But these Ninos had a -QBO/+PNA for DJF (and NDJFM) averaged out: 1976-7, 1979-80, 1986-7, 1991-2, 2009-10, and 2014-5: six cases While only these had -QBO/-PNA: 1951-2, 1965-6, 1968-9: 3 cases So, -QBO/+PNA actually has won out in -QBO Ninos by a 2:1 ratio over -QBO/-PNA based on the actual data! To add, there were 3 cases of -QBO/neutral PNA. QBO: https://psl.noaa.gov/data/correlation/qbo.data PNA: https://www.cpc.ncep.noaa.gov/products/precip/CWlink/pna/norm.pna.monthly.b5001.current.ascii.table
-
And this is based on 1981-2010 base, which is cooler than 1991-2020. If there were to be a cold snap similar to this in late OCT, that would be enough to push a BN Oct chance to highly likely for much of the E US. The last Nino Oct that was BN in a good portion of the E US was 2009 fwiw. Other chilly E US Octs included 1987, 1977, 1976, 1965, and 1957.
-
Eyeballing this, it looks like ~2.11 for NDJ and ~2.15 for DJF vs last month’s 2.24/2.19 and August’s 2.4/2.35. So, another modest reduction in the peak though still super along with a slight delay in the peak timing to DJF instead of NDJ.
-
Thanks. This is a study that that article referred to: https://academiccommons.columbia.edu/doi/10.7916/d8-ga45-8y17/download In there, it refers to less warming than expected (<0.4C vs GW based expectations of 0.8C) in that “cold tongue” during 1958-2017. What I’d like to make sure of is that this isn’t just a straight subtraction of 2017 SSTs less 1958 SSTs. If it were, they’d be taking a year averaging an ONI of -0.2 (2017) and subtracting a year averaging an ONI of +0.8C (1958). So, the difference in the average ONI between 2017 and 1958 is -1.0C. So, if that were how it was calculated, then of course there’d be quite a cool tongue merely due to ENSO being warm in 1958 and cool in 2017. Any thoughts?
-
Thank you. As I said, I prefer BN temps in all seasons. That’s enough reason for me to root for this month as a whole to average BN in the SE. However, there’s the additional reason that I wrote about in the post you linked, an apparent partial correlation of a BN SE Oct and a BN SE subsequent winter during El Niño. So, whereas having a BN Oct doesn’t of course come close to guaranteeing a BN winter, it appears to mean an increased chance vs if Oct isn’t BN. The models are continuing to signal that the chance for a BN Oct is a very realistic and increasing possibility as of now. For example, the EPS and weeklies have had a cooling trend for week 2 over recent days. Here is the average for Octobers preceding some of the coldest SE US El Niño winters:
-
The Sep QBO came in about as expected (-13.58). https://www.cpc.ncep.noaa.gov/data/indices/qbo.u30.index
-
Are you able to post map(s) that show cooling of this EPAC tongue over the last 30 years? I’d like to see more detail to know what they’re referring to. Included in this, I’d like to see exactly what 30 year period they’re talking about.
-
With every case being different, how confident do you feel that 2023 tropical WPac SSTs will rebound as quickly as they did in 2019 and why? Though Nov of 2019 was cold, 2019-20 was a mild winter overall in the E US going all of the way through March though it was only warm neutral ENSO vs El Niño for 2023-4.
-
Yes, 180 to 260 degrees for 180-100W. Also, choose “seasonal average” if you’re looking at only a certain month or months as opposed to all of Jan-Dec. For analysis level, choose “monolevel variables” to do SSTs.
-
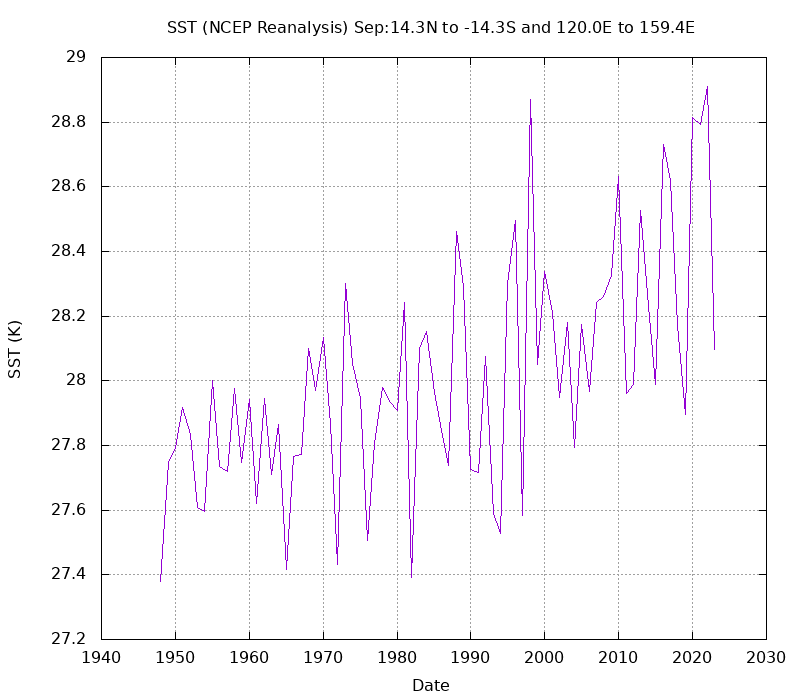
I’m talking specifically about the area of the tropical W Pacific W of Nino 4 and N of Australia from 120E to 160E, 15N to 15S. This is an area that meteorologist Brad Harvey has been focusing on for W Pacific forcing that had previously been at or near record highs for much of the last three years. He believes that the warmth of this area has likely been a major contributing factor toward recent years’ winter warmth in the E US/increased domination by the infamous “SE ridge” by focusing tropical convection N of Australia, thus leading to both a tendency for increased duration/amplitude of warmer winter MJO phases and tropical forcing from that area to dominate even when the MJO wasn’t officially in warm phases. Here is a link that calculates that tropical WPac area’s SSTs for Septembers back to 1948: https://psl.noaa.gov/cgi-bin/data/timeseries/timeseries.pl?ntype=1&var=SST&level=2000&lat1=15&lat2=-15&lon1=120&lon2=160&iseas=1&mon1=8&mon2=8&iarea=0&typeout=1&Submit=Create+Timeseries Below is the image of that area’s SSTs for Septembers going back to 1948. It shows the 0.7C to 0.8C cooling in 2023 vs 2020-2 along with the cooling that I assume was associated with the aforementioned fall 2019 IOD event. It isn’t quite as cool as the 2015 Nino Sept (0.108C warmer than Sept 2015) although it is 0.133C cooler than the 2014 Nino Sept and is 0.231C cooler than the 2009 Nino Sept:
-
It is from here: https://psl.noaa.gov/cgi-bin/data/timeseries/timeseries1.pl I was told about this site by a pro-met, who closely follows tropical WPac SST anomalies via this site. The following post has animation that also shows the tropical WPac cooling:
-
I don’t know if it is just for the short term or not, but a large portion of the tropical W Pac (15N to 15S, 120-160E) is actually significantly cooler than the last 3 years at this time (~0.7 to 0.8C cooler) while the central and E eq Pacific is much warmer as we know.
-
For some reason, OISST is stuck on Oct 3rd.
-
Regarding the continued cooling of WPac SST anomalies N of Australia (120-160E, 15N to 15S), I asked meteorologist Brad Harvey this: “Hey Brad, It looks like even further cooling of this WPac area you've been watching when looking at September of 2023 vs prior Septembers (cooler Sep 2023 anomaly vs anomaly for Aug 2023). When keeping in mind the much warmer Nino 4 just to its east in Sept vs prior Septembers, does this imply an increased chance for a colder E US winter vs recent winters?” This is his response: “For the WPac. Yes, appears to be cooling quite a bit. At face value, this could have a colder implication for the Eastern US in winter, as tropical convection is not over warm MJO phases around Indonesia but could be farther east near or to the east of the International Dateline which tends to be a colder position. That said, 2015-16 is a good example of a full basin strong El Nino with cooler waters in the west Pacific than we have now, and that was a record warm winter.”
-
Here’s something else I posted regarding relationship between Oct and winter during ENSO, this one addressing an apparent partial correlation regarding BN temperatures in Oct and in DJF in the SE: During El Niño in the SE, there’s evidence of a partial correlation between a BN Oct and a BN DJF. Check out these 9 KSAV BN (more than 2 BN) Nino Octobers for example: - 1876, 1885, 1930, 1957, 1958, 1976, 1977, 1987, 2006 Of these nine, seven (78%) of the subsequent winters were BN at KSAV: 1876-7, 1885-6, 1930-1, 1957-8, 1976-7, 1977-8, 1987-8 The other two (22%), 1958-9 and 2006-7, were NN None (0%) were AN. These 11 El Niño Octs were AN at KSAV -1884, 1911, 1918, 1919, 1939, 1941, 1951, 1969, 1986, 2002, 2018 Subsequent winters: 3 (27%) BN: 1939-40, 1969-70, 2002-3 6 (55%) NN: 1884-5, 1911-2, 1918-9, 1919-20, 1941-2, 1986-7 2 (18%) AN: 1951-2, 2018-9 So after BN Octs El Niño winters were 78% BN, 22% NN, and 0% AN. Thus, BN El Niño winters have been favored after BN Octobers. So after AN Octs El Niño winters were 27% BN, 55% NN, and 18% AN. Thus, NN El Niño winters have been favored over each of the other categories after AN Octobers. All 7 El Nino Octobers colder than 65F were followed by BN winters.


