jconsor
-
Posts
1,016 -
Joined
-
Last visited
Content Type
Profiles
Blogs
Forums
American Weather
Media Demo
Store
Gallery
Everything posted by jconsor
-
Regarding the long-range pattern (Jan 9-15 or so), looks like a classic phase 8 MJO composite across N. America but closer to a phase 1 composite across Euro-Atlantic sector.
-
-
This event in Nov last year was a squall line with embedded microbursts (no confirmed tornadoes), but reflects the same pattern you mentioned: https://www.ny1.com/nyc/all-boroughs/weather/2020/11/20/a-history-of-late-season-tornadoes-in-new-york-city https://www.weather.gov/phi/EventReview20201115 Another one from late Oct 2019 with very widespread reports of severe wind gusts in the mid-Atlantic/NE along a squall line, along with several tornadoes: https://www.washingtonpost.com/weather/2019/11/01/halloween-storms-packed-punch-across-region/
-
Interesting regarding the Long Island tornadoes yesterday (note the tweet incorrectly says CT instead of NY). The analogs and Enhanced Fujita scale probabilities are based on the radar signature. Note that only six of the 34 tornadoes observed on LI between 1950 and 2020 were F2, with no F3 ever observed. Before yesterday, there has never been a Nov tornado observed on LI dating back to 1950: See the following for historical tornado data/trends: https://bronx.news12.com/are-tornadoes-becoming-more-common-on-long-island-41004515 https://www.ncdc.noaa.gov/stormevents/listevents.jsp?eventType=(C)+Tornado&beginDate_mm=01&beginDate_dd=01&beginDate_yyyy=1950&endDate_mm=12&endDate_dd=31&endDate_yyyy=2020&county=NASSAU%3A59&county=SUFFOLK%3A103&hailfilter=0.00&tornfilter=0&windfilter=000&sort=DT&submitbutton=Search&statefips=36%2CNEW+YORK
-
Several reports of a possible tornado in coastal central and eastern CT as well:
-
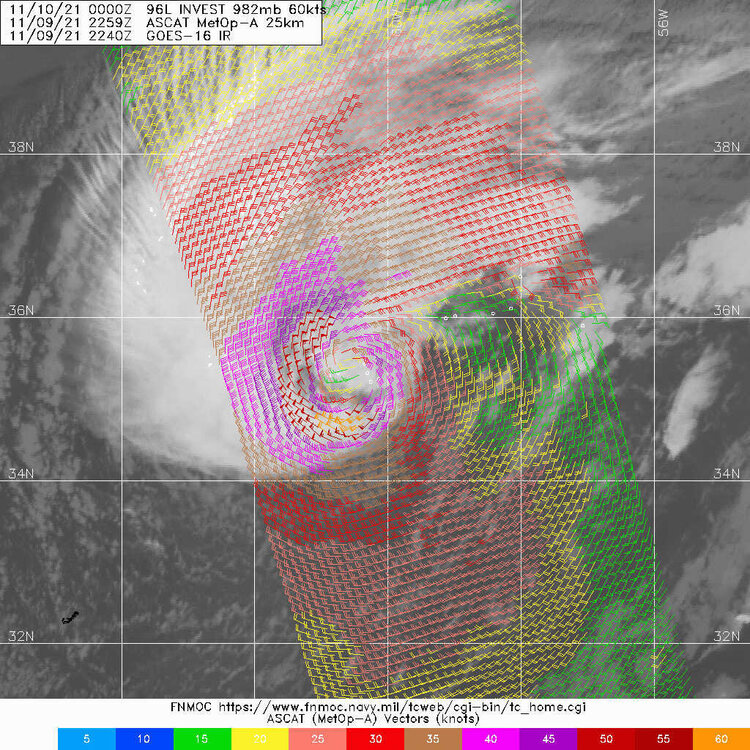
In my view, 96L likely has been subtropical/borderline tropical for around 24 hours. 000 TXNT27 KNES 100038 TCSNTL A. TROPICAL DISTURBANCE B. 09/2330Z C. 35.3N D. 61.0W E. THREE/GOES-E F. T2.5/2.5 G. IR/EIR/SWIR H. REMARKS...5.5/10 BANDING AROUND THE LLCC YIELDS A DT OF 2.5. NO MET AND PT AS THE SYSTEM HAS TRANSITIONED FROM ST TO TROPICAL WITH NO CLASSIFICATION 24 HOURS AGO. FT IS BASED ON DT. I. ADDL POSITIONS NIL ...TUGGLE
-
-
Some context on how rare it would be if Wanda lasts as a tropical cyclone until Sun or Mon:
-
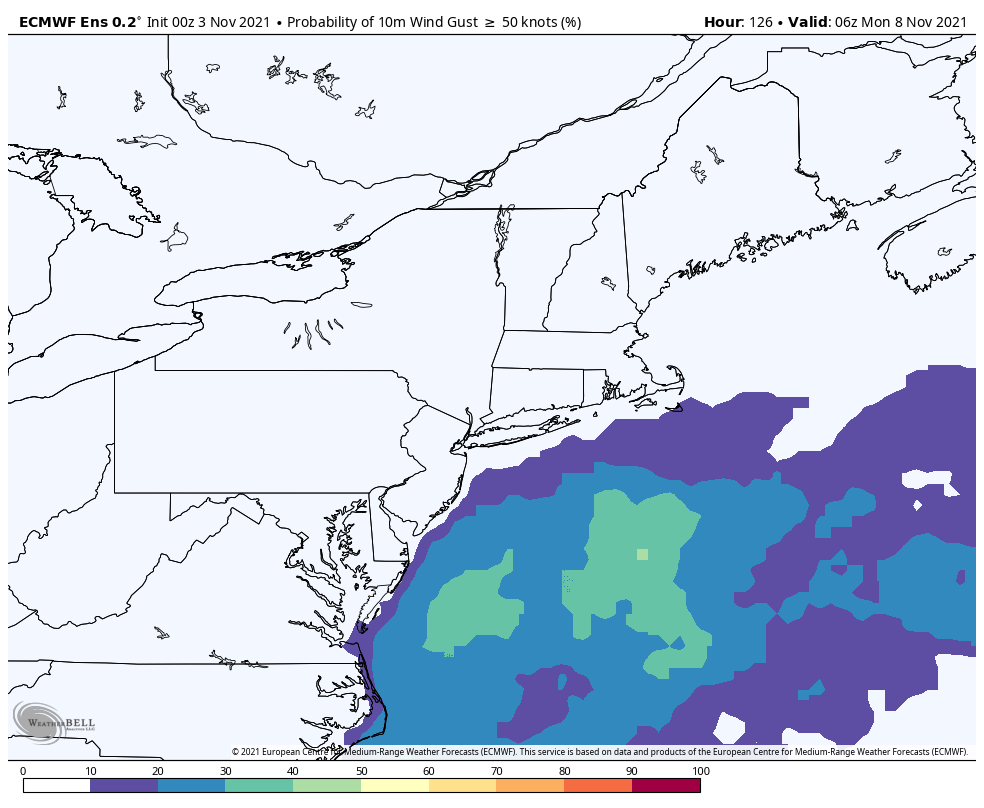
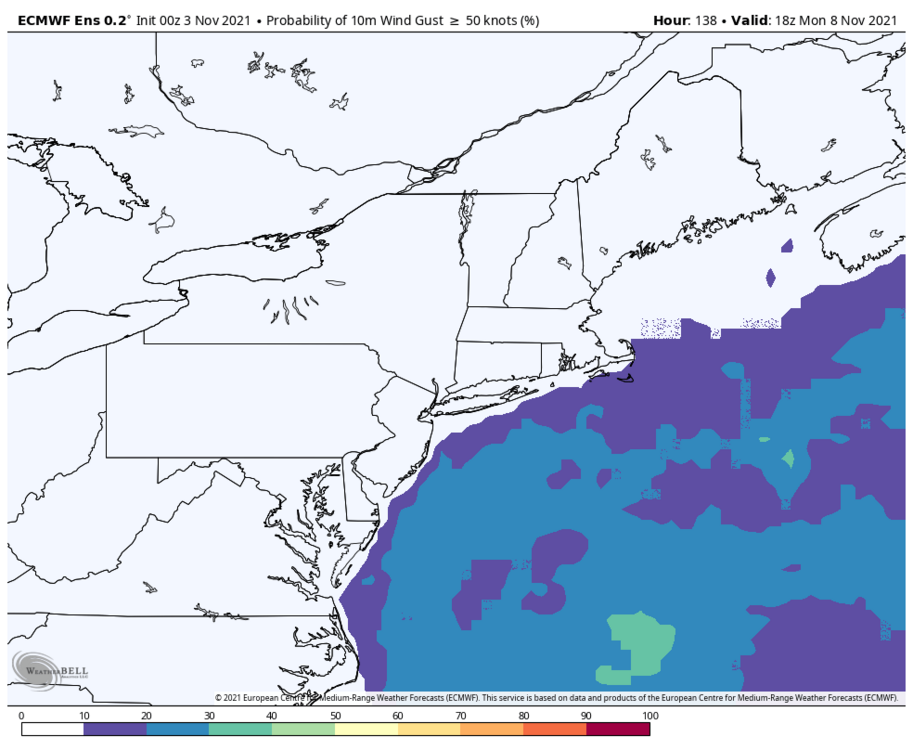
I agree that the ECMWF is likely too amped and it will be tough to get significant precipitation as far west as the immediate NYC metro... however would not dismiss a high wind threat for E LI with ensembles trending toward more consolidated system with better phasing. Also, closely watching coastal flood threat for NJ shore and LI (astro. high tides peak 11/5-7 due to perigee as well as new moon). Of course, the larger risks for those threats are along the SE coast from N. FL to NC Outer Banks and in SE New England.

-
2021 Atlantic Hurricane season
jconsor replied to StormchaserChuck!'s topic in Tropical Headquarters
Wanda has been quite a resilient, long-lasting system for so late in the year in the subtropics. Has a chance to strengthen into a strong TS or lower-end hurricane Sun-Mon if it gets pulled north by a strong trough and thus moves parallel to shear vector, as shown by several recent GFS and HWRF runs. -
2021 Atlantic Hurricane season
jconsor replied to StormchaserChuck!'s topic in Tropical Headquarters
The Mediterranean subtropical cyclone, named Apollo, was one of the longest lasting ones I can recall - almost 10 days. It also developed tropical characteristics for a time while it was close to Sicily and Malta: -
I think we will get at least one tropical-moisture influenced storm and/or hybrid in the northeast US between Nov 4 and 12. Signal on ensembles is moderate but growing for something subtropical/hybrid to form in the GOM or off SE Coast and move up the east coast between Nov 8 and 12. Also a signal for late-forming secondary low tracking from VA Capes to NE US to late on Nov 4 to Nov 6 with perhaps cold enough air for some snow in the interior.
-
2021 Atlantic Hurricane season
jconsor replied to StormchaserChuck!'s topic in Tropical Headquarters
Thread on #94L which is gaining convection and will likely be named soon as a subtropical storm. It could briefly complete transition to tropical in the next day or two, before shear increases. Wouldn't rule out the possibility it becomes a strong STS or hurricane by mid next week as shear decreases again, but first it has to weather the rapid ramp-up in shear over the weekend. -
2021 Atlantic Hurricane season
jconsor replied to StormchaserChuck!'s topic in Tropical Headquarters
Outside chance for a brief tropical depression or low-end TS in the eastern Atlantic this weekend into early next week. Would likely be unprecedented per climo so late east of 40W (I couldn't find any TS+ in NHC best track back to late 1800s, but it doesn't include TDs). The fact that we even have a *potential* system to discuss in the eastern MDR so late is nothing short of remarkable. Likely the lingering Atlantic Nino is playing a role, with ITCZ tugged south of usual, allowing waves to stay over more favorable SSTs/upper level winds than is typical for this time of year. -
OBS and nowcast 9PM tonight-8A Wednesday for a general 2-5" rain, isolated 8" possible. 40-60 kt damaging wind likely Tuesday-early Wednesday. Focus for damaging wind and heaviest rain is the I95 corridor to the coasts. Power outages esp CT LI.
jconsor replied to wdrag's topic in New York City Metro
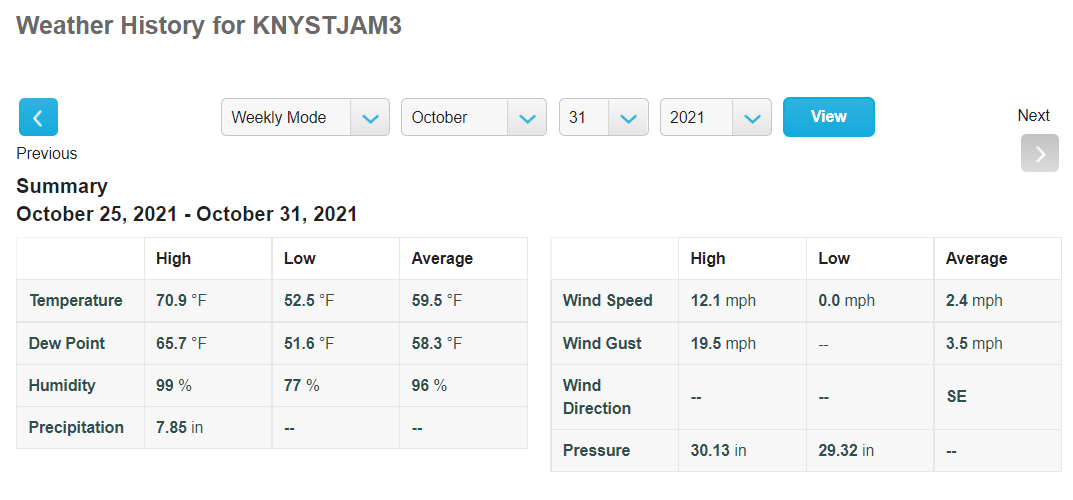
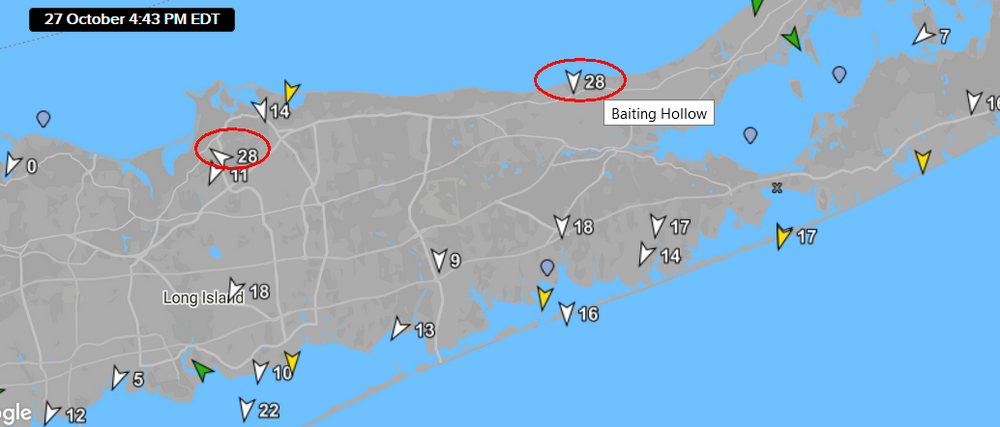
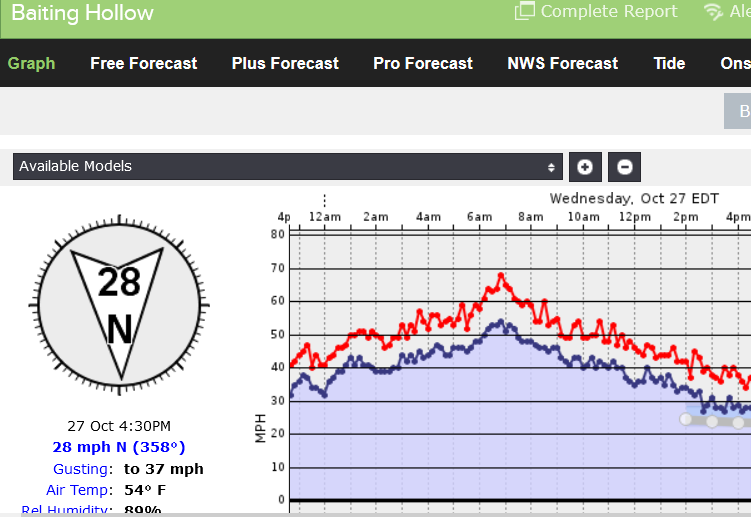
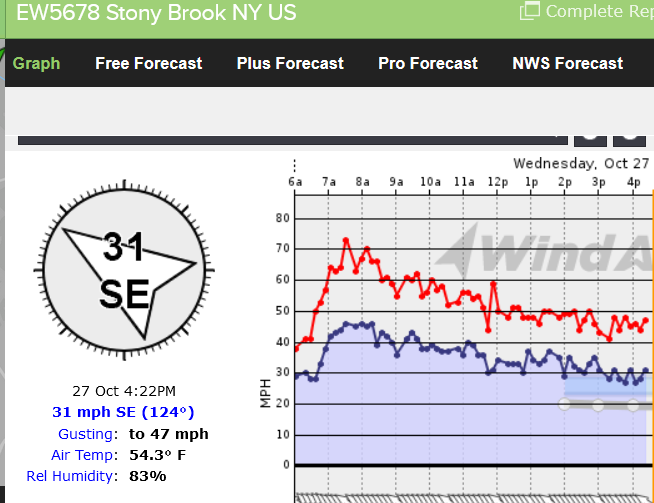
FYI I do not consider the 60-70 mph gusts reported at Baiting Hollow and Stony Brook out in central Suffolk County, LI to be representative. The Stony Brook site anemometer is ~70 feet above ground. I believe Baiting Hollow is on a ~75 foot bluff right on LI Sound. In my experience, both stations tend to run >25% higher than any nearby stations in past events. Compare current sustained winds at both sites to surrounding sites - generally 2x the land stations, even those right along the coast.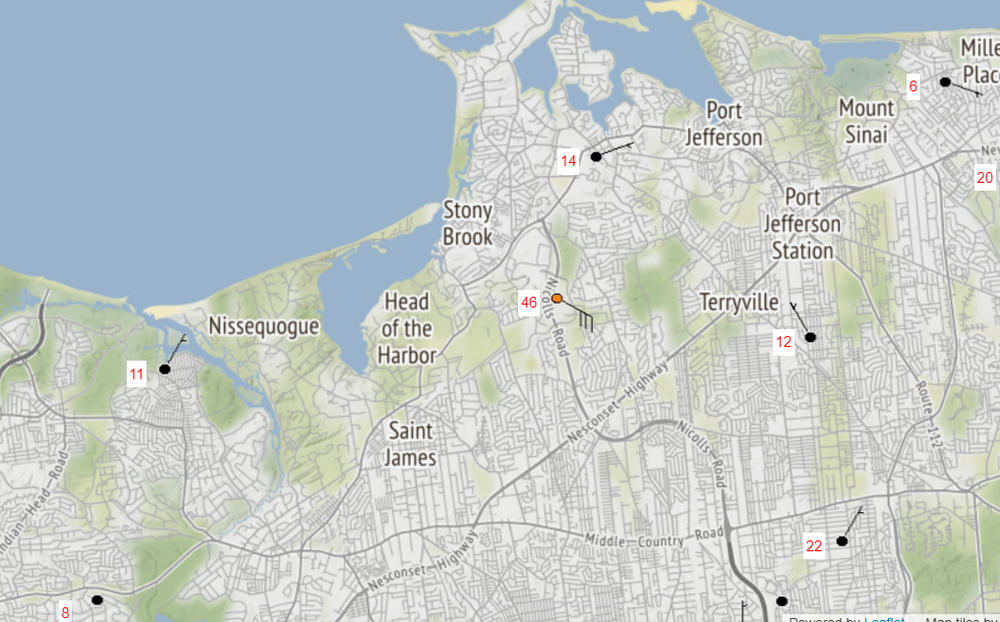
- 228 replies
-
- 1
-

-
- heavy rain
- flash flooding
- (and 2 more)
-
2021 Atlantic Hurricane season
jconsor replied to StormchaserChuck!'s topic in Tropical Headquarters
In addition to the potential subtropical system evolving as the E coast storm shifts eastward into the central Atlantic, we have a tightly-wound low south of Italy that has subtropical characteristics. It already has produced devastating flooding in Sicily yesterday. Facing lots of shear now, but that should weaken Thu into this weekend when this system has a decent chance of becoming fully tropical. These "Medicane" systems appear to becoming more common vs. the 1970s to early 1990s, especially the more intense ones that produce hurricane force winds. Medicane Ianos in Sep 2019 dropped to 984 mb and reached peak intensity 100 mph (!) sustained winds in the coastal waters near sw Greece just before making landfall, according to a recent paper: https://journals.ametsoc.org/view/journals/bams/aop/BAMS-D-20-0274.1/BAMS-D-20-0274.1.xml?tab_body=fulltext-display. Another weaker one in early in Oct 2019 tracked unusually far east through the Mediterranean and reached Israel and Egypt with gusty winds and heavy rainfall. -
OBS and nowcast 9PM tonight-8A Wednesday for a general 2-5" rain, isolated 8" possible. 40-60 kt damaging wind likely Tuesday-early Wednesday. Focus for damaging wind and heaviest rain is the I95 corridor to the coasts. Power outages esp CT LI.
jconsor replied to wdrag's topic in New York City Metro
Some chase videos of the hybrid nor'easter:- 228 replies
-
- 2
-

-
- heavy rain
- flash flooding
- (and 2 more)
-
OBS and nowcast 9PM tonight-8A Wednesday for a general 2-5" rain, isolated 8" possible. 40-60 kt damaging wind likely Tuesday-early Wednesday. Focus for damaging wind and heaviest rain is the I95 corridor to the coasts. Power outages esp CT LI.
jconsor replied to wdrag's topic in New York City Metro
As @bluewave mentioned, the subtropical nature of this system meant that the strongest winds were tightly concentrated close to the center. That factor, along with this system looping quite close to se New England, helped to generate gusts across SE New England that exceeded two similarly looping storms that were a little further offshore - Blizzard of Feb 1978 and the Perfect Storm of 1991. Meanwhile, the same small radius of max winds ensured that gusts across LI, NYC and coastal CT were less than what one would typically see with a wintertime system of this intensity tracking just inside the 40/70 benchmark.- 228 replies
-
- 1
-
-
- heavy rain
- flash flooding
- (and 2 more)
-
Yes, MAREPAM is a great site to track wind impacts during se New England coastal storms. It's a mesonet with stations sited in the typically windiest/most exposed coastal locations:https://marepam.org/
-
OBS and nowcast 9PM tonight-8A Wednesday for a general 2-5" rain, isolated 8" possible. 40-60 kt damaging wind likely Tuesday-early Wednesday. Focus for damaging wind and heaviest rain is the I95 corridor to the coasts. Power outages esp CT LI.
jconsor replied to wdrag's topic in New York City Metro
Great site for monitoring wind impacts for coastal storms in SE New England including Block Island - a mesonet with stations sited in the typically windiest/most exposed coastal locations: https://marepam.org/- 228 replies
-
- 1
-
-
- heavy rain
- flash flooding
- (and 2 more)
-
OBS and nowcast 9PM tonight-8A Wednesday for a general 2-5" rain, isolated 8" possible. 40-60 kt damaging wind likely Tuesday-early Wednesday. Focus for damaging wind and heaviest rain is the I95 corridor to the coasts. Power outages esp CT LI.
jconsor replied to wdrag's topic in New York City Metro
An update on the very impressive winds in SE New England. These wind reports are comparable to some seen on the Cape in the Dec 24-25, 1995 nor'easter, with the 80+ mph reports also more widespread than the Oct 29-30, 2017 "Bomb Cyclone" (the storm that may have made that term viral haha).- 228 replies
-
- 3
-
-
- heavy rain
- flash flooding
- (and 2 more)
-
These wind reports are comparable to some seen on the Cape in the Dec 24-25, 1995 nor'easter, with the 80+ mph reports also more widespread than the Oct 29-30, 2017 "Bomb Cyclone" (the storm that may have made that term viral haha).
-
OBS and nowcast 9PM tonight-8A Wednesday for a general 2-5" rain, isolated 8" possible. 40-60 kt damaging wind likely Tuesday-early Wednesday. Focus for damaging wind and heaviest rain is the I95 corridor to the coasts. Power outages esp CT LI.
jconsor replied to wdrag's topic in New York City Metro
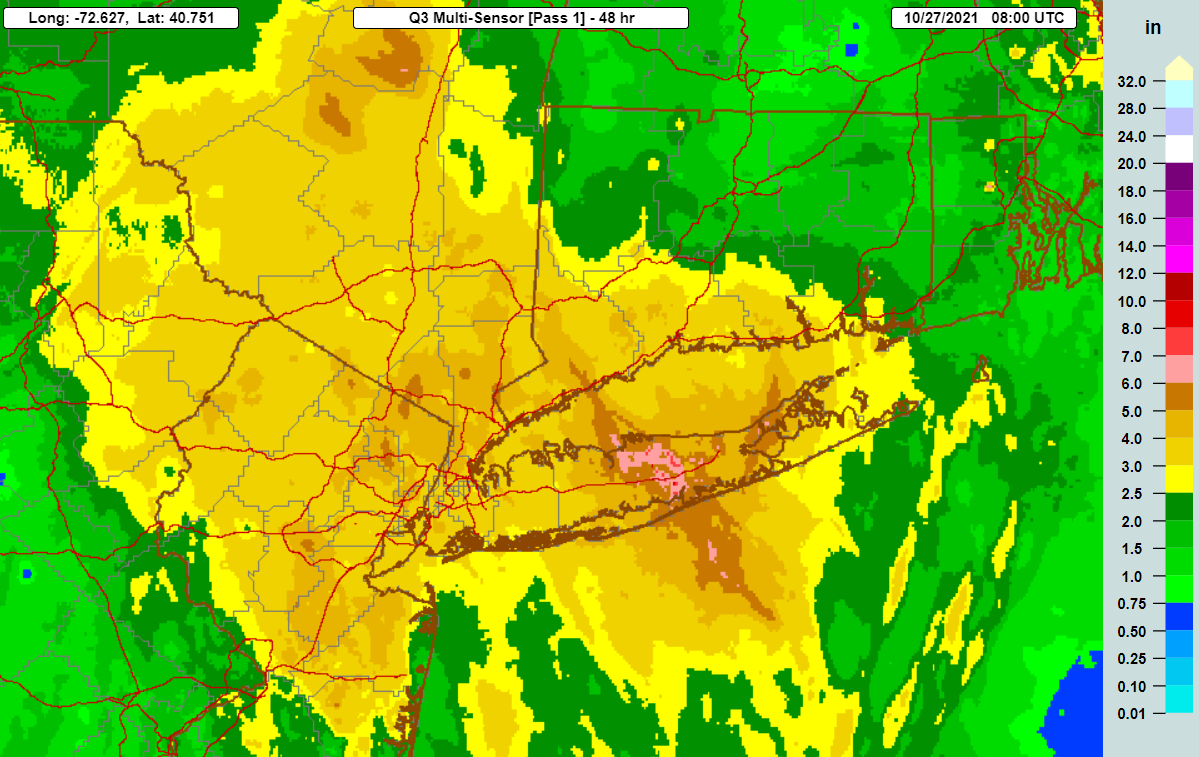
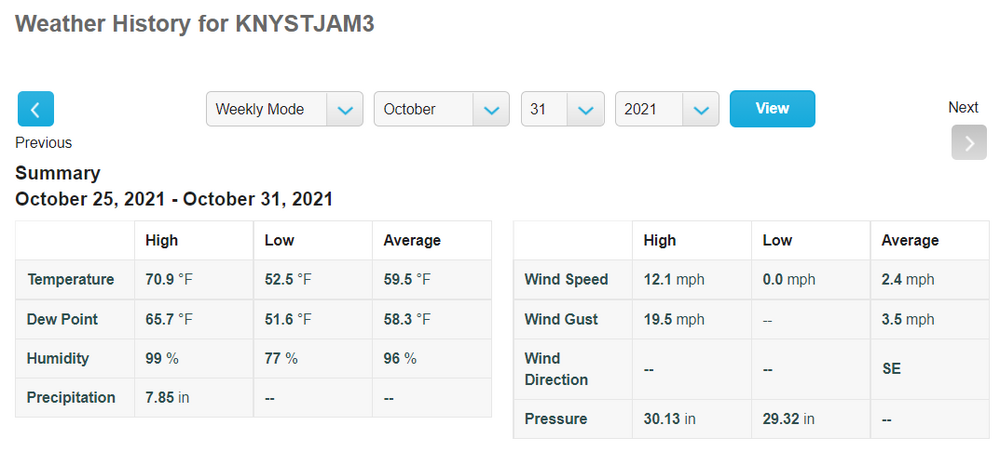
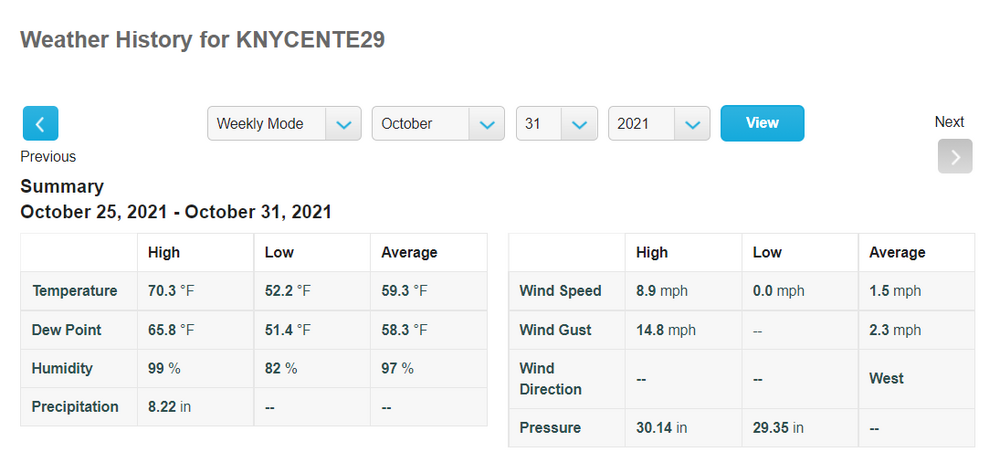
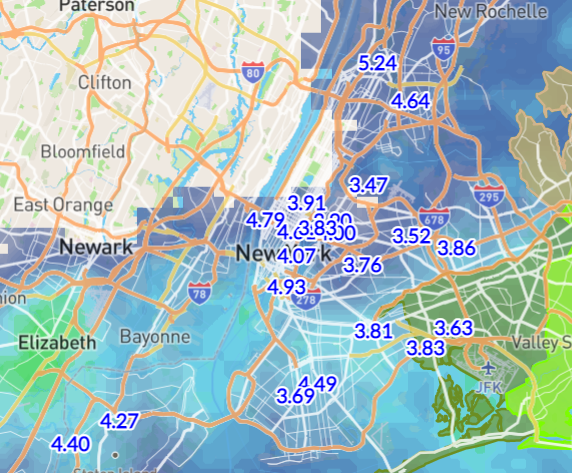
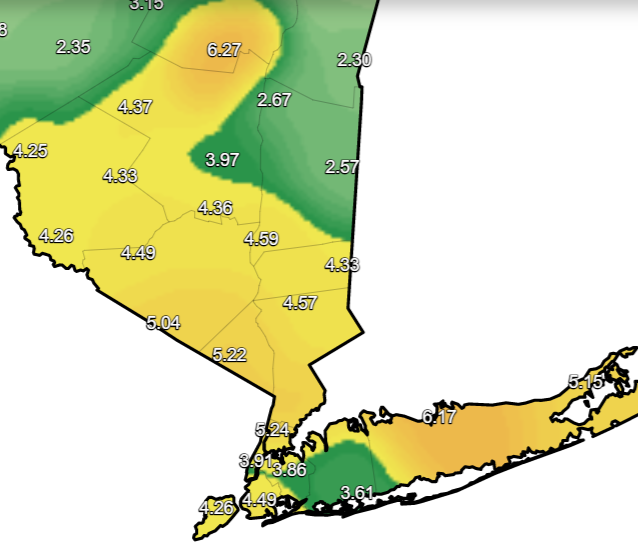
Here are 48 hour precipitation totals. Widespread 4"+ totals across SE NY. Heaviest amounts in NYC were in lower Manhattan and the Bronx with 4.75-5.5". Looks like the multisensor precip. estimate (which combines radar with sfc. obs) is underestimating precip. by ~15-20% based on mesonet obs. Numerous Weather Underground stations confirm what is shown on the multisensor precip. estimate - highest amounts were in the ne three-quarters of Suffolk County with widespread 5"+, locally 7-8.5" in the area around Stony Brook, Setauket, Centereach and St. James. A small area of SW CT near Westport and Fairfield also saw 6-7" totals, but these were quite localized and mainly near immediate shore. Very impressive mesoscale banding out there! Will be interested to see CoCoRAHS totals later. Thank G-d these rains fell on dry soil and rainfall rates were generally 1" per hour or less in the areas where heaviest totals fell... thus avoiding significant flooding in LI, S. CT and NYC. N/C. NJ and scattered areas in the lower Hudson Valley were a different story.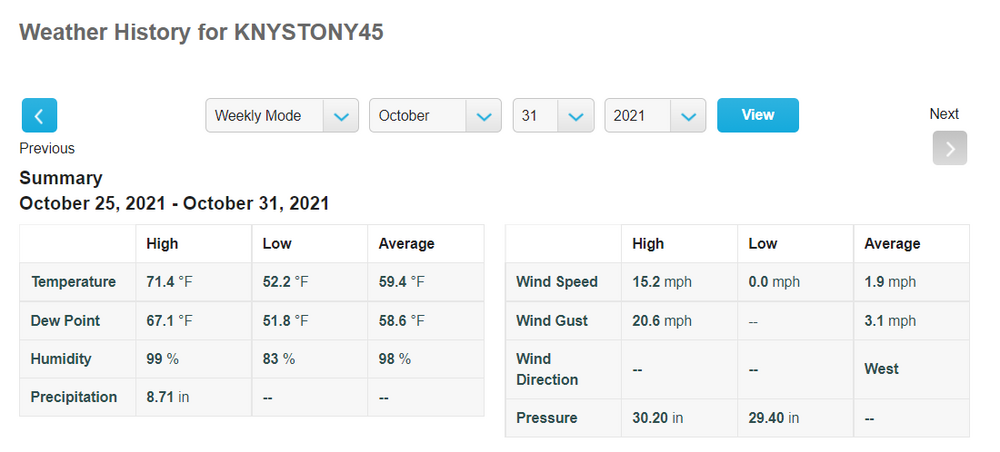

- 228 replies
-
- 3
-
-
- heavy rain
- flash flooding
- (and 2 more)