jconsor
-
Posts
940 -
Joined
-
Last visited
About jconsor

-
Early indications from seasonal models favor an active Atlantic hurricane season, perhaps even hyperactive. https://x.com/yconsor/status/1901982720378425715
-
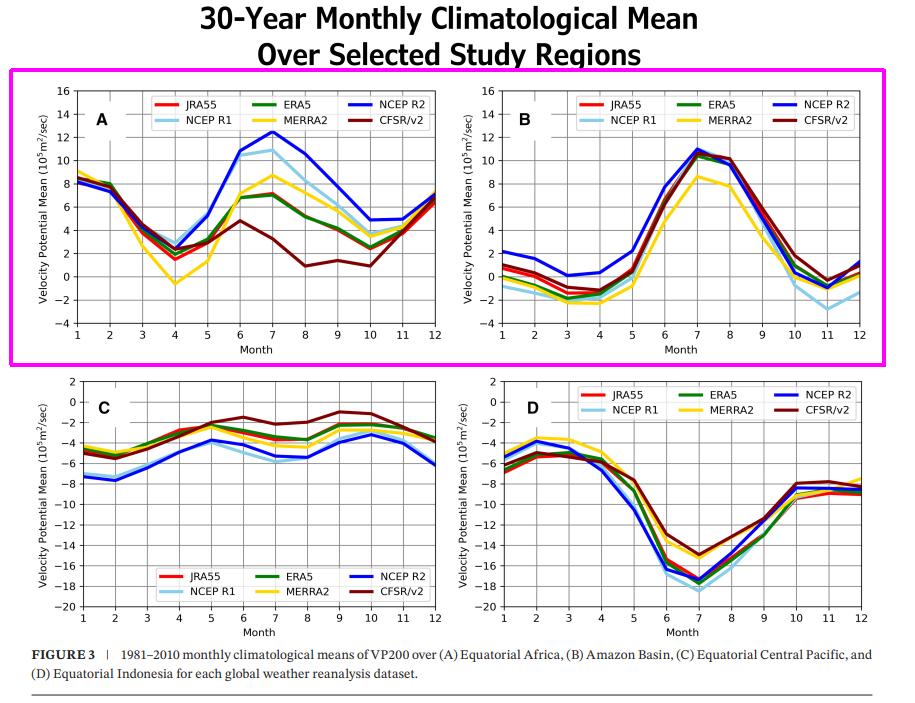
While I agree that extratropical (non-MJO) forcing played a significant role in the cold Jan 2025 outcome across the eastern/central US, we need to be careful using VP averaged across an entire month. Subseasonal variability clearly played a role here. In addition, the NCEP reanalysis has some notable biases in VP - it tends to show overly positive VP anomalies near C/S. America and Africa. See Stanfield et. al 2024, A Climatological Analysis of Upper-Level Velocity Potential Using Global Weather Reanalysis, 1959–2020: https://rmets.onlinelibrary.wiley.com/doi/full/10.1002/joc.8659 The vast majority of the cold anomalies in the eastern/central US occurred in the first two-thirds of Jan. From around Jan 23 onward it turned warmer than normal. The Jan 1-10 and Jan 11-20 VP anomalies show -VP anomalies migrating from the central/eastern Pacific and W. Atlantic, to the e. Atlantic and w. Africa. The magnitude is not as high as the negative anomalies that developed from the eastern IO to Maritime Continent in the Jan 21-31 period. However, especially in the Jan 11-20 period I would argue the MJO had a significant role, given the coherent wave of -VP (and corresponding +VP across the c/e. Pacific) that developed.
-
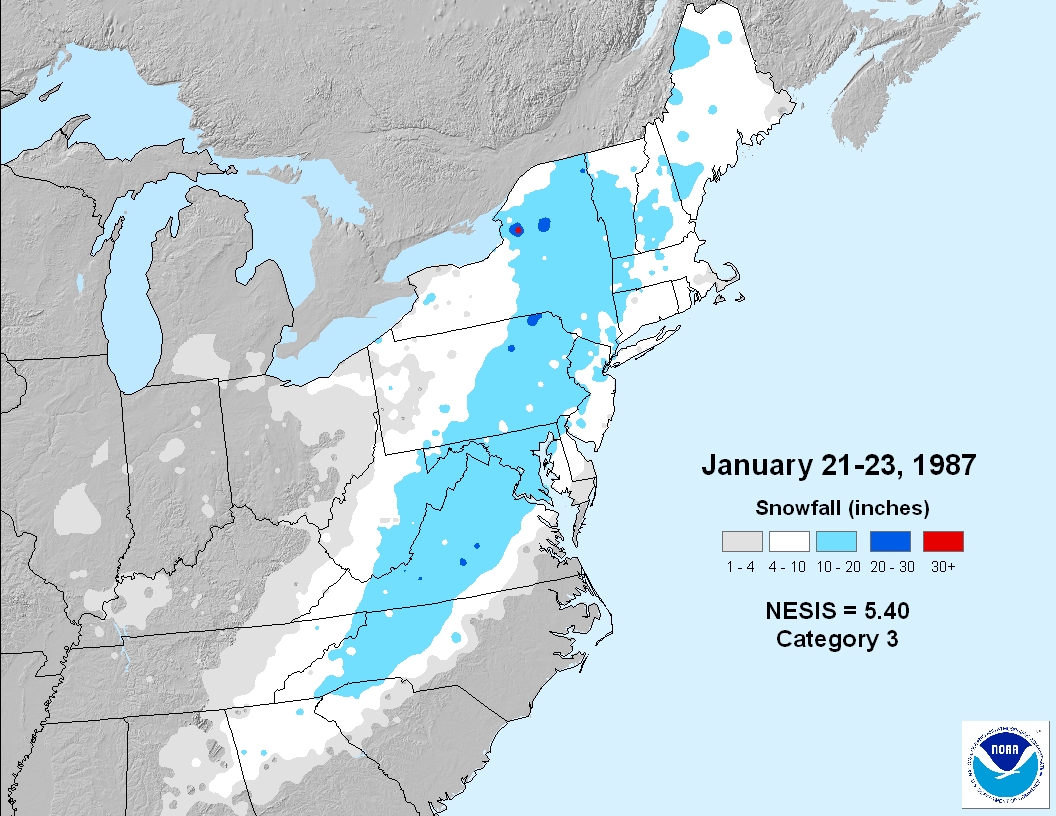
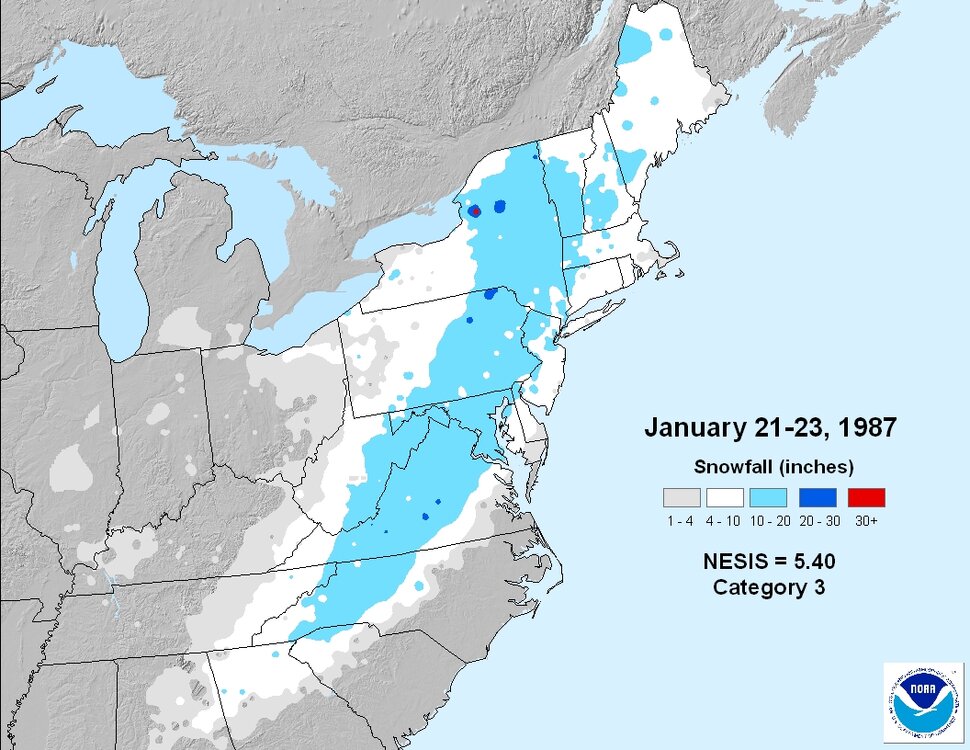
The Jan 22, 1987 snowstorm you are referring to is one of the main events that got me interested in weather. I grew up on the North Shore of LI (Roslyn) and I recall the forecast being for an inch or two, then quickly changing to rain. Instead snow piled up at 1-2" per hour and there was never a change to plain rain, just a little freezing drizzle at the end. As Ed said, it was traffic chaos. I was in second grade at the time and we were stuck at school for about 6 hours! The plows couldn't keep up with the snow and the hills on the roads in/around Roslyn made things even worse.
-
Some additional context to the unusual nature of this cold outbreak stratosphere-troposphere wise: https://bsky.app/profile/drahbutler.bsky.social/post/3lekmlyusmc25
-
Indeed, as we get closer in the guidance is correcting to a stronger high pressure and CAD wedge for the last week of Dec. https://x.com/yconsor/status/1870772344031268877
-
https://x.com/yconsor/status/1869457576339136768
-
https://x.com/yconsor/status/1869457576339136768
-
MJO phases 5 and 6 are far from a guarantee of warmth in the eastern US. https://x.com/commoditywx/status/1866191470287286392 https://x.com/bamwxcom/status/1866093279948763384
-
Per Eric Webb, the PDO has limited influence and limited usefulness for subseasonal predictability (especially in a winter like this with a strong Indo-W Pacific warm pool). https://x.com/webberweather/status/1864088518886322455 https://x.com/webberweather/status/1864091992386605400 https://x.com/webberweather/status/1864095069449699705 https://x.com/webberweather/status/1864150597710369022 Also interesting comments on PDO's limited usefulness as a teleconnection here: https://x.com/_WxPhil_/status/1864148237403263157
-
2024 Atlantic Hurricane Season
jconsor replied to Stormchaserchuck1's topic in Tropical Headquarters
https://x.com/yconsor/status/1850618329804730523 -
Some short-term drought relief possible this weekend: https://x.com/yconsor/status/1848326240068837640
-
Thread on important short-term northward/stronger trends noted regarding Beryl, and how this influences her potential TX/MX impacts: https://x.com/yconsor/status/1808853711629746332
-
@bluewave Nice model bias charts! Can you please provide the link for them? Thanks.
-
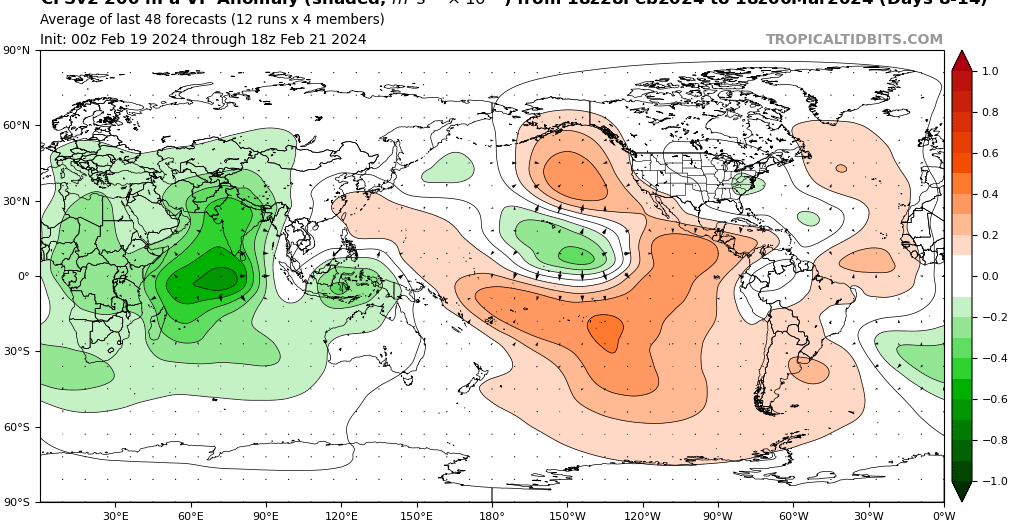
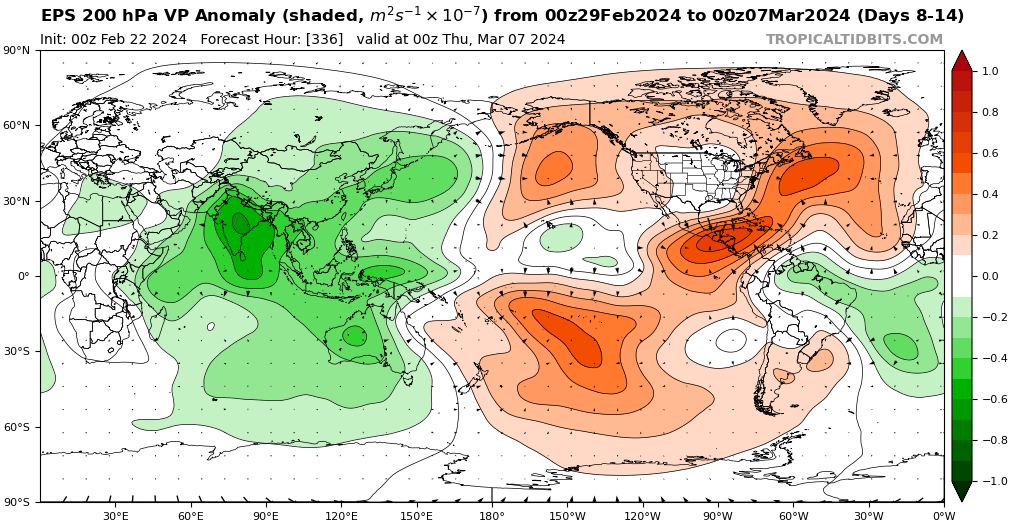
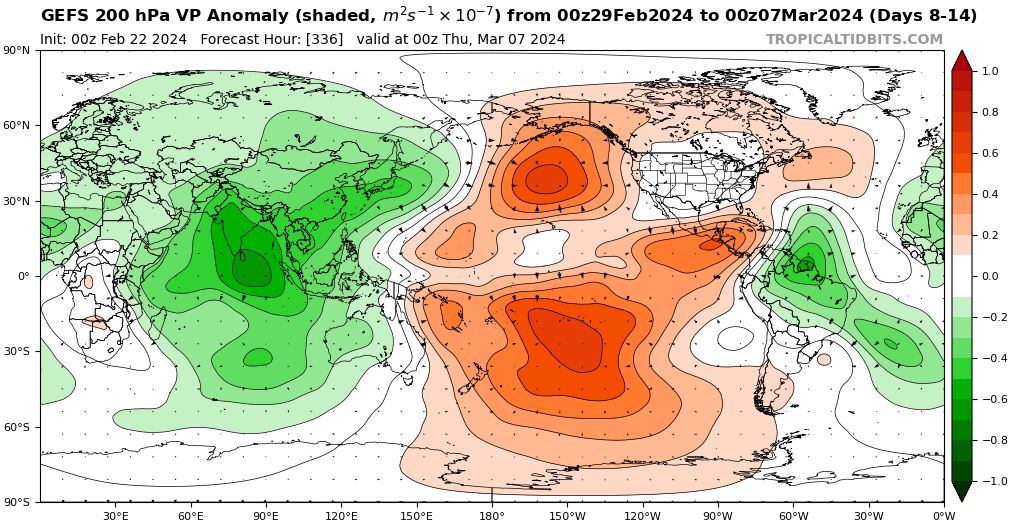
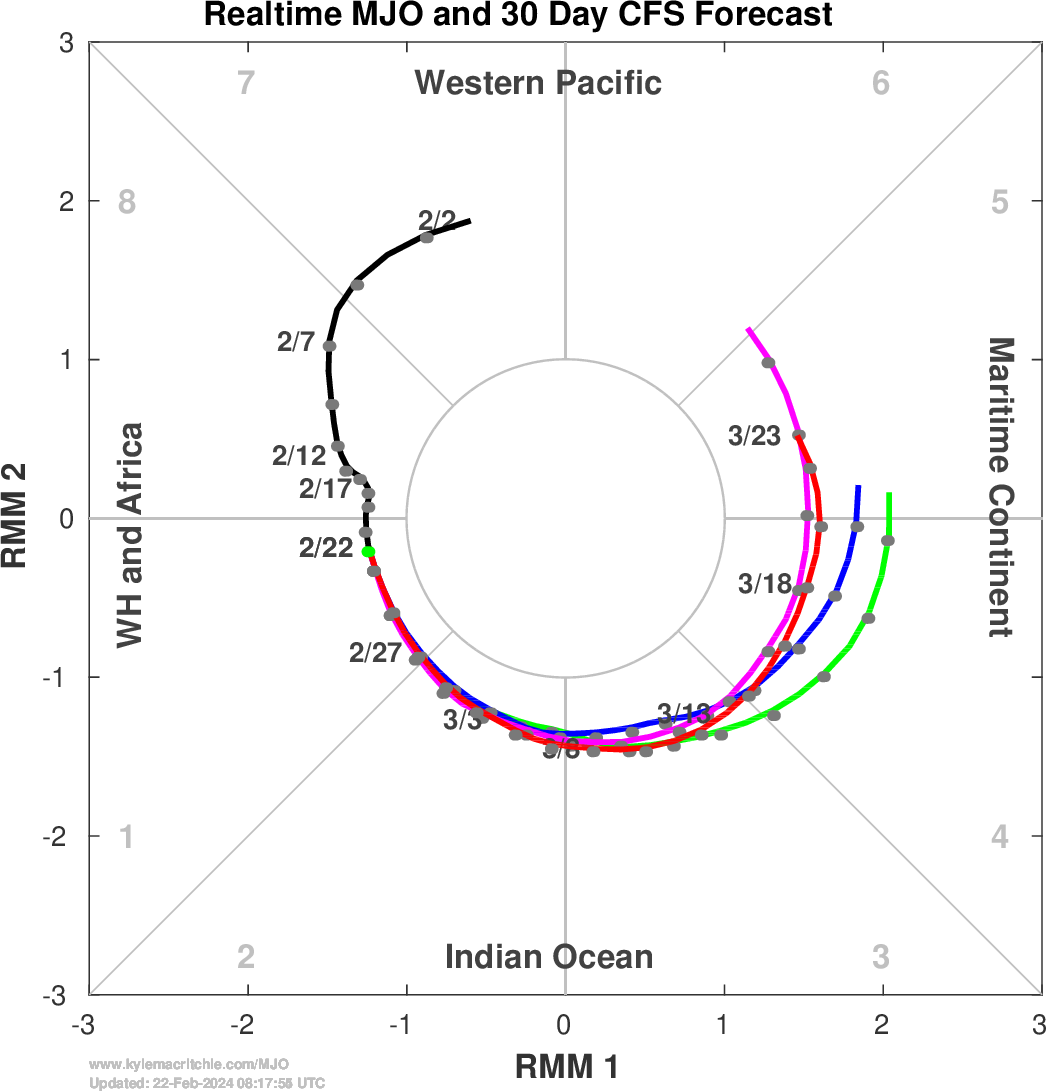
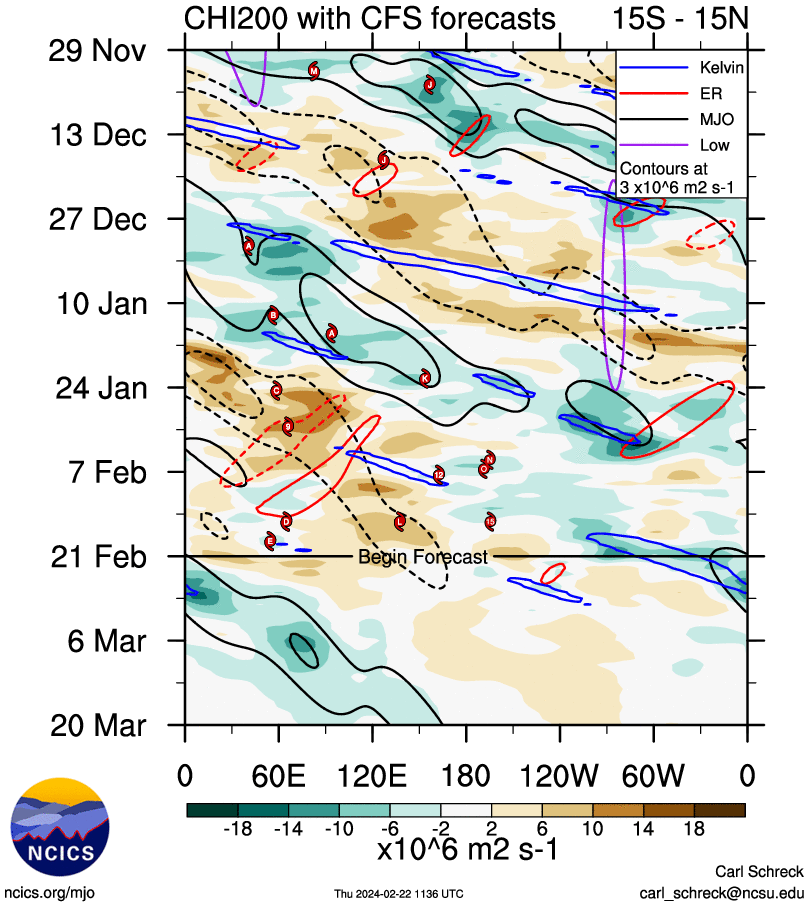
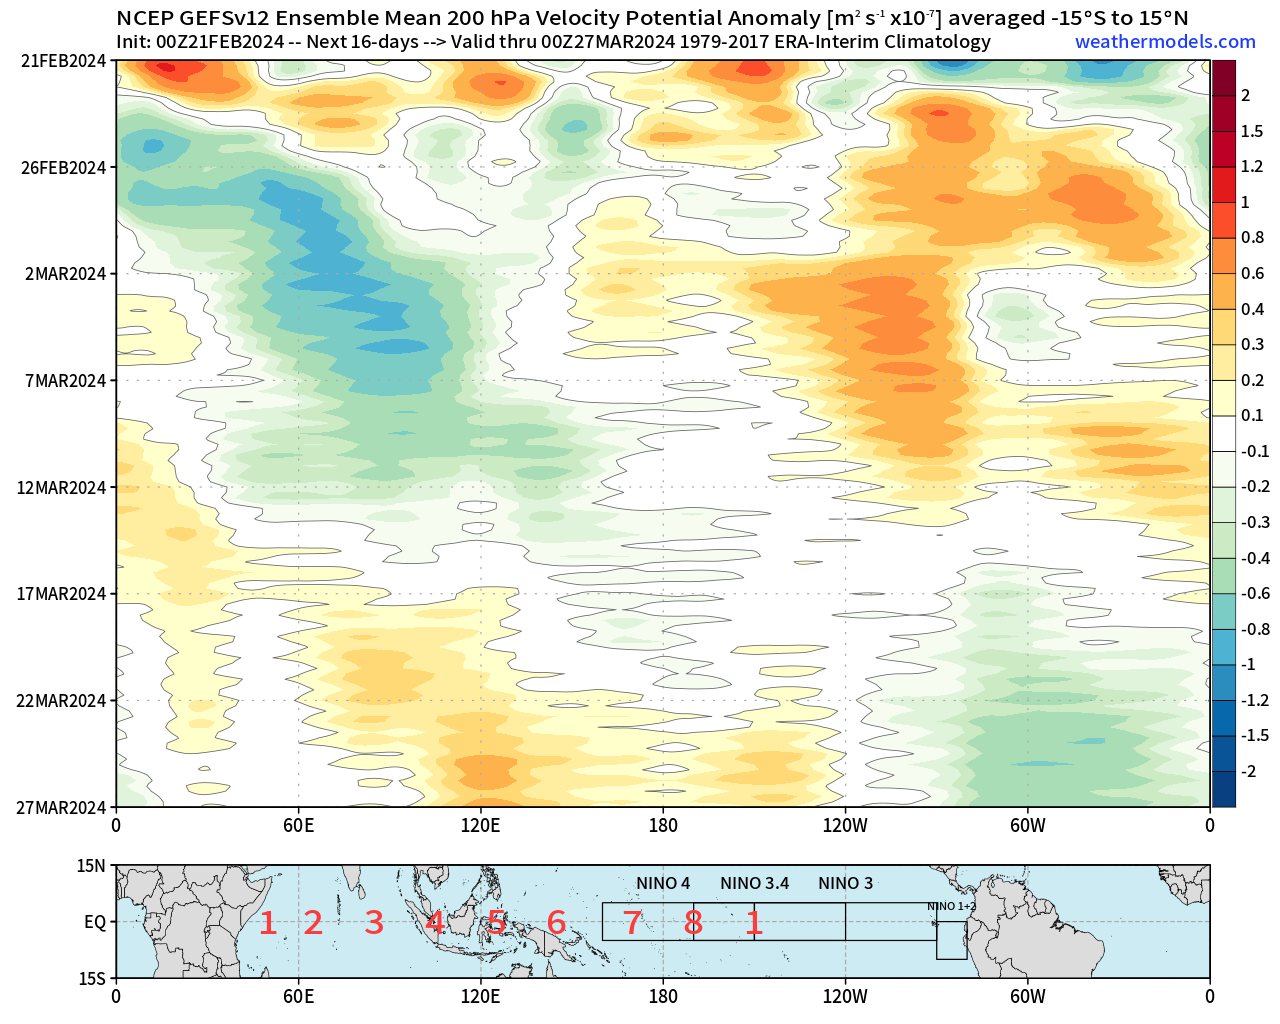
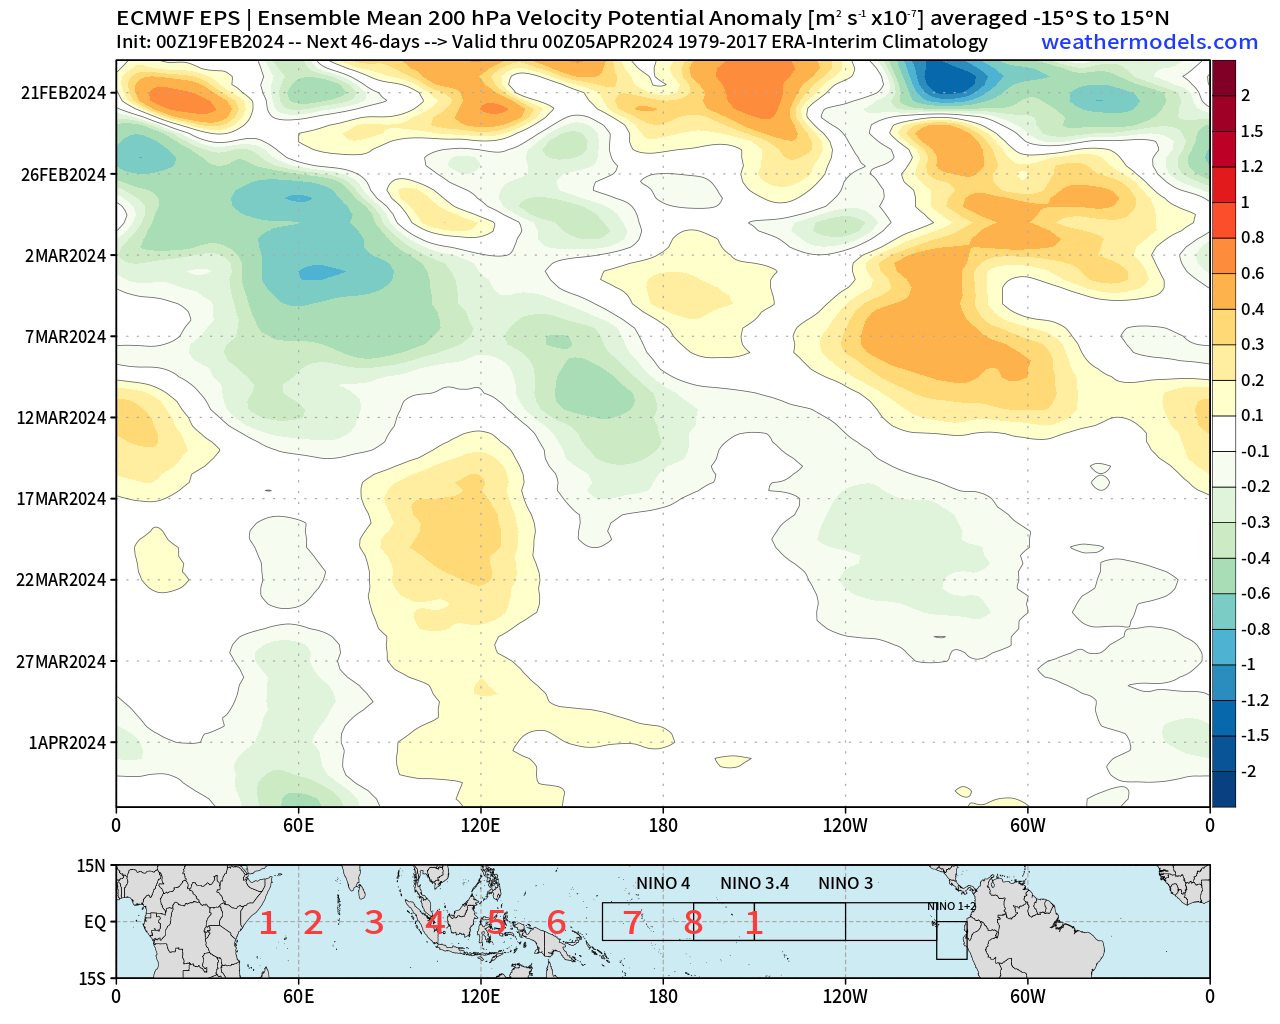
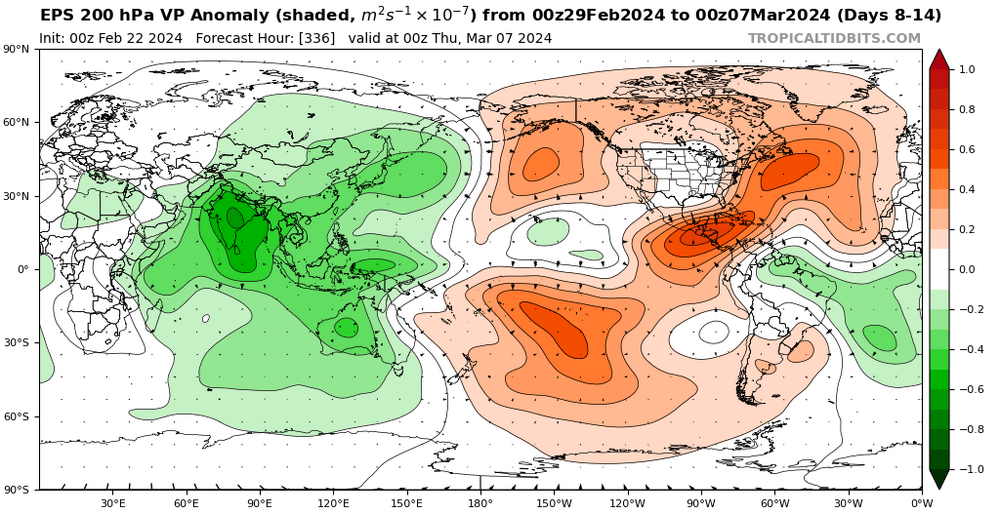
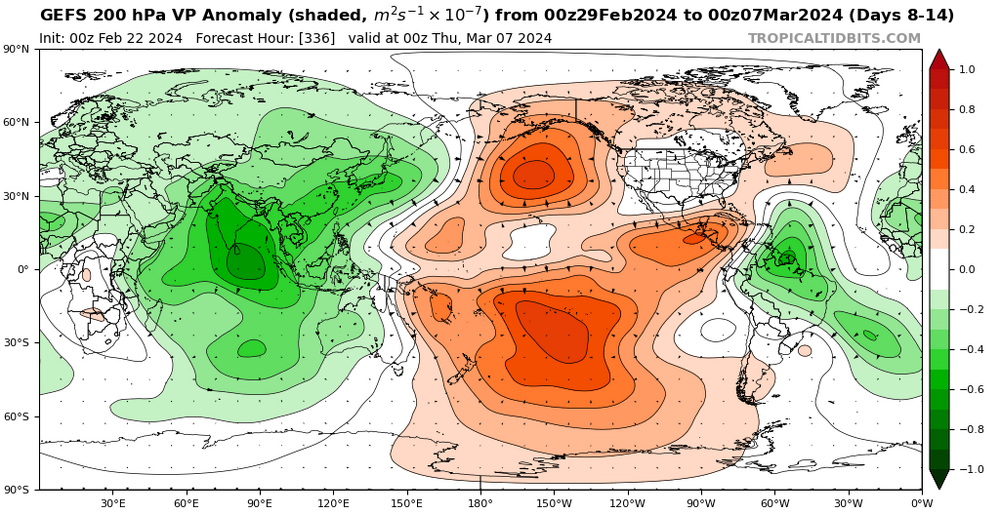
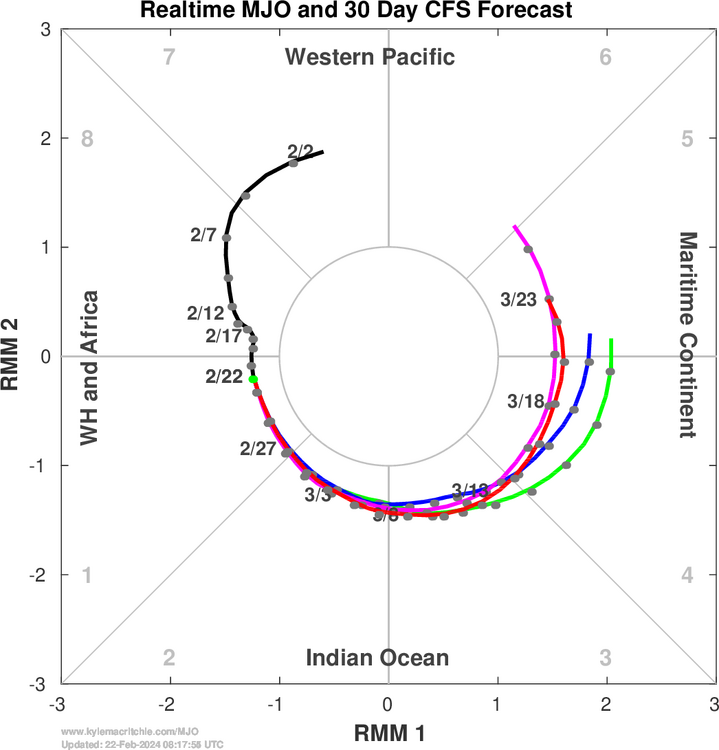
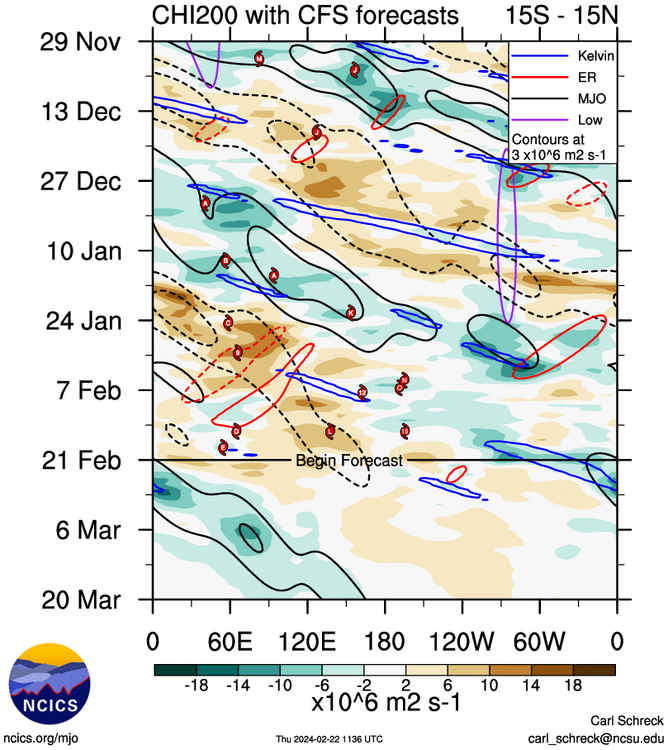
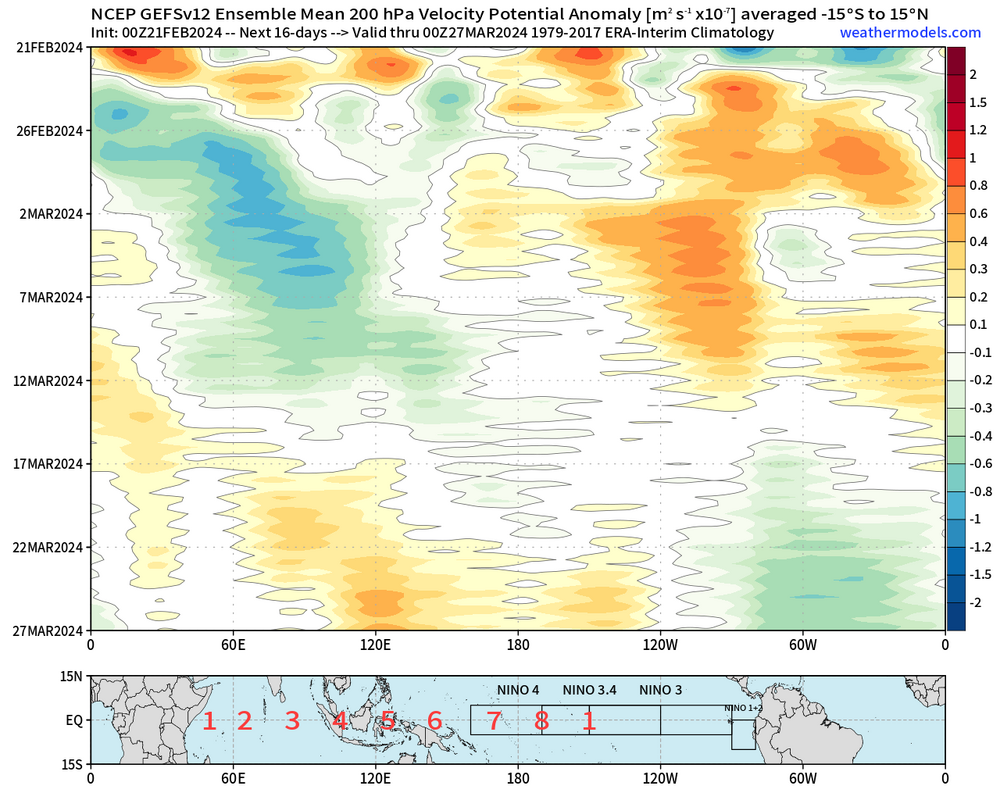
Yes, within 10 days of the upcoming month is the CFS's more skillful phase. But much of that skill hinges on getting the tropical convection/MJO pattern correct. CFS tends to progress the MJO eastward too slowly beyond 7 days. Look how different it is vs. EPS and GEFS even in the 8-14 day period! CFS hangs the -VP anomalies back over far e. Africa and w. IO, whereas GEFS and EPS progress them eastward into the e. IO and Maritime Continent. Looking at longer-range hovmollers, CFS continues to progress the MJO eastward sluggishly, in a manner that to my eyes doesn't make sense. It has the MJO in phases 4 and 5 in late Mar. Meanwhile, the extended GEFS and EPS have the MJO progressing into phases 8 and 1 by late Mar. The implications are very different! The phase 4 and 5 composites largely support the CFS's warm forecast for the second half of Mar. The phase 1 and 8 composites favor a -NAO, western N. America ridging and eastern US troughing, which would suggest normal to colder than normal temps in the second half of Mar. The forecast SSW event in early Mar should have a significant influence in prolonging blocking near Greenland/-NAO in mid to late Mar. I am not sure that this stratospheric warming will behave like a final warming in terms of its influence, given how strong it is forecast to be and how early (EPS indicates the warming peaking on Mar 6-7, which would be the second earliest final warming in the past 40+ years). I agree that Mar 1-10 will feature well above normal temps in the NE US. Mar 11-15 should see a transition period, and in the second half of Mar I would expect slightly below normal temps. The large magnitude of the warm anomalies Mar 1-10 will likely make it tough for the month as a whole to average below normal. But still, I think the CFS forecast for the second half of the month is highly questionable. I would expect the 500 mb/sfc temp pattern for the last half of Mar to be close to a blend of clusters 2 and 3. Cluster 4 (which the CFS forecast is indicating) is close to the prevailing pattern since Dec.


-
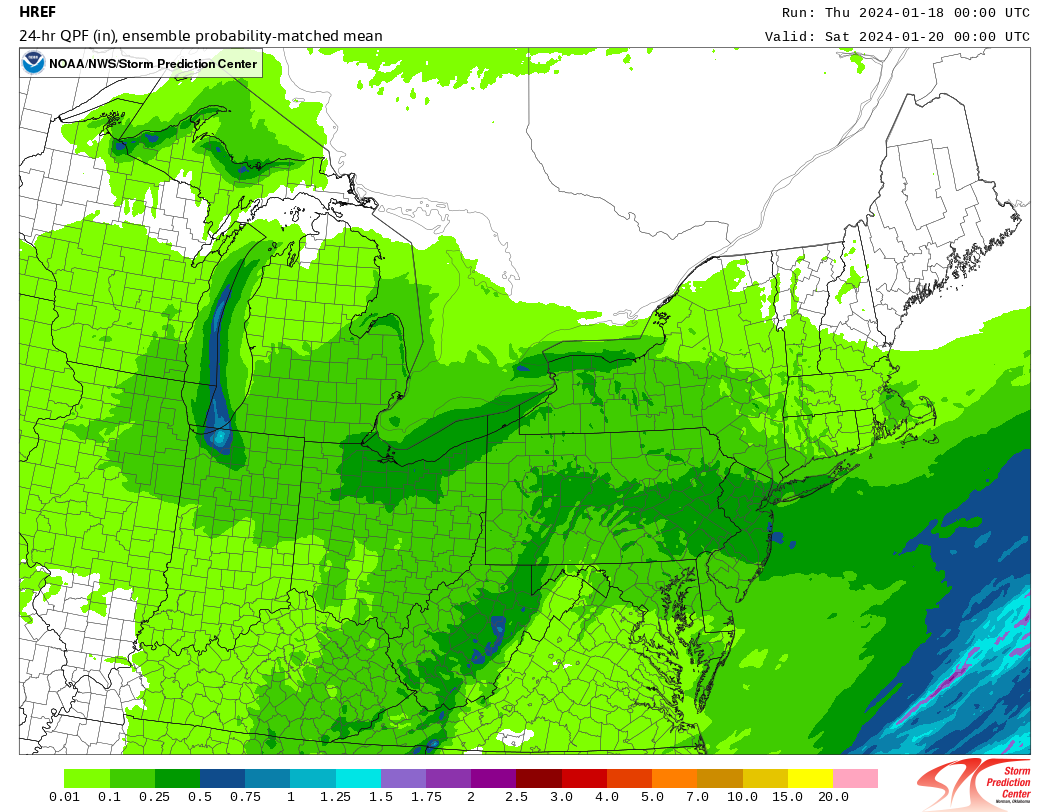
I don't recommend using the HREF snowfall totals verbatim. Its snow-liquid ratios tend to be too high. IMHO, Best to take the probability-matched mean QPF and then convert to snowfall using expected snow-liquid ratios (should be generally 15 to 18-1 in this case).