

mitchnick
-
Posts
26,812 -
Joined
Content Type
Profiles
Blogs
Forums
American Weather
Media Demo
Store
Gallery
Everything posted by mitchnick
-
Nobody knows with any certainty, just like any other year, but most there speak with way too much certainty imho. The only person who is consistently decent with seasonal forecasting year in and year out is Raindancewx. His forecast for our neck of the woods is slightly BN. He doesn't rely on modeling. I do! Lol I say go with the Cansips and forget the daily back and forth.
-
It has become unreadable. The haughtyness is sickening.
-
Cansips forecast for November has been very good. That's the seasonal I'm riding until it fails.
-
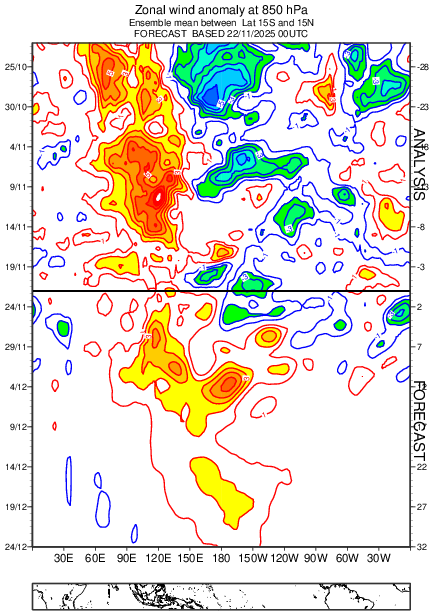
In light of the current weak Niña numbers, if correct, today's progged 850 wind anomalies off the Eps should spell the demise of the Niña before the end of December.
-
Central PA Fall Discussions and Obs
mitchnick replied to ChescoWx's topic in Upstate New York/Pennsylvania
I'll take it for early December. I think we all do OK this winter, disproportionately better the further north imho -
It takes it to a hair over the mean during the first week of January. What's the big deal? More normal presented as sensational on the internet.
-
Come on what? It's a perfect example that the models are doing poorly with warm forecasts and second, we're all wasting our time with these digital slot machines we call models! Lol
-
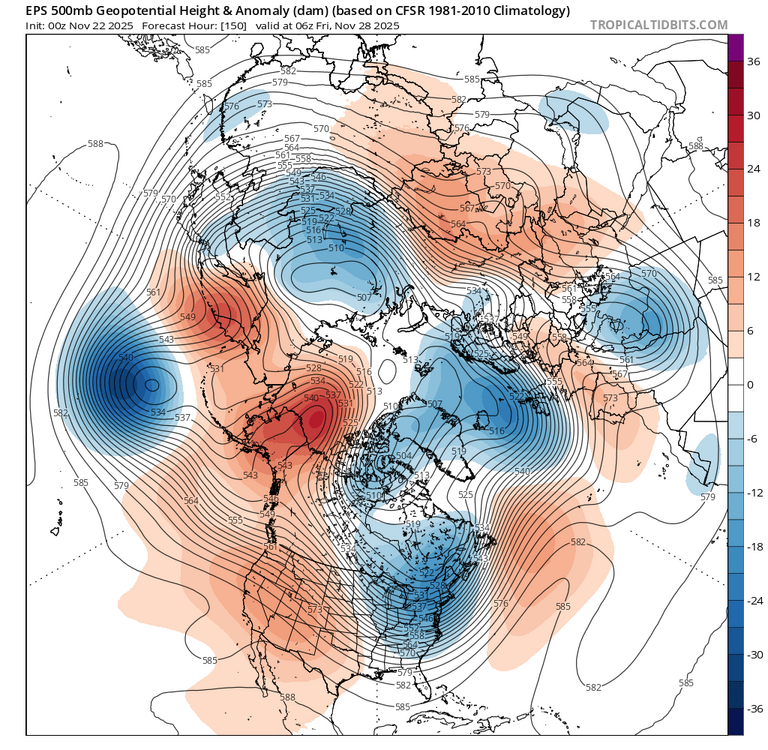
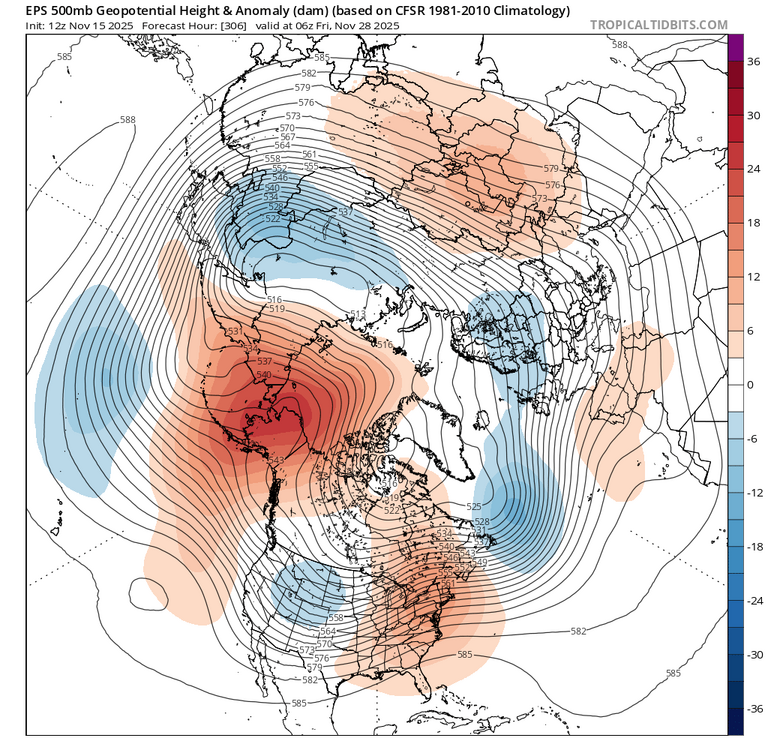
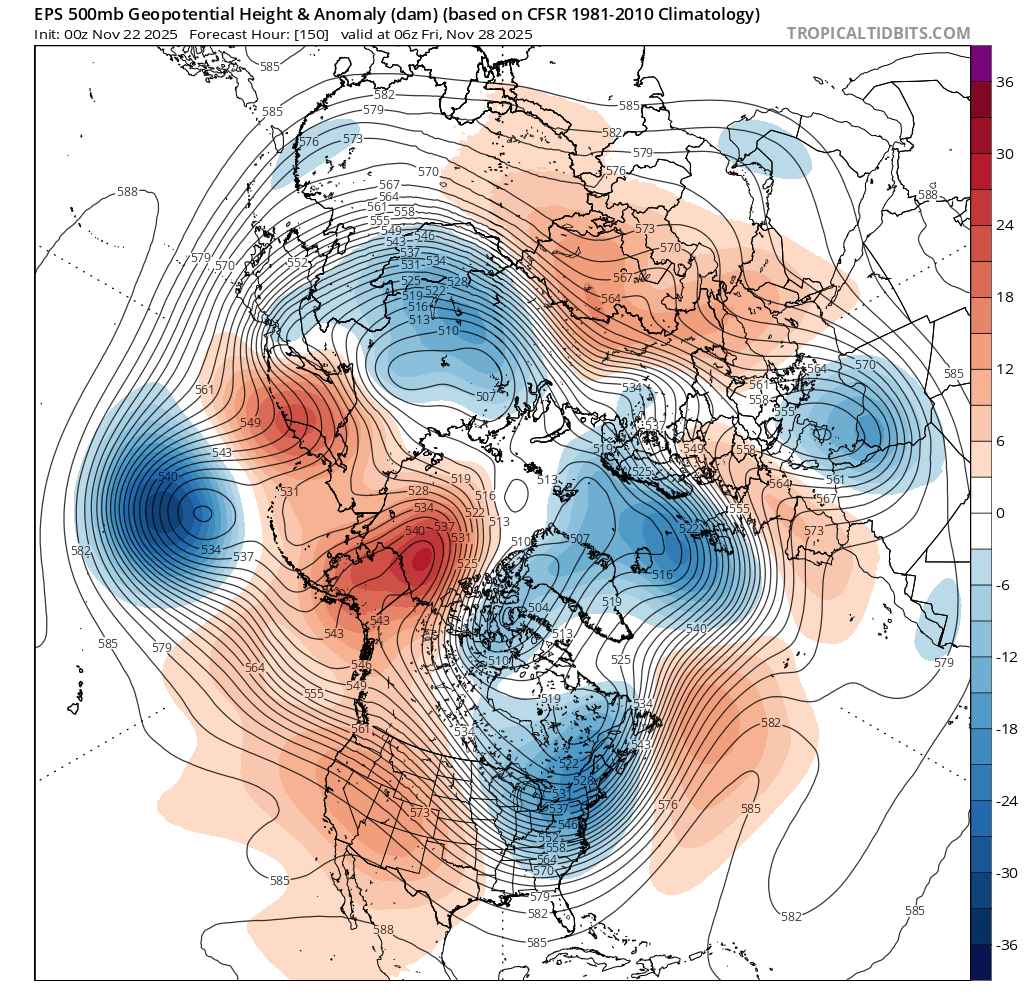
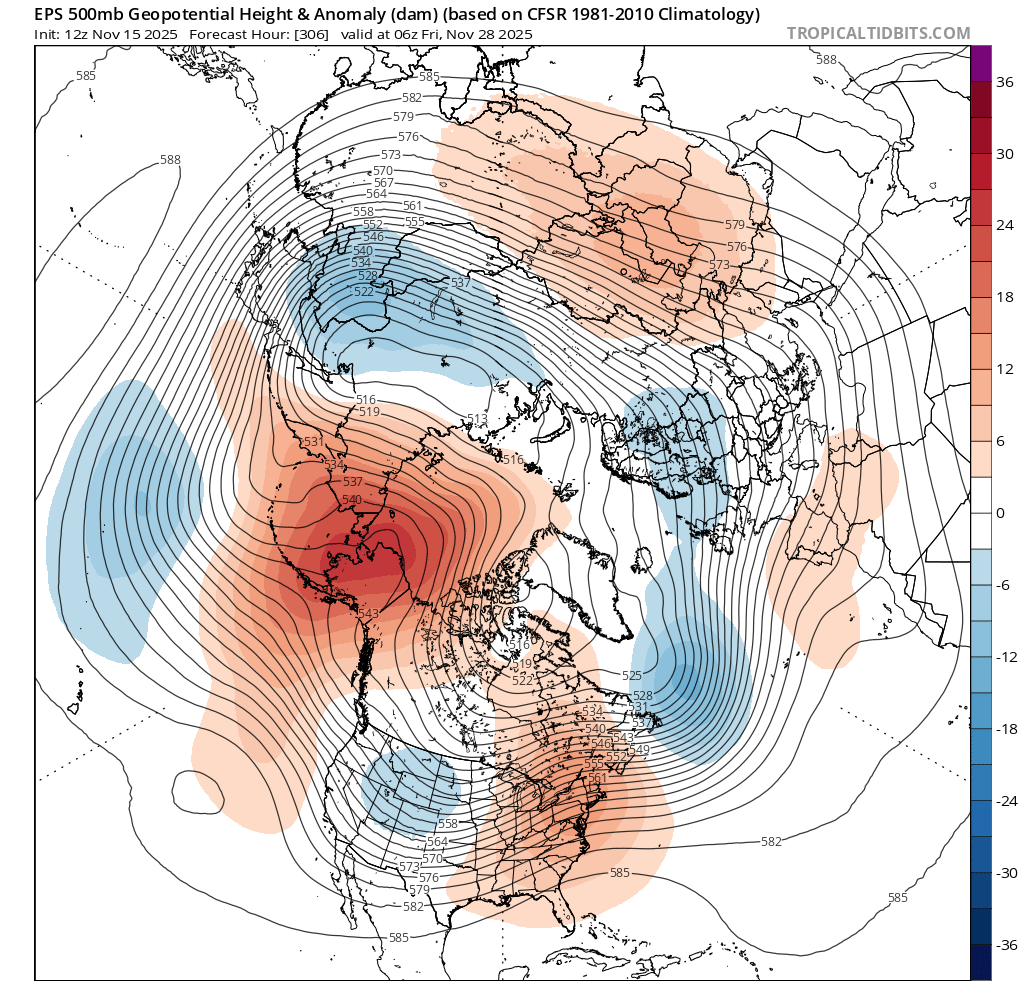
As evidence of my statement that longer range forecasts haven't done well this year, top pick is last night's EPS forecast for Black Friday 12z and bottom forecast us from 11/15 12z.
.png.4f1b6f294b3cd73267726f5651715f84.png)
-
The question is what period you're discussing. There are conflicting signs the way I see it. Even conflicts with the models' own MJO forecasts and 5H forecasts. In the end, all that be done is to look at modeling and hug whichever one suites one's opinion/gut/biases since everything remains on the table once out 7+ days. But we can't deny the medium and long range forecasts this year of warm, like last year, have not been great. So that along with a weak Niña on its way out the door by year end with noticeable western Pacific cooling, I think the urge to assume warmer LR forecasts are going to verify is risky for now. If they do verify, that will change things in my weenie mind.
-
If you put this EPS in motion prior to the 360hr link below, the SER is getting squashed. Also, AO region looks good. Plus, beyond this period, the Eps extended shows movement into 8. Still not high confidence on the MJO, but Cfs2, which is an extension of the Gefs, has the MJO in 8 too. So there's evidence of positive steps in December, which is better than the opposite. https://www.tropicaltidbits.com/analysis/models/?model=eps®ion=nhem&pkg=z500a&runtime=2025112200&fh=360
.png.1873ebb2c4fff5b9d53a9c9cf4711640.png)
-
That's because liquid precip and >32F temps are a guarantee for much of the year (hence "dog bites man" weather) throughout the Conus, save the higher elevations. But I know you know this!
-
Nah...very, very predictable. To be followed up with a "like" emoji by Snowman.
-
0z Euro Thanksgiving weekend. Kuchie is a little less, but it's not like we're dealing with reality, so...
.thumb.png.314be72931406e0ad5e498e49f7f6212.png)
-
I'll be more excited if I start seeing best December since 2013.
-
The companion maps, Eps weekly snow anomalies, from Pivotal have it likely falling the last 2 full weeks of December ending on the 29th fwiw.
-
These weekly Eps snowfall anomaly maps are from Monday fwiw.
-
-16" I knew he was conservative, but...
-
Mean is livin' with the termites. I don't recall ever seeing such an extended, weak period of 10mb winds. Still decently below average into January and lower at that point than several days ago.
-
A link to all the "credible" model RMM forecasts are at this link fwiw: https://www.stormsurf.com/page2/links/mjo_phase.html
-
Been a Iong time since I've been to a great train show. I have a bunch of trains from my youth in my closet to this day in fact. Can't get myself to throw them out or otherwise part with them. Plus, a few are worth a couple of bucks...more evidence of one's age.
-
Those numbers bode well up here/you as well as in Mappy's neck of the woods, on north. Pattern you posted screams more traditional Niña results i.e. a 40N winter. Which "used to mean" we "could" still pull out an event or 2 even with February H5 looking like what you posted. We'll see.
-
While understandably we are all focused on temps, I like that the weeklies are keeping us AN to normal with precip thru December. At least in the Mid Atlantic, dry is always a concern in Niñas, especially Decembers. https://charts.ecmwf.int/products/extended-anomaly-tp?base_time=202511130000&projection=opencharts_north_america&valid_time=202511240000
-
Cansips run this month for December not far off all things considered.
-
Just multiply those numbers by -1 and voila!
-
And it's still below normal on 12/31.


.png.312487dbb4b141dd175791e3e7dd74bc.png)

