

Carvers Gap
-
Posts
17,470 -
Joined
-
Last visited
2 Followers

About Carvers Gap

Recent Profile Visitors
19,691 profile views


-
We need the PDO to go positive IMHO. Bastardi looked at it recently, and mentioned 23-24 as a year that occurred (Nino and -PDO). It tried to go cold but the cold ended up along the spine and front range of the Rockies. There was no mechanism to get the cold into the East for long periods of time. The needed QBO cycle(for cold, snowy) is what is counterintuitive given the solar state(dropping flux at the back en of this cycle?) and ENSO combo. Now, the PDO has moved towards neutral this year. That index really likes to double dip, but this has been a severely negative episode for several years, and I wonder if it flips positive for a bit. However, it could briefly go positive or neutral and then back negative.
-
Great question. One of the guys at WxBell maybe had an article about that. The best winter scenario might be opposite of what I think is normally best. I hate to guess. Let me go look. But the correlation w/ a strong Nino and PDO is tricky.
-
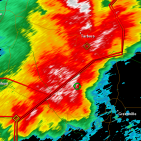
Definitely shredded it. It got its act together again around I-81…just west of the winter twilight zone where snow bands reform on NW flow.
-
I will take an order of disrupted PV during El Nino and split flow please! LOL. Please hold on the "extended summer."
-
The 90s used to be "not that long ago." And just like that, it is almost 30 years ago. To put that in perspective, the same time span remembrance in 97 would have been like trying to remember 1967! Crap.
-

Spring/Summer 2026 Pattern Discussion Thread
Carvers Gap replied to Carvers Gap's topic in Tennessee Valley
Every time I had to unjam the bagger tube on the mower today, I literally thought about your last sentence! Haha! I suppose it is better than the "cloud of dust" La Nina pattern that my yard has experienced for what seems like the last decade. It is crazy how green everything is in NE TN. It is almost like Mother Nature forgot spring, and were are going back and making up the course work right now. -
Spring/Summer 2026 Pattern Discussion Thread
Carvers Gap replied to Carvers Gap's topic in Tennessee Valley
This is about the time of year that I start looking for the first fall air mass on ext LR modeling. Nothing is clear right now. All eyes are on Alaska. If we can stick a ridge in Alaska during late August, that will be something we haven't done in long time, especially at that time of year for any length at all. -
Spring/Summer 2026 Pattern Discussion Thread
Carvers Gap replied to Carvers Gap's topic in Tennessee Valley
One thing which is nice about this in NE TN(not relief for everyone as has been shared), the drought is getting busted up here. We aren’t there yet, but much better off than during spring and winter. -
Spring/Summer 2026 Pattern Discussion Thread
Carvers Gap replied to Carvers Gap's topic in Tennessee Valley
As Jeff noted, that stalled frontal boundary has reared its ugly head this AM. Bean Station is seeing a lot of heavy rain. -
Spring/Summer 2026 Pattern Discussion Thread
Carvers Gap replied to Carvers Gap's topic in Tennessee Valley
Or winter is just gonna be that warm! LOL. But yeah, i need some seriously lower humidity, Jeff. I am soaked every morning after my run. Just looks like someone took a 5 gallon bucket, and poured over my head. Same deal after mowing. Tags are now spring and summer - you all have high standards for thread tags! If it was Montana, I might leave snow. They started the month out w/ winter storm warnings in SW Montana! Fortunately, the west is getting some much needed monsoonal rains in a few areas. I saw that Mammoth had rain this past week. Not unheard of, but it was plentiful. Portions of MT had flood warnings last week which is kind of nuts out there during the summer. Storms kind of fizzled out in NE TN this evening - so far. I don't mind that. Storms IMBY seem to find a way to get pretty bad on NW flow t-storms during July.....just not NW flow snow during January. But yo....send me some crisp air masses. Central Florida can keep this humidity. It's theirs, and they can have it back! -
That line incoming over middle Tenn looks nasty.
-
Spring/Summer 2026 Pattern Discussion Thread
Carvers Gap replied to Carvers Gap's topic in Tennessee Valley
If you all are ok with it, I am going to double-up this thread as both spring and summer....since we are already halfway through summer! If you want another thread, let me know. I have already changed the title to Spring/Summer, but I can change it back to spring if needed. All eyes on the line of storms approaching the forum tonight and tomorrow AM. -
Spring/Summer 2026 Pattern Discussion Thread
Carvers Gap replied to Carvers Gap's topic in Tennessee Valley
Batten down the hatches in TRI tomorrow night and Weds AM along with SE KY, SW VA, and the Plateau. MRX has been on top of it today. Severe threat is real. Slight risk of tornadoes with possible strong, straight line winds. 70mph gusts are being mentioned. I do not want to lose power in this heat. Right now it is 80 degrees at TRI at 10:00PM. Heavy rain is also possible. Could extend into the Central Valley. -
Spring/Summer 2026 Pattern Discussion Thread
Carvers Gap replied to Carvers Gap's topic in Tennessee Valley
The "worst" of summer was partially in April! We had all of those highs in the mid and upper 80s. Since then, we have returned to VERY HIGH humidities to accompany relatively normal summer temps. When I go running in the mornings, it is like someone dumped a bucket of water over me by the time I am done. Still working on my winter ideas. This winter is a lean warm, but truly a crap shoot. I tend to think we start slow w/ kind of a meh December with gradually increasing chances. Late Jan to mid Feb seems like the sweet spot regardless of ENSO. I see no real change to that this winter. Somebody from the Plateau eastward could get hammered by an Apps runner or coastal this winter. As for fall, that season just seems hot lately. I do think Nino should temper the excessive heat and maybe bring normal fall temps by late September. Sometimes Nino winters kind of have a false start during October. The heat out West seems to suggest the Nino pattern has begun. Might be a good year for NE ski resorts? -
Spring/Summer 2026 Pattern Discussion Thread
Carvers Gap replied to Carvers Gap's topic in Tennessee Valley
Kind of rainy, cool, very humid day here at TRI. We used to get these a lot. Nice to see them every once in a while. Heavy rains have fallen in the foothills near Greeneville as others have noted.

