ILMRoss
-
Posts
665 -
Joined
-
Last visited
Content Type
Profiles
Blogs
Forums
American Weather
Media Demo
Store
Gallery
Everything posted by ILMRoss
-
Jeez man who pissed in the euro’s coffee. Didn’t expect to wake up to such an abjectly bad run.
-
This, to me, is a model that’s saying “trust me guys, I know what im doing here”. I know a model is sniffing something out when the isobars in North Carolina look like the Map app when I drove on the blue ridge parkway a few years ago. (If this is your first rodeo, this is sarcasm, I think whatever surface map the GFS is putting down is pretty bogus. No surface map should look this arbitrarily wavy. Nice tick to the SE tho!)
-
Whoa, the ICON pulls the 500z ULL through the Carolinas... breath of fresh air after these models wanted to bring it up the spine of the apps. The 00z ICON, I should mention, is warmer on what looks like every level. edit it's a little warmer but not on "every level" didn't look everywhere i'm multitasking between model watching and dishes
-
It's not so much a dry bias as much as is it... not quite sure how to explain. A precip shield looking like a circle when it should look like an oval. Phantom frontogenesis bands that come and go. I don't have a scientific word other than weird. Things like that when everything else will look fine. When i first became an enthusiast the NAM was known for throwing out ridiculous qpf and its not that.
-
I thought the most consequential thing that the NAM with the "new data" showed was a wholesale shift of our shortwave 50 miles to the east as early as 36 hours into the run. I like using the NAM as an appetizer model for a lot of reasons and one is that I think it can tip the hand of the rest of the models on what the trend de jour of the suite is going to be. I think we're cooking with propane if more models show this shift east with our energy. I will say, one thing i don't use the regular NAM for is precipitation depiction. I've always thought it has looked a bit 'off' with its precipitation depiction, dry areas where I'd expect more precip, etc. I think it's fun to look at but I don't hang my hat on it- I lean on the 3km a lot more for that in my internal calculus.
-
Man that was just an unambiguously terrific GFS run. Weaker and faster with that energy diving in and it just made all the flippin difference. Solid 150 mile shift SE! Reel in like 2 more of those kind of shifts and a whole lot more of this board will look good. I will preach patience, let's give it the 00z suite and 12z suite tomorrow to make sure this run is not some herky jerky blip (although as previously noted, this would continue the NW trend reversal first seen on the 12z)
-
Want to emphasize that the big fat "L" doesn't tell the full story: see below. Despite the southerly position, there's still a low pressure area extending to Memphis. I make this point to basically say don't get too carried away by the Ls near the optimal positions. By perfect getting in the way of good, I was talking about sticking this pre-made graphic on socials and on a show instead of handmaking a graphic which is time consuming. But I totally see your point now and I agree. It's been a while since I've used it but I think that the software WRAL uses has rounding options and I'm wondering why they don't use it- may be a consultant thing.
-
Want to mention something. This is my 11th winter on this board. I've seen so many catastrophic model zr maps. I mean, so many. Every single storm has catastrophic ice storm maps. And yet our benchmark is still Dec. 2002. It seems that once the storm comes, the icy zone always seems to narrow considerably, with sleet or rain cutting into it, and wherever that zone ends up shifting wildly. After all of this, point being: I do not put any stock on model ZR maps until maybe like 12 hours before the event. I do not want to seem like I'm downplaying the threat. Do I still stock up on ravioli I can eat straight from the can? Yes. But just be careful. I think ice maps are magnitudes more unreliable than snow maps.
-
I thought that this run of the Euro had two conflicting items going for it. It seemed that ahead of the storm, 500mb heights were lower and overall the atmosphere was colder. However, the shortwave itself came in a touch stronger and allowed it to curl inland a little faster. It looked like these two tweaks cancelled each other out. I'm pretty neutral on what I just saw.
-
I was kind of surprised to see that Canadian come in strong and amped, even the GFS was a little weaker/further east.
-
Thanks, those are kind words. I'll throw it out there that I am a pure weenie so handicap my analysis as you see fit. That's also a great question. Most recent example that comes to mind is that minor system last year in late January. That storm was kind of similar if I remember correctly- it was a day 6 bomb, and then it was modeled to ride up the coast and people kind of forgot about it. Models slowly slid it weaker and south until I think people on this board were like, hey guys, 48 hours away and the 3km NAM gives Rocky Mount 5 inches... should we talk about this? It turned out alright. I also think the Jan 2016 blizzard ticked south at the end. I chased that storm and stayed with a few buddies in Richmond doing "college student in blizzard" activities and remember sweating that location a few days beforehand. Lastly, I think in March 2018 we had a string of storm after storm after storm that overperformed in North Carolina after initially models had stuff to the north (need some witnesses on that).
-
Fantastic run. First time in 36 hours the GFS didn't throw our energy further west. Not really paying attention to the surface reflection, it'll change, but if this is the end of the trend then we've seen the bottom and we're on the mend.
-
The GFS is finally correcting god bless this will be a better run
-
Do not be fooled by the ribbon of lower pressure on the other side of the apps. Similar to how CAD causes pressure rises in the wedge as stable, dense air piles up, CAD also causes pressure falls on the other side of the mountains.
-
I say this completely in good nature and from a place of levity. But typically, as someone with the username "ILMRoss", when a different user named "BooneWX" tells me not to cliff dive, it's time to cliff dive. Haha
-
Man I am so cooked this morning. I stayed up for the 00z Euro after telling myself I wouldn't and got 5 hours of zzzs. Staying up for the Euro is the meteorological equivalent of a tequila shot, it seems like a good idea at the time but 9/10 times it sucks and you just feel worse the next day. My cats could sense the vibes were off and their meowing was shriller and more frequent this morning. I'm subsisting on leftover Armadillo Grille I can't believe the GFS. *Godfather voice* look how they've massacred my boy. They big wigs in DC actually threw enough money at it to make it competitive and it's no longer our whipping boy. I'm still really unsure about how much it amplifies the trough but if it scores a rout here it likely realigns how I view the model. If it goes any further NW then "welllll, it won't barrel through the CAD wedge...."" is a null issue because a Birmingham/Knoxville/Pitt path is completely realistic (there's no wedge on the other side of the apps!) If you're looking for optimism this morning, it's this: Convection Allowing Models haven't gotten a crack at this thing yet Our offshore bomb Thursday still probably has some kinks to iron out and that will help decide what kind of environment our shortwave is getting into There were hints (like LaCroix flavoring strength hints) of the shortwave beginning to look weaker on multiple models and if we can reel in a weakening/flattening trend its a different ballgame. We're down, but not out, unfortunately climatology is putting Patrick Mahomes out there and we're wheeling out Sam Darnold. It is what it is.
-
Agreed. At this point I think the most important thing is getting this shortwave less amped, skinnier, and quicker. Euro took a nice step towards that. The jump warmer scared me but think there's bigger fish to fry upstairs first.
-
Doing a real terrible job retiring. One more thing I noticed. Check out the GFS trend making this Thursday deal tighter and nudging it to the east on every run. Would be a shame if this eventually happened to our storm

-
My Take before I retire for the night: Not great stuff here. I think that another culprit for our poor runs today has been the general width of our parent trough, which has increased as the day goes on. If you recall, our system a few days ago was a little tighter/wound up. A larger, wider trough is going to churn eastward slower which is a pretty bedrock rule in meteorology, and that a slower, wider system is able to pump up heights ahead of it a little more. As Webb said in his tweets, that downstream ridge amplification is allowing this thing to achieve a negative tilt a little faster and gain latitude. That north stream shortwave i mentioned earlier today is also totally not helping things and letting our system kick NE. As for the Ops/Ens split, I'm unsure, but there's likely something to do with the coarser resolution. Webb is tweeting that it's convection and that the coarser ensembles aren't handling the convection and latent heating as well and if this were a warmer month I'd be inclined to agree. However, this system doesn't really have a ton of convection until it his MS/AL and by that time the difference is pretty glaring, so I don't think it's that. There's another way that coarser model runs suck and that is elevation rendering. The Rockies in a singular GFS ensemble member probably look like something out of Minecraft while the OP has a finer rendering. Since elevation affects vorticity (mountains compress/stretch the air column), I wonder if that is causing the disconnect. If there's a sprinkle of optimism, it's this: Seems like the variance of the GEFS Ens pressure fields increased. Look at below. That yellow shading is variance between the ensembles, and I thought it was interesting that it jumped in a heart shaped zone stretching from Memphis through Savannah to Norfolk. It seems like a lot of ensembles have their own idea with how to make the transfer from the inland low to the coast, and it doesn't seem like this is a done deal yet. (The caveat is that if this whole thing continues to edge NW, we may just be looking at an apps runner. But we'll see about that). Whatever. Hoping the Euro looks OK and that the 12z suite tomorrow is better.

-
Jeez man that was pretty abysmal. We regressed on just about every important thing to look at lol
-
@108 I don’t really see anything meaningfully different yet on this GFS run, maybe a little slower and CADs a little weaker, not fantastic
-
I agree with all of this. I see the point. It’s not a perfect graphic but on a snow week in news when you have 100 people asking you about the storm in social, when you have to coordinate messaging, when you have to produce a couple of afternoon/evening shows and oh on top of all of that do a bit of forecasting it’s a time saver and a “don’t let perfect get in the way of good” kind of graphic. I’m tuning out the 00z ICON I thought it looked kind of wonky
-
TBH those ensemble graphics are manna from forecasting gods at this range. There’s a shape, you get to communicate a pseudo-snowmap well before it’s responsible to put together an actual map but you also get to absolve blame to the model in case things go wrong. I can blame them. I interned there back in the day and one of my good met friends (no comment on who) is on the team; they’re smart cookies and I generally think they thread the needle pretty well of tipping their hand while also being responsible with what they put out.
-
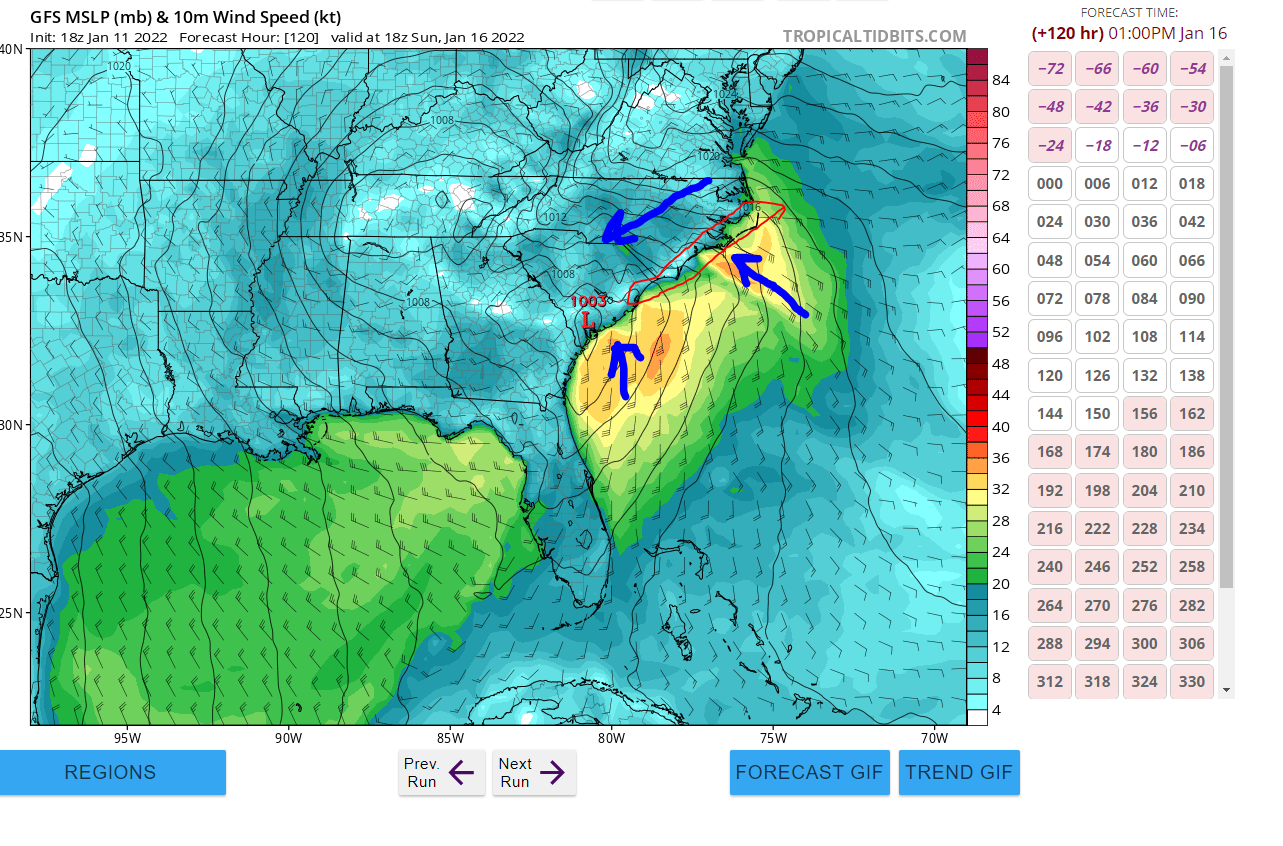
No there's a little truth to that. SLPs want to ride ribbons of low level vorticity, which is the fancy pants way of saying "wind shifts". During CAD wedges, there's an area (typically off the coast) where the NE winds of the wedge butt directly against the SW or SE flowing winds off the coast. This is an area of natural "spin". When upper air energy is close by that spin gets stretched and spins faster (think the common ballerina analogy where it spins faster when the ballerina brings body closer together). So the GFS has this. I've tried to put in some arrows below showing wind speed and where this "ribbon" exists and where you'd expect the LLC to ride. This is basically why all the mets are flummoxed as to why the GFS wants to barrel this thing up 95.

-
I mean look at this. Our ULL? Deeper. CAD signal? More robust. CAD high? Lets strengthen that bad boy by 4 MB. Our villainous kicker SW? It's hanging back a little. Our surface low? Well, I thought that was a little more neutral but whatever. I'm generally sanguine (for the triangle). The GFS is concerning, but I'm dubious with how much it beefs up the ULL. It's just simply hard to get rolling bowling balls that large. I also think that the GFS, with 4 free runs that everybody sees, gets a little more "press" than the other models, which gives it a lot of influence on the vibes.