ILMRoss
-
Posts
668 -
Joined
-
Last visited
Content Type
Profiles
Blogs
Forums
American Weather
Media Demo
Store
Gallery
Everything posted by ILMRoss
-
A thought on this... There's a lot of convective feedback off the coast here... Look at the pattern of the pressure contours! I think the models are going to have a LOT of trouble with this, especially the GFS, which seemed especially prone to botching this kind of stuff during our early January storm this past winter. This screwy representation has a lot of implications, especially with moisture transport. Check out how dry NC is here! I think we trend wetter in this particular instance, especially once convection allowing models get in the game.
-
18z GFS is interesting. GFS has the shortwave landfalling in Cali as a much sharper wave... the orientation is a lot different. I included the trend. I reckon this is what eventually tugged the entire system to the N. 18z output sucked, even for me, but how on earth is the GFS going to make such a large change to the shortwave over one of the most under-sampled regions? I'm not tossing the 18z GFS but I'm not putting much stock in it either.

-
Ehhh... I don't really know if this issue is ever going to go away. The surface highs are nice, but the air mass we're inheriting is a rotting, modifying arctic air mass from earlier in the week. This air mass is going to be a pool of -3 to +3 C temps at 850, and I don't really know a mechanism that's going to change that. As of now, models have for the most part graced us with adequate temperatures, but this is a situation that might be somewhat more sensitive to mishandling of mid level temps than others. The entrenched cold air is never the thing that "wowed" us with this system, so far it's the qpf.
-
Agree with this, the places that have won with previous storms will likely win again. This is just such a beefy, large storm that the jackpot area could be 14-20 inches instead of 10-14 inches like our last couple of miller As. There was a storm in late January 2009 that this storm kind of reminds me of, don't know if the telecommunications/setup was the same but I remember that storm as another rumbling, west to east long duration event. I stayed in a suburb of Winston Salem with family friends and got a great storm. I would though, not hang my hat on the fact that this CAD high will be there. The 00z GFS, while an outlier, was also completely plausible, with an arctic trough/front creating warm air advection ahead of it in the NE and completely sabotaging the cold air supply.
-
I'm not really sweating this model suite too much, although I also have the luxury of being in the S WV mountains and I'll probably be good for at least a safe 3-6 under most scenarios. To the folks that say "The GFS looks kind of weird", you're right. The main change on the GFS wasn't our actual shortwave, but instead the placement of a strong arctic trough at 500mb in the NE. Look at the trend I posted- the 00z GFS backs this feature further SW by a solid 500 miles! This messes with everything- Not only does is completely shift areas of ascent and descent, and warp our high pressure, but it also acts to sweep out our low pressure very quickly- that's why the GFS is faster. Other runs and other models feature a slow, lumbering southern wave traveling unfettered from Cali to the east coast. Things get quicker when it gets caught up with whatever this trough is making an appearance.
.thumb.gif.4fdf989c90e64edf2ea392396fe1847e.gif)
-
I've been sniffing around these forums since winter of 11/12 and this storm is already in the top tier of consistency in the long range compared with previous storms. In my experience, it joins the echelon of 2/13/14 and 1/23/16 in terms of seeing a signal that somebody was going to get smashed 8 days beforehand. I've heard a theory that sometimes these potential "big dogs" can get sniffed out very quickly and show more consistency than smaller-scale, more nuanced storms. Which makes sense- bigger systems would probably have larger parent shortwaves and would be easier to model. In any case, looks like a fun system. One thing I will say that I've noticed- The high is nice, but I'm really not very impressed with thicknesses or the depth of the cold air. We're not negotiating with record cold after, to put it lightly. I would watch trends with mid level temperatures. That being said though, still a very strong signal this far out.
-
Just remember it's a whole lot easier for a nascent hurricane or old swirl to RI than it is a giant, tilted, sheared hurricane with 3 different concentric eyewalls. That being said, if this storm can manage to get it's core in order in time for the gulf stream passage, then yeah, expect a second wind.
-
I think that you need a much smaller storm in order for that to really have an effect.
-
For the umpteenth time today Florence is trying to figure out how to eye wall. Don't know how big of an issue dry air really is, we'd probably see more examples of outflow arcs racing away from the center on VIS if it was reallllllyyyyy a big problem. If southerly shear has been over the storm all day, that's probably helped with some sinking air on the south side. If winds aloft have a slight southerly component, then winds are starting to turn counterclockwise with height- backing winds. That's going to cause the air to sink, and it's probably why we haven't seen any CDO maintenance on that side of the storm whatsoever. If this shear really is expected to abate, we'll probably see any CDO persist a little longer.
-
To elaborate. Most mets actually do use GFS and Euro in their shows. What people remember though, is the RPM, since its in 15 minute increments and it's easier to display, zoom in on, and understand.
-
I really wouldn't put too much stock into whatever the "futurecast" or "RPM" or whatever the weather model news stations show... We use it because WSI, the company most stations (WRAL for example) runs that model and makes it super easy to manipulate that model into easy to understand graphics. Personally I hate it. WSI doesn't offer anything with the NAM 3km, which I would use. Point being, I would absolutely take anything the RPM is saying with a grain of salt and instead use hurricane models and globals.
-
Yup... Hoping for some clarity
-

The December to Remember 7th-8th blue turd winter threat thread.
ILMRoss replied to lilj4425's topic in Southeastern States
HRRR is very aggressive on precip arrival tomorrow morning. A lot of places currently on the SE flank of the R/S line could sneak in an inch or two given this setup before warmer temperatures aloft advect in. GSO sounding is going to be important to decipher!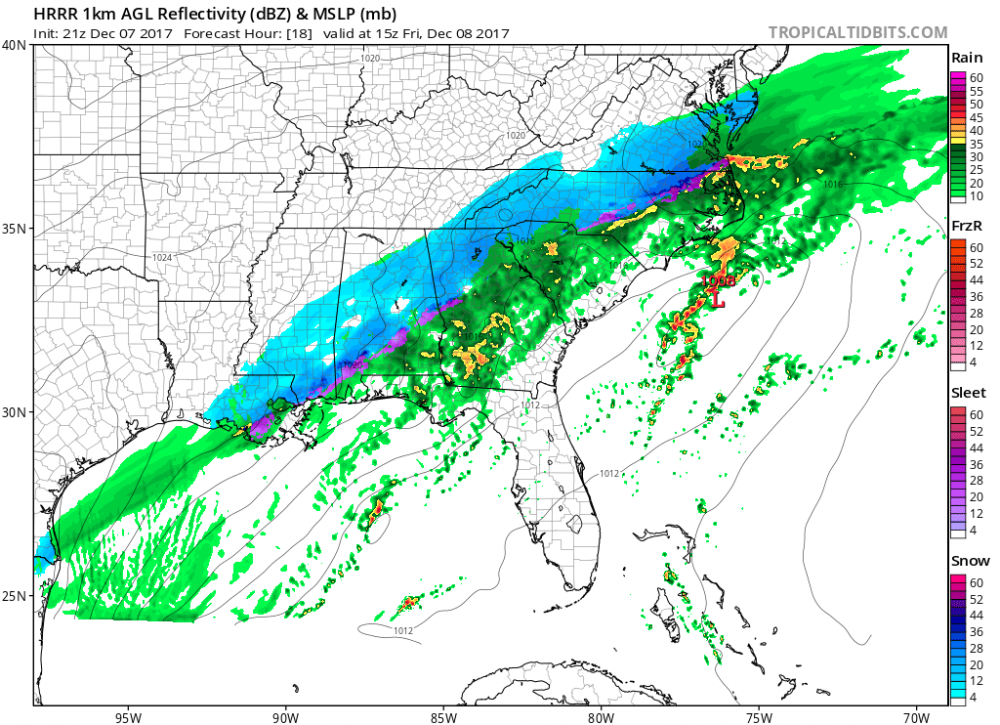
-
The December to Remember 7th-8th blue turd winter threat thread.
ILMRoss replied to lilj4425's topic in Southeastern States
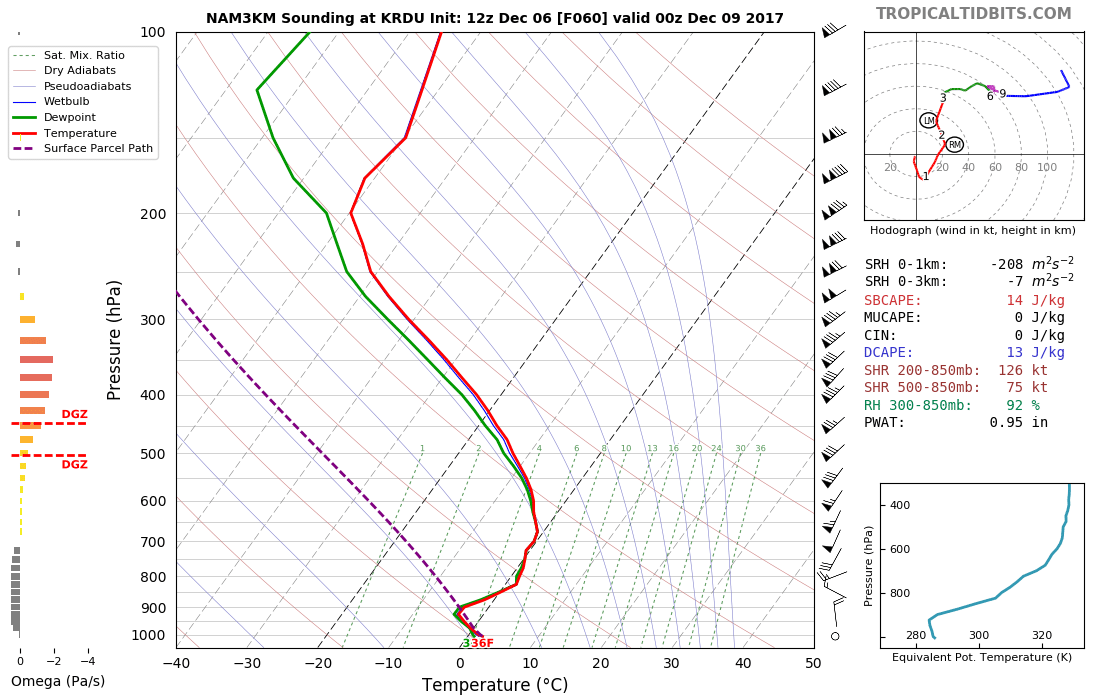
NAM 3k sounding for RDU on 00z Sat... Close but no cigar.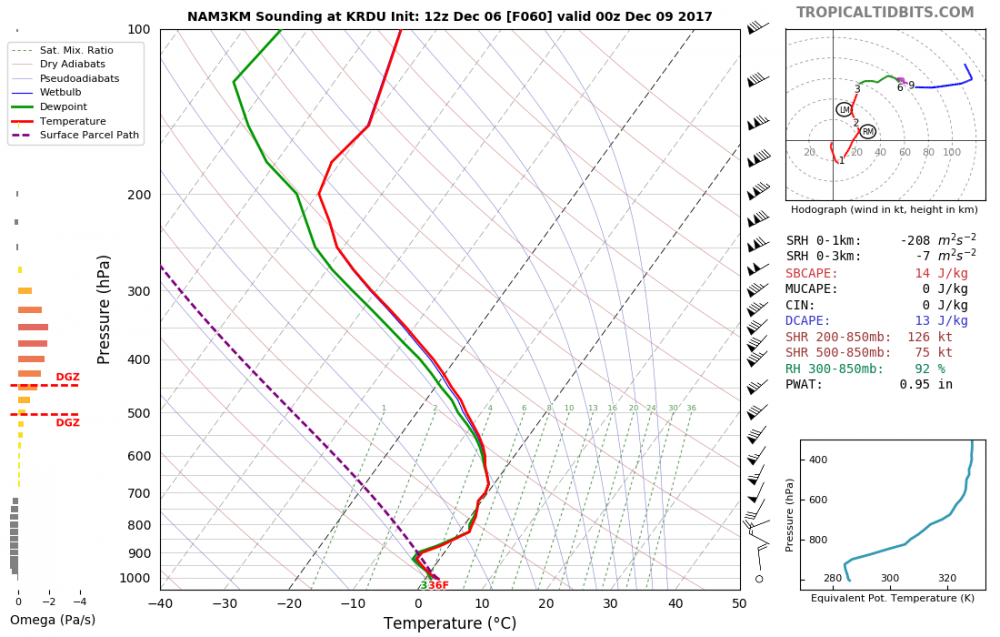
-
The December to Remember 7th-8th blue turd winter threat thread.
ILMRoss replied to lilj4425's topic in Southeastern States
Different set up. That event featured a strong low pressure and generally amped set up. This event has a much weaker low, with less warm air advection that could strengthen a warm nose. Temps at low levels are the problem, and that's one of the *few* things that could be modeled completely wrong given the modeled precipitation rates. -
Cool so I have a better chance of meeting Jim Cantore than I do salvaging something to make breakfast from today :/ I should of went grocery shopping while still in Wilmington


.gif.1112908655ad8bf54cf632e1a3ae9cdf.gif)