
MegaMike
-
Posts
440 -
Joined
-
Last visited
Content Type
Profiles
Blogs
Forums
American Weather
Media Demo
Store
Gallery
Everything posted by MegaMike
-
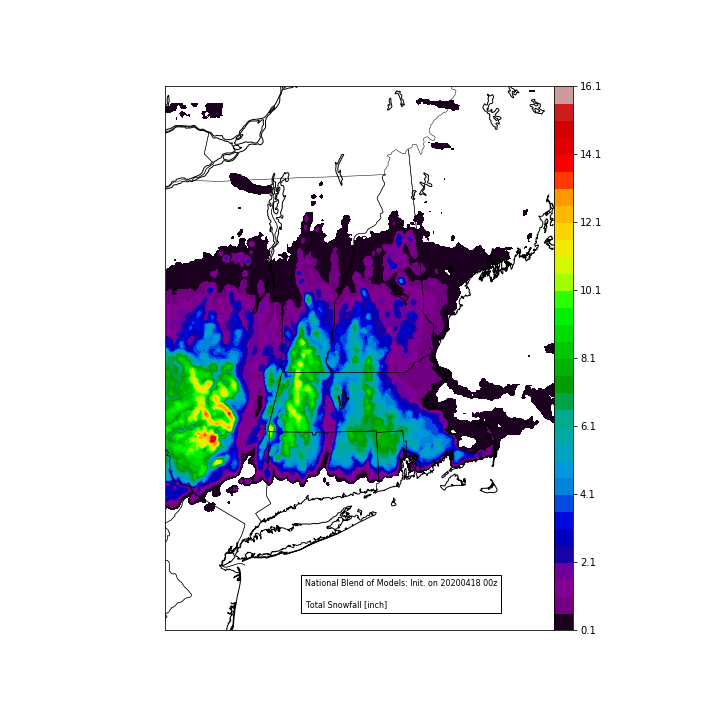
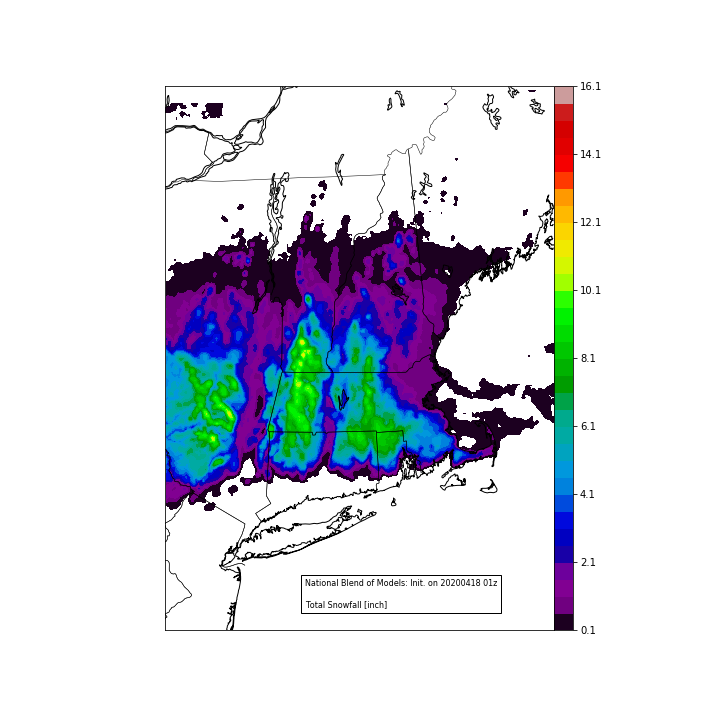
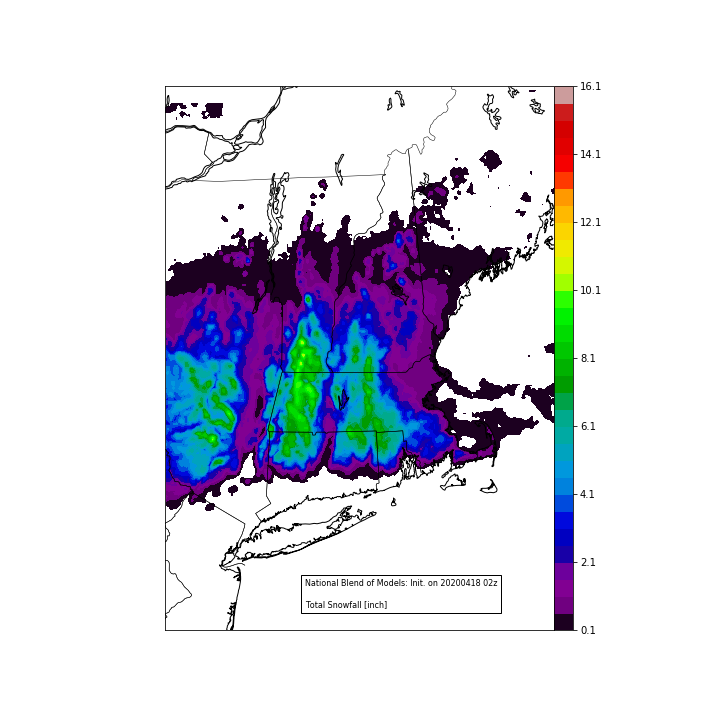
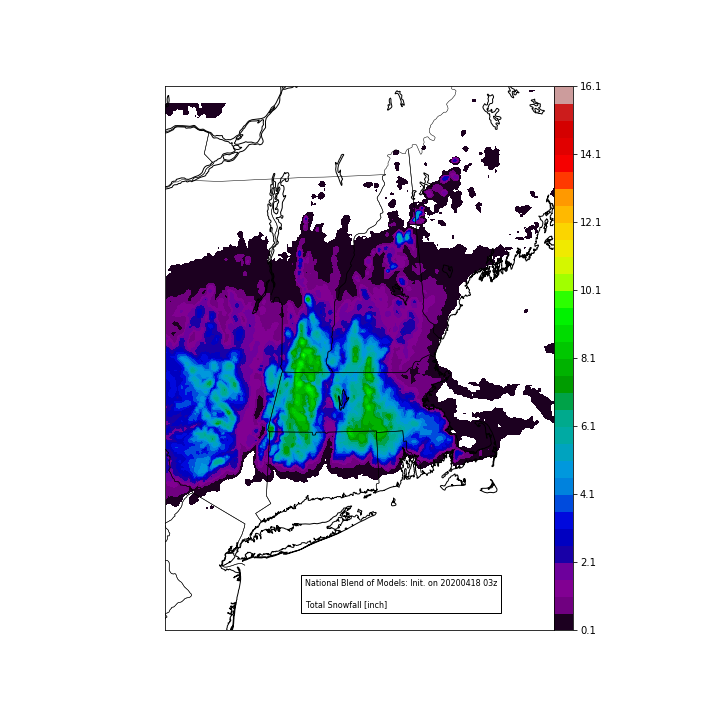
I've been asked to evaluate the National Blend of Models for its accuracy in terms of snowfall. As a side task, I wrote Python script to plot snowfall accumulations for the most recent NBM cycles (00z, 01z, 02z, and 03z). They look pretty bullish compared to other models, but spatially they look pretty similar (higher impacts in western MA and the Worcester hills). I'm looking forward to seeing how well they perform. I hold the NBM to high standards although its snowfall accumulations (in my opinion) look too high for this event. If anyone's interested, most operational NWP products are available via the NOMADS server <nomads.ncep.noaa.gov>. In the future, I'll make my plots nicer, but for the time being, it's not being used by a third party so :shrugs:
-
I stumbled upon this thread by chance trying to look for a precipitation analysis method for an evaluation with respect to multiple (44) winter weather events. The idea was that if I conduct MODE analysis between StageIV precipitation w.r.t modeled hourly precipitation, I can determine the accuracy of banded precipitation vs. several modeling systems (ICLAMS/WRF). Unfortunately, it's recommended (strongly suggested) by the developers to avoid such a methodology due to poorly ingested liquid water equivalent observations under snowy conditions... The rain gauges struggle to observe liquid water equivalent when snow is falling... I'm now considering the RTMA, URMA, or possibly, a satellite derived product instead. "Each River Forecast Center (RFC) has the ability to manually quality control the Multisensor Precipitation Estimates (MPE) precipitation data in its region of responsibility before it is sent to be included in the Stage IV mosaic. The precipitation values,however, are not intentionally modified downwards during snow events. Rather, due to inaccurate measuring of liquid equivalents at many gauge locations (e.g., a lack of the equipment to melt and measure the frozen precip), zero or very low values are reported at these locations. These "bad" gauge values then go into the MPE algorithm, resulting in liquid precip estimates that are too low during winter storms. There are also problems with zero or too low precipitation values at many RFC gauge locations even outside of heavy snowfall events." "There are problems with the RFC precip data in the eastern U.S. during heavy snow events. While ASOS stations have the equipment to melt the snow and derive the liquid equivalent precip, the RFC stations in the East do not. So when there are big snowfall events such as the January 2016 blizzard, the snow accumulations get recorded, but the corresponding liquid equivalents often come in as zero or near zero amounts, which are incorrect." If you're curious (Model Evaluation Tool for MODE analysis): https://dtcenter.org/sites/default/files/community-code/met/docs/user-guide/MET_Users_Guide_v8.1.2.pdf
-
The difference between the NAM3km and the NAM12km/32km at 500hPa is pretty extreme. By now, you'd expect some consistency or at least a realistic simulation (from the NAM3km). I definitely agree with you... Toss the NAM3km.
-
I really like your graphics, The 4 Seasons! Are your interpolations done manually? Also, what program/software do you utilize to create your graphics? Some recommendations/suggestions (in case you erased your inbox): If you're looking for pre-1993 observations, try getting your data via the Global Historical Climatologist Network (GHCN). You can get snowfall totals (and what not) from 1973-today (for in-situ/surface stations). If you want snowfall totals for specific events, you'll have to sum daily snowfall accumulations for 't' # of days and for 'n' # of stations. Conveniently, the data is quality checked! Here's the URL: ftp://ftp.ncdc.noaa.gov/pub/data/ghcn/daily/ Personally, I like working with the yearly ('by_year') .csv files. Last thing, if you're using crowd sourced data, I'd recommend processing the data through a spatial outlier test. The "Local Anselin Moran's" algorithm can be used to scientifically eliminate suspect/faulty observations. Michael Squires (created the Regional Snowfall Index scale =~ NESIS ) used this method for his research. Algorithm details: https://pro.arcgis.com/en/pro-app/tool-reference/spatial-statistics/h-how-cluster-and-outlier-analysis-anselin-local-m.htm If you're interested, I wrote script for Moran's algorithm utilizing Python.
-
Mainly FORTRAN (great program for running numerical computations) on a Linux OS. When it comes to post-processing data; NCL, REVU, MATLAB, and or PYTHON.
-
Pinging is getting louder (Pawtucket/Providence). I'll call it a night here in the "Bucket." I don't expect much more additional snowfall accumulation(s) for my area. Enjoy the storm, everyone!
-
Yea... Starting to mix now in Pawtucket/Providence... Visibility at KPVD increased to 0.75 miles. I went outside and there's a mix b/n snow/sleet/and mist. I'd put the ratio at 80/10/10. I roughly have 8 inches of snow otg.
-
Unfortunately, snow ratios haven't been impressive over the past hour in Pawtucket (near Providence). Visibility increased since earlier this morning as well. I'll go outside to make an observation soon.
-
Mixing hasn't reached the Pawtucket/Providence area so far. KPVD actually observed 0.05 inches of LWE (assuming it's SWE) in 5 minutes from 3:35->3:40am 0.17 inches of LWE since 3:00am with no observations of mixed precipitation..
-
Roughly about 3 inches in Pawtucket. Sticky snow with good ratios. Not much accumulation on the roadways though... Maybe about an inch.
-
Hello,
Please read my comment that I posted to your 'stock market' related thread!

-

March 12/13/14 Blizzard/Winter Storm/WWA etc
MegaMike replied to Bostonseminole's topic in New England
Meh. They were in between bands for most of the event. I don't think they ever got into the mega band, either (by a few miles). I'm glad I'm in RI for this event instead! -
March 12/13/14 Blizzard/Winter Storm/WWA etc
MegaMike replied to Bostonseminole's topic in New England
There are three observations of 8+ inches of snow already. North Dighton, MA (8.2/9:38am), Acushnet, MA (8.0/9:45am), and Burrillville, RI (8.0/9:12am). It seems like most of interior SE MA and RI have snowfall accumulations between 4-8 inches atm. -
Simple Visual Comparison B/N The Blizzard of 2005 vs 2015
Images added to a gallery album owned by MegaMike in Members Albums Category
I added this by mistake, but I may as well finish this thoroughly. I'll label everything properly. All eight images are comparisons between the Blizzards of 2005 and 2015. I have two images for the following: Mean Geopotential Height (at 500), Trajectories (origin of cold air), Mean 5mb)rface Temperature, and Surface temperature Anomaly.

