MegaMike
-
Posts
440 -
Joined
-
Last visited
Content Type
Profiles
Blogs
Forums
American Weather
Media Demo
Store
Gallery
Everything posted by MegaMike
-
OBS/DISCO - The Historic James Blizzard of 2022
MegaMike replied to TalcottWx's topic in New England
Based on Dube's thesis, it's a conditional function between ice crystal type (needled, dendrite, etc...) and maximum wind speed from the cloud base to the surface (Vmax in kt): https://www.meted.ucar.edu/norlat/snowdensity/from_mm_to_cm.pdf The algorithm is more complicated than Cobb and Waldstreicher's methodology (https://ams.confex.com/ams/WAFNWP34BC/techprogram/paper_94815.htm), but Cobb and Waldstreicher does note the significance of fragmentation. "The last step would be to account for the subcloud and surface processes of melting and fragmentation." Generally, fragmentation can be broken up as, Condition 1. Vmax < 5: No fragmentation Condition 2. 15 = > Vmax > 5: Very slight fragmentation Condition 3. 25 = > Vmax > 15: Slight fragmentation Condition 4. Vmax > 25: Extensive fragmentation More fragmentation == smaller SLR. -
OBS/DISCO - The Historic James Blizzard of 2022
MegaMike replied to TalcottWx's topic in New England
Jealous of my brother in Norton, Ma. He's near the center of the death band.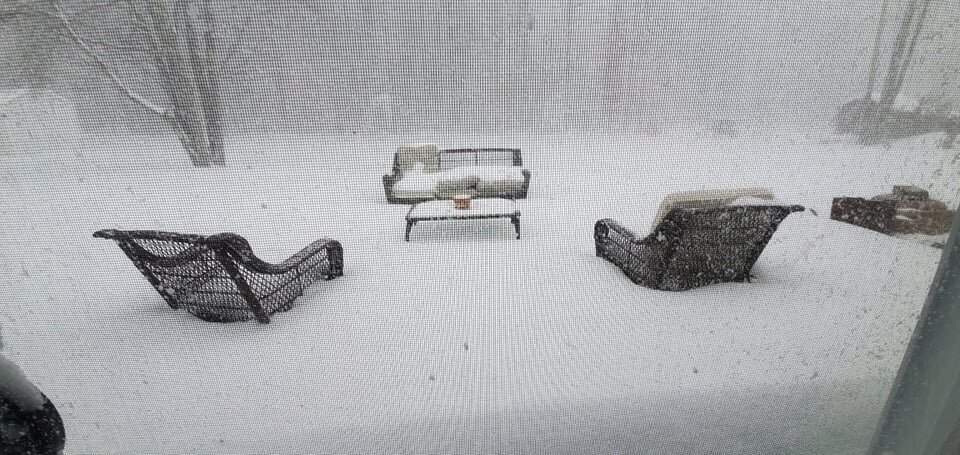
-
Agreed! They're all great models and they have their own purposes, but they have limitations as well. Through experience (running WRF/RAMS/ICLAMS simulations), they get inaccurate during dynamic events involving a copious amount of latent heat - You'd think that running a simulation for Feb, 2013 would be easy using analysis data (initialization data of a modeling system). Nope! I tried with the GFS, FNL, NAM, HRRR, and ERA... Nothing performed well in terms of QPF distribution across New England. If you look at hurricane models, they're run at fine resolutions to resolve convective/latent heat processes. Despite that, finer resolution models rely on global models (and hence, regional models) to 'feed' their initial and boundary conditions. Artifacts in == artifacts out. That's why I'm not too concerned about the mesos showing a dual low structure at the moment (we'll see what happens at 00 UTC). Last thing. This isn't directed at you, but the NAVGEM is used by the Navy for the Navy. Please don't use it for complicated atmospheric interactions. The Navy only cares about coastal areas, oceans, and relatively deep bodies of water. That's its purpose
-
A good chunk of the storm has been offshore for the past several cycles. Prior to that, the models likely had an easier time resolving the convection on their own (explicitly or with a parameterization). Now that part of the storm is offshore (and is still developing), the models are more reliant on data assimilation to create an accurate initialization state to accurately predict the interaction between both disturbances. Remember when we thought it was weird that radiosondes were dropped downstream (Atlantic) as opposed to upstream (Pacific) of the disturbance(s)? This was likely the reason, in my opinion. Let the storm mature and let the PBL stabilize further south as the night progresses. Data assimilation will improve and so will NWP. I wouldn't be surprised if the system becomes more consolidated/further west by 00 UTC (as other mets suggested).
-
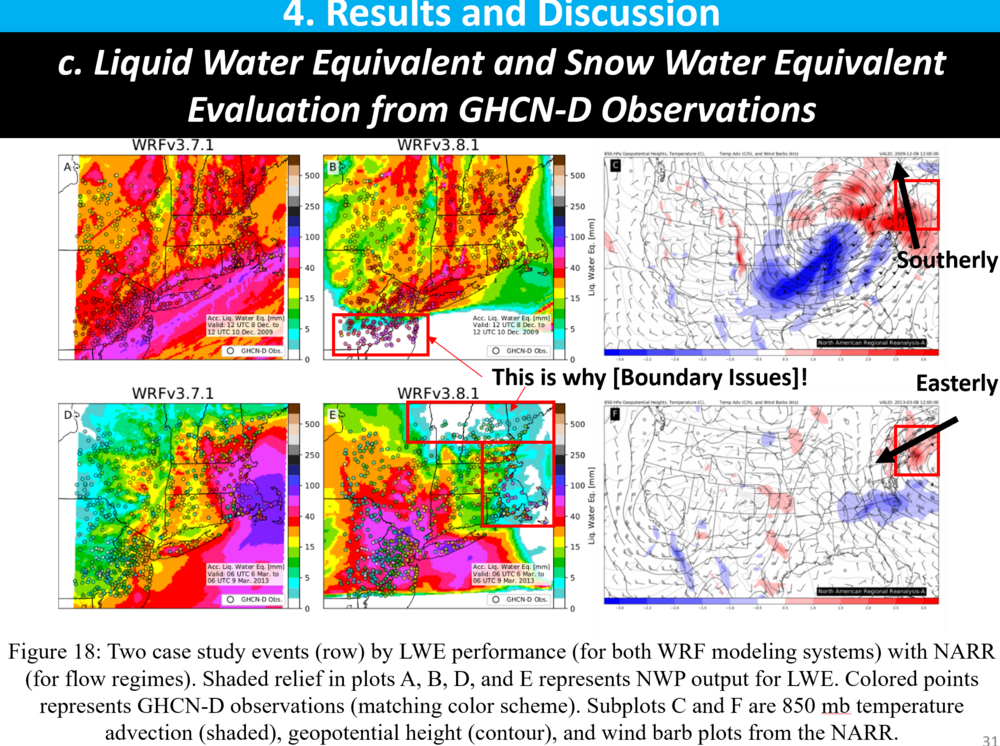
Ignore it. The configuration produces boundary issues which causes little-to-no precipitation along the boundary of predominant flow. You can see it on the eastern side of the domain (a lot of QPF to basically none). I sent them an email about it. When the server no longer works, it's not coming back.
-
I should've been more explicit with that prompt. My bad! That was a comment for the WRF modeling system, but the "convective grey zone" is a problem for all modeling systems really. The Met Office acknowledges it too - https://www.metoffice.gov.uk/research/approach/collaboration/grey-zone-project/index
-
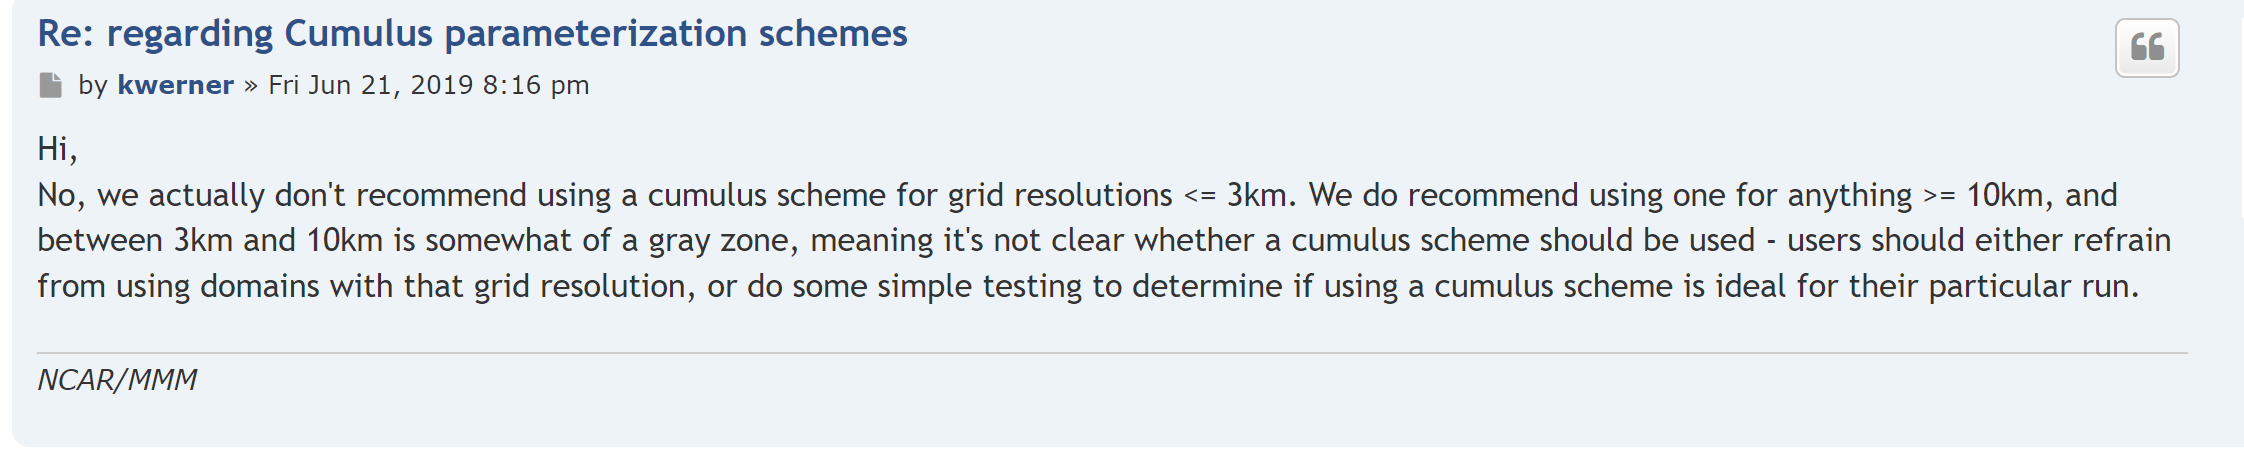
Give it until 00 UTC tonight to lower expectations. Let the storm fully materialize so that data assimilation can work its magic. I'm not surprised the ECMWF altered its track. Initializing a (relatively) course modeling system (9km, I believe) with a developing/phasing, southern shortwave must be challenging to resolve/parameterize. See the below comment from an NCAR employee: I'm more concerned about the mesos depicting the dual low look, but it's perhaps still a little too early for them as well.

-
We're kinda' in a "gray area" for NWP at the moment - A little too early to completely rely on fine scale models like the HRRR, NAM 3km, and HRDPS (to name a few) & a little too late for the global modeling systems (ECMWF, GFS, CMC, etc...). I mentioned it last event, but I'll repeat it again: Finer scale modeling systems (less than, say, 4km) can explicitly resolve convective processes. Courser models need parameterizations, or approximations, to resolve such processes. In between that, you have models that can partially diagnose convection, but may require convective parameterizations (~10 km - RGEM). These in-between modeling systems may give you odd-looking results. That written, it's clear that at some point, we need to put more weight into the mesoscale models somewhat soon since convective processes will be important as the disturbances rapidly intensify over the Atlantic. In my opinion, if the dual low/structure is around by 00 UTC tonight (by the mesos), I'll begin to take the dual low/structure seriously even if the global models do not. Why at 00 UTC? The PBL is more predictable (yea, I know it's January) and easier to assimilate into NWP at night along the east coast vs. during the day. 00 UTC cycles reduce uncertainty (I'm also aware of statistics for the 00/06/12/18 UTC cycles) in my opinion for that reason.
-
Edit - Misread that, but still informative The verification page is here: https://www.emc.ncep.noaa.gov/users/verification/ I recently found it while looking for model specifications. It looks like it's still "under construction." They have evaluations (surface and aloft) for the GFS, GEFS, SREF, and other climate modeling systems.
-
You're not looking at two instantaneous fields. edit: instantaneous not instantons lol Precipitation type and intensity: 6 hour, average precipitation rate... Honestly, I don't know why they'd choose to plot this. MSLP contours: instantaneous field interpolated by a programming utility. Use TT's 'MSLP & Precip (Rain/Frozen)' and 'Radar (Rain/Frozen)' graphics instead.
-
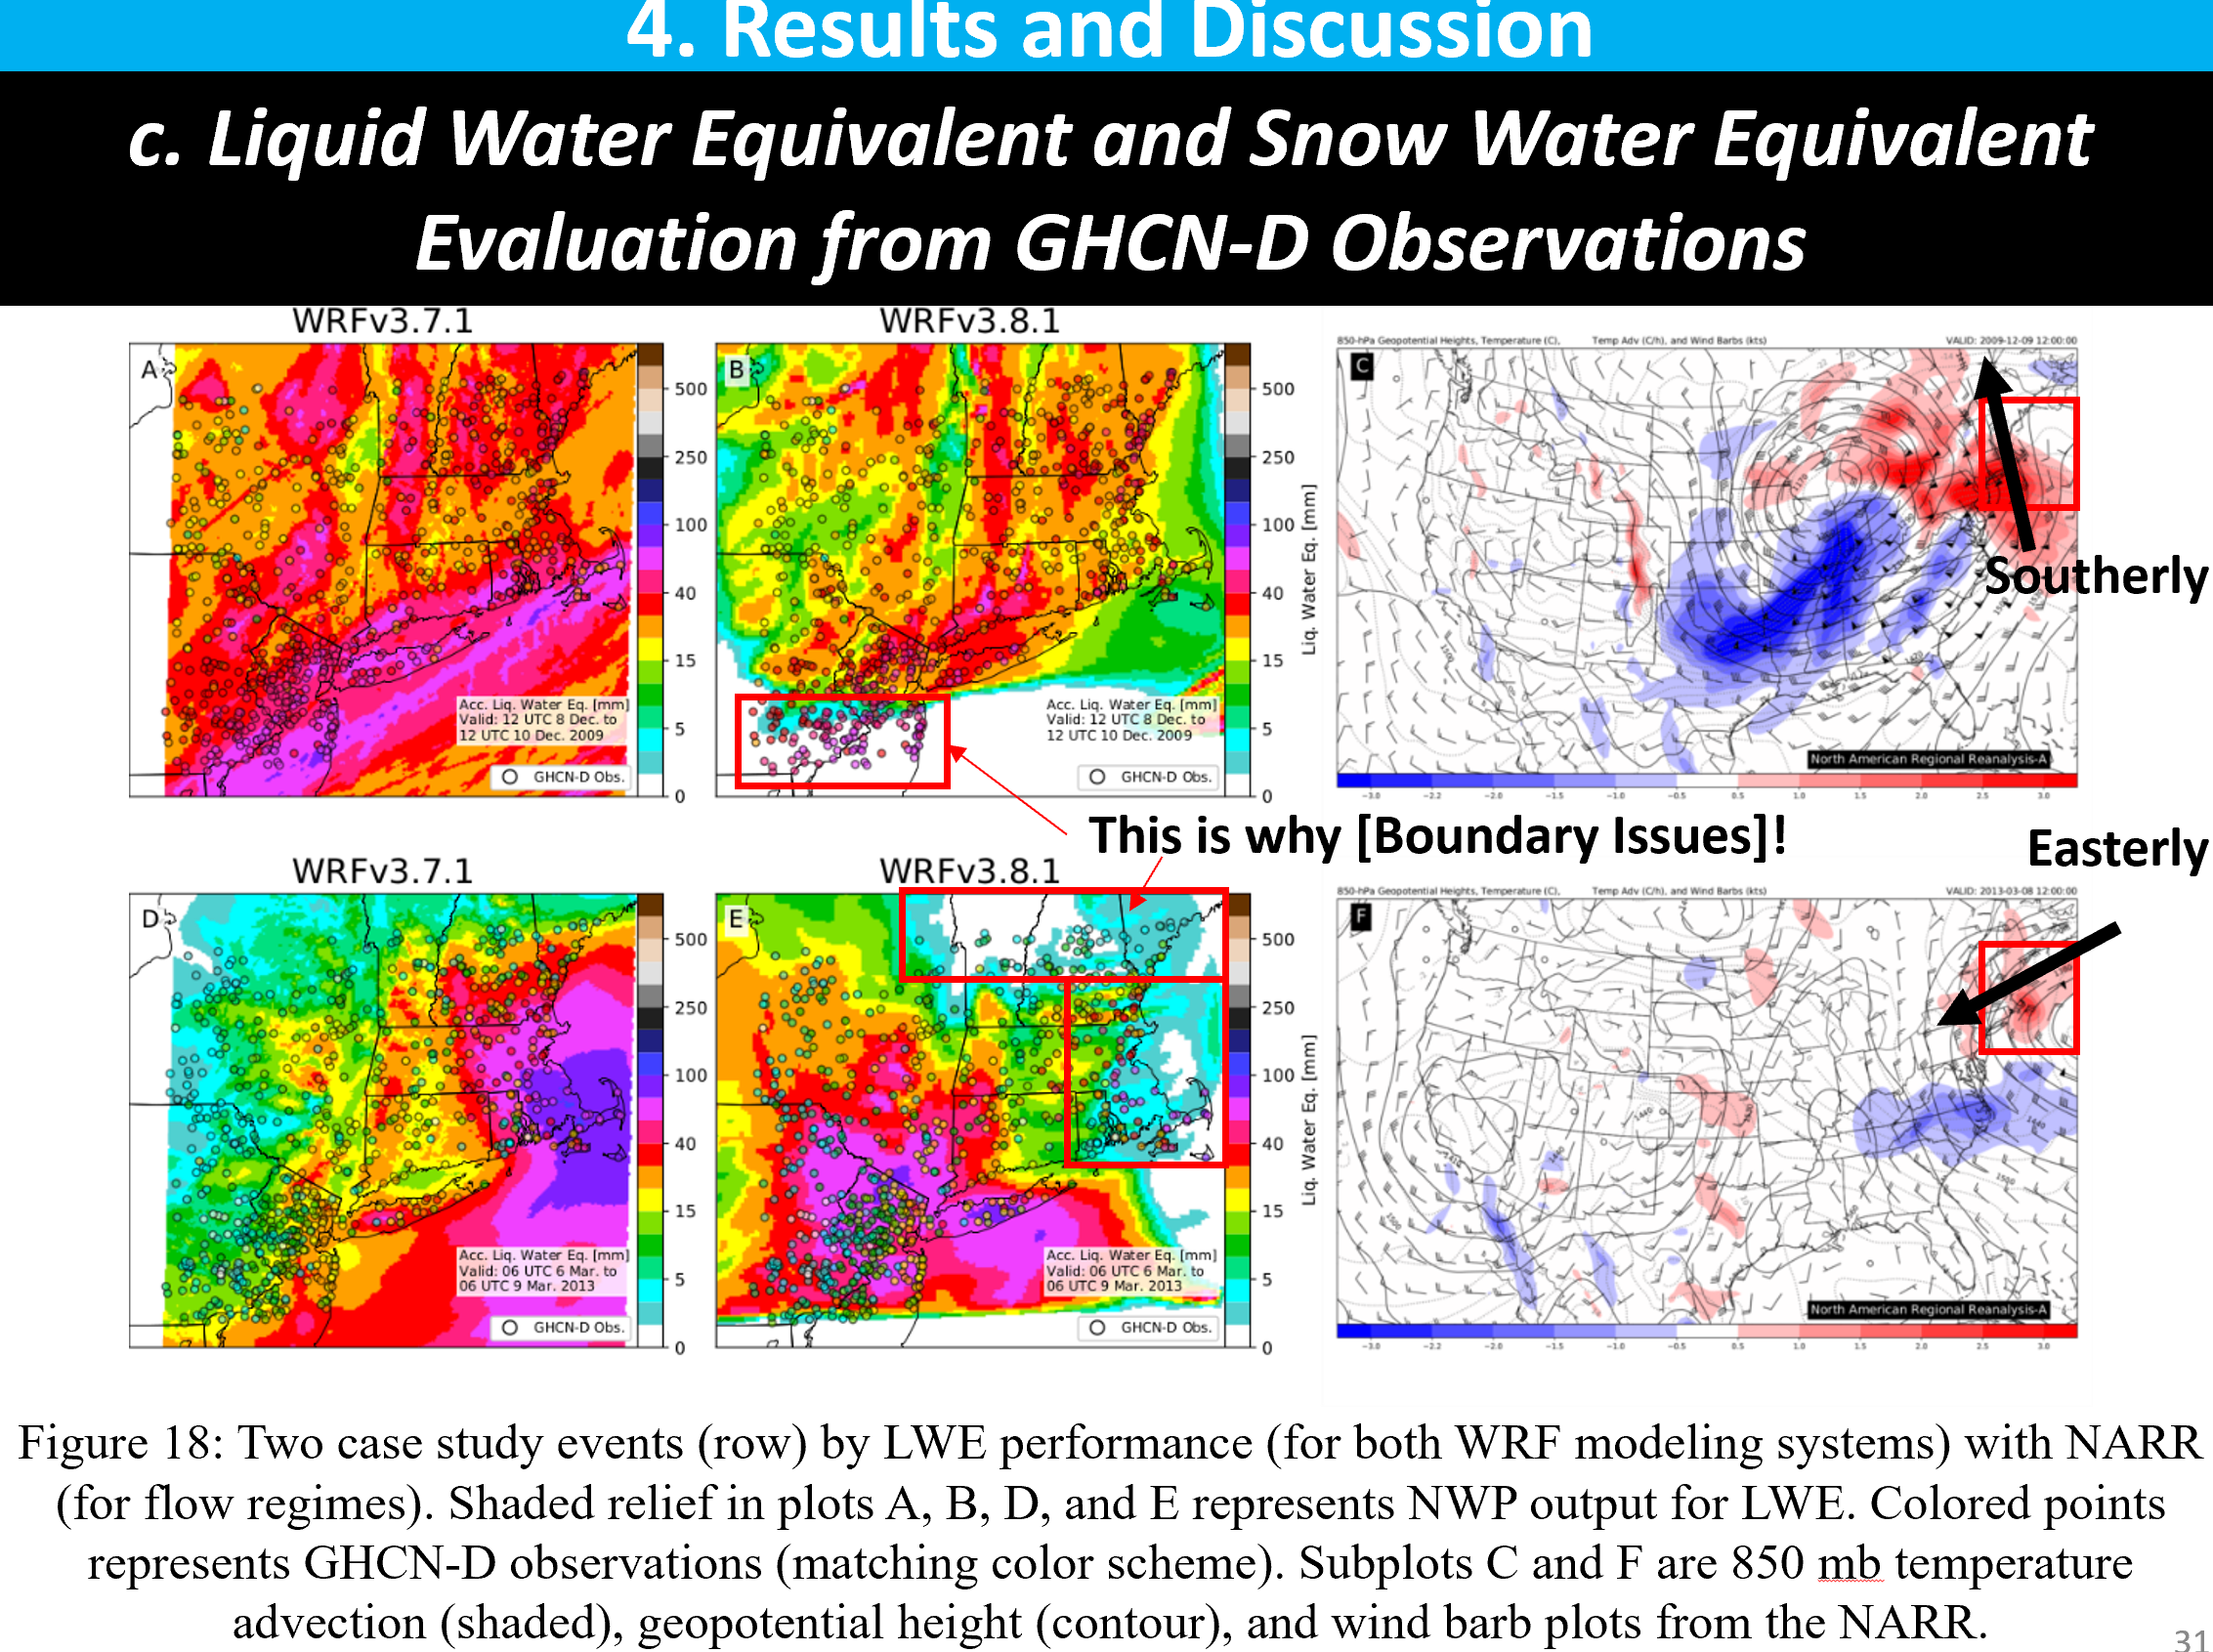
There are differences between 78' and 05', but I don't have time to describe them at the moment (I'm working, but I'm so distracted!). I ran semi-high resolution (d1 = 12km. d2 = 4km) WRF simulations for both events and both evaluated pretty/reasonably well:
-
The ICON has a pretty fine (approximated) resolution for a global model. From https://www.dwd.de/EN/research/weatherforecasting/num_modelling/01_num_weather_prediction_modells/icon_description.html: "the global ICON grid has 2,949,120 triangles, corresponding to an average area of 173 km² and thus to an effective mesh size of about 13 km." Small scale spatial/temporal errors magnify quite significantly past 84 hours... Look at the NAM as an example. Would you trust it past hour 84?
-
This is a good question. I conducted some evaluations on reanalysis and analysis data (consider it the initialization hour) for multiple modeling systems including the ERA5 (reanalysis system of the ECMWF), FNL (reanalysis system of the GFS), GFS (0.5x0.5deg), HRRR (3km), NAM (12km), and RAP (13km). All modeling systems predominately underestimate wind speed and overestimate wind gust. Keep in mind, I ran the evaluations for the entire month at 00, 06, 12, 18 UTC, therefore, the results are skewed in favor of fair weather conditions. I actually posted the results online for a couple reasons - When I ran evaluations operationally (WRF w/NAM and GFS forecast data), results were similar... Obviously, expect more erratic error past forecast hour 6.
-
Glad to share my thoughts and I absolutely agree! I still can't believe Pivotal requires payment for a product that hasn't been tested (Kuchera).
-
Ah! I didn't know that field was available. You are correct. In the GrADS Data Server, there is a field called, 'asnowsfc.' It looks like the field is obtained via HRRR's LSM (I'll double check later to be sure). You can view it here if you'd like: https://github.com/wrf-model/WRF/blob/master/phys/module_sf_ruclsm.F The AMS submission is here: https://journals.ametsoc.org/view/journals/wefo/25/1/2009waf2222311_1.xml?rskey=LFzwBc&result=4 To summarize its procedure, the weighted snow density (stepwise multiple linear regression) is first calculated by determining the (frozen) densities of snow, graupel, and sleet (as a function of the lowest atmospheric layer's temperature). The weighted snow density is then used to calculate SLR = (density of water) / (density of frozen). Snowfall is then the product of SWE * SLR. This is all done diagnostically using calls to the mp routine. It's also used to calculate new snowfall accumulation for its snow depth field. It's a pretty good algorithm actually compared to climatology and Kuchera. Taking the weighted contribution of different hydrometeors is a great method to avoid inflation of snowfall due to mixing. It's a huge advantage to have it calculated between modeled time steps too. Other modeling systems can incorporate this variable if the RUC LSM is applied.
-
11.5'' of very light snowfall in Wrentham, MA (measured at 11:30 AM). I'm teleworking in MA for now.
-
Let's try to clear up some things I've read: 1) Almost all NWP models (if not, all) provide liquid water equivalent (LWE) and snow water equivalent (SWE) as diagnostic fields. When I write, "diagnostic fields" this implies that both variables, LWE and SWE, is calculated within the model itself between modeled time steps. Modeled time steps are ~27 seconds depending upon the horizontal resolution of a modeling system. Regardless, the calculation of LWE is straightforward. LWE = the liquid accumulation of all hydrometeor contributions diagnosed by a modeling system The calculation of SWE varies by microphysics (mp) scheme. I'll give one example - one (there are many) mp scheme calculates fall rates for snow, pristine ice (I consider this sleet), graupel, and rain. Thus, fall rates can be converted into hydrometeor accumulation by multiplying by the modeled time step. Once the time stepped accumulation is obtained, SWE becomes - SWE = snow + sleet... Just keep in mind that SWE is often used to determine snowfall for all private/public websites. Since almost all mp schemes includes sleet within their routines, SWE may be overdone due to sleet contamination (for regions that mix). Thankfully, most websites make this clear. 2) mp schemes are reliable at fine grid scales (<3km). They can consider heat, moisture, and momentum flux caused by convection without parametrization. At larger scales (>12km), convective parameterizations are required to essentially approximate convictive processes. Although I'm not entirely sure, I believe cumulus parameterization from global models, to regional models, then to mesoscale models caused some forecasting problems for today's event. Just a thought! 3) The land surface model (LSM) of all NWP models includes a snow depth field that does determine new snowfall. Unfortunately, the algorithm is usually two-dimensional and the output isn't archived in gridded output... Delta snow depth (often provided by websites) will almost always be underdone since it includes gauge losses between the ground-snow and air-snow interface. 4) Anyone ever notice ''6-hour averaged Precip Rate" which is plotted by precipitation type? Think about it, does that make sense? No... They take an accumulated product (over the past 6 hours in this case), and use an instantaneous field to plot precipitation intensity by precipitation type. This is why you occasionally see snowfall along a cold front. Precipitation fell before the front passed (likely in a warm sector), BUT they use atmospheric fields post-frontal passage to determine precipitation type. This is no bueno imo. 5) Last one. Since snowfall is post-processed by most websites (excluding the ICON - I'd like to know what 'true SLR' means), keep in mind that they need instantaneous fields to calculate snow ratios. If output is provided every 6 hours, imagine how inaccurate snowfall may be when using instantaneous fields. I said this once, I'll say it again: Websites need to be descriptive. Especially as it relates to snowfall products.
-
It'll look very similar to the 12km NAM which it uses for its ic/bc's. I wouldn't trust it for any precipitation field anyways. The domain is too small. If winds are strong and perpendicular to any of its (4) boundaries, it'll muck up QPF along said boundary... I ran into this problem when I first ran WRF (ARW core) simulations. You can subtly see this flaw on the far southern boundary of their domain (within 5 grid points of their boundary). The stronger the winds, the worse it gets. I added a picture of a couple good examples of this artifact when winds are stronger, and more perpendicular, to a modeling system's domain.
-
I don't remember exactly the process, but several researches wrote a paper about the thermodynamic/microphysical evolution of that mega band: https://journals.ametsoc.org/view/journals/mwre/143/10/mwr-d-14-00407.1.xml?rskey=cIrzIt&result=2
-
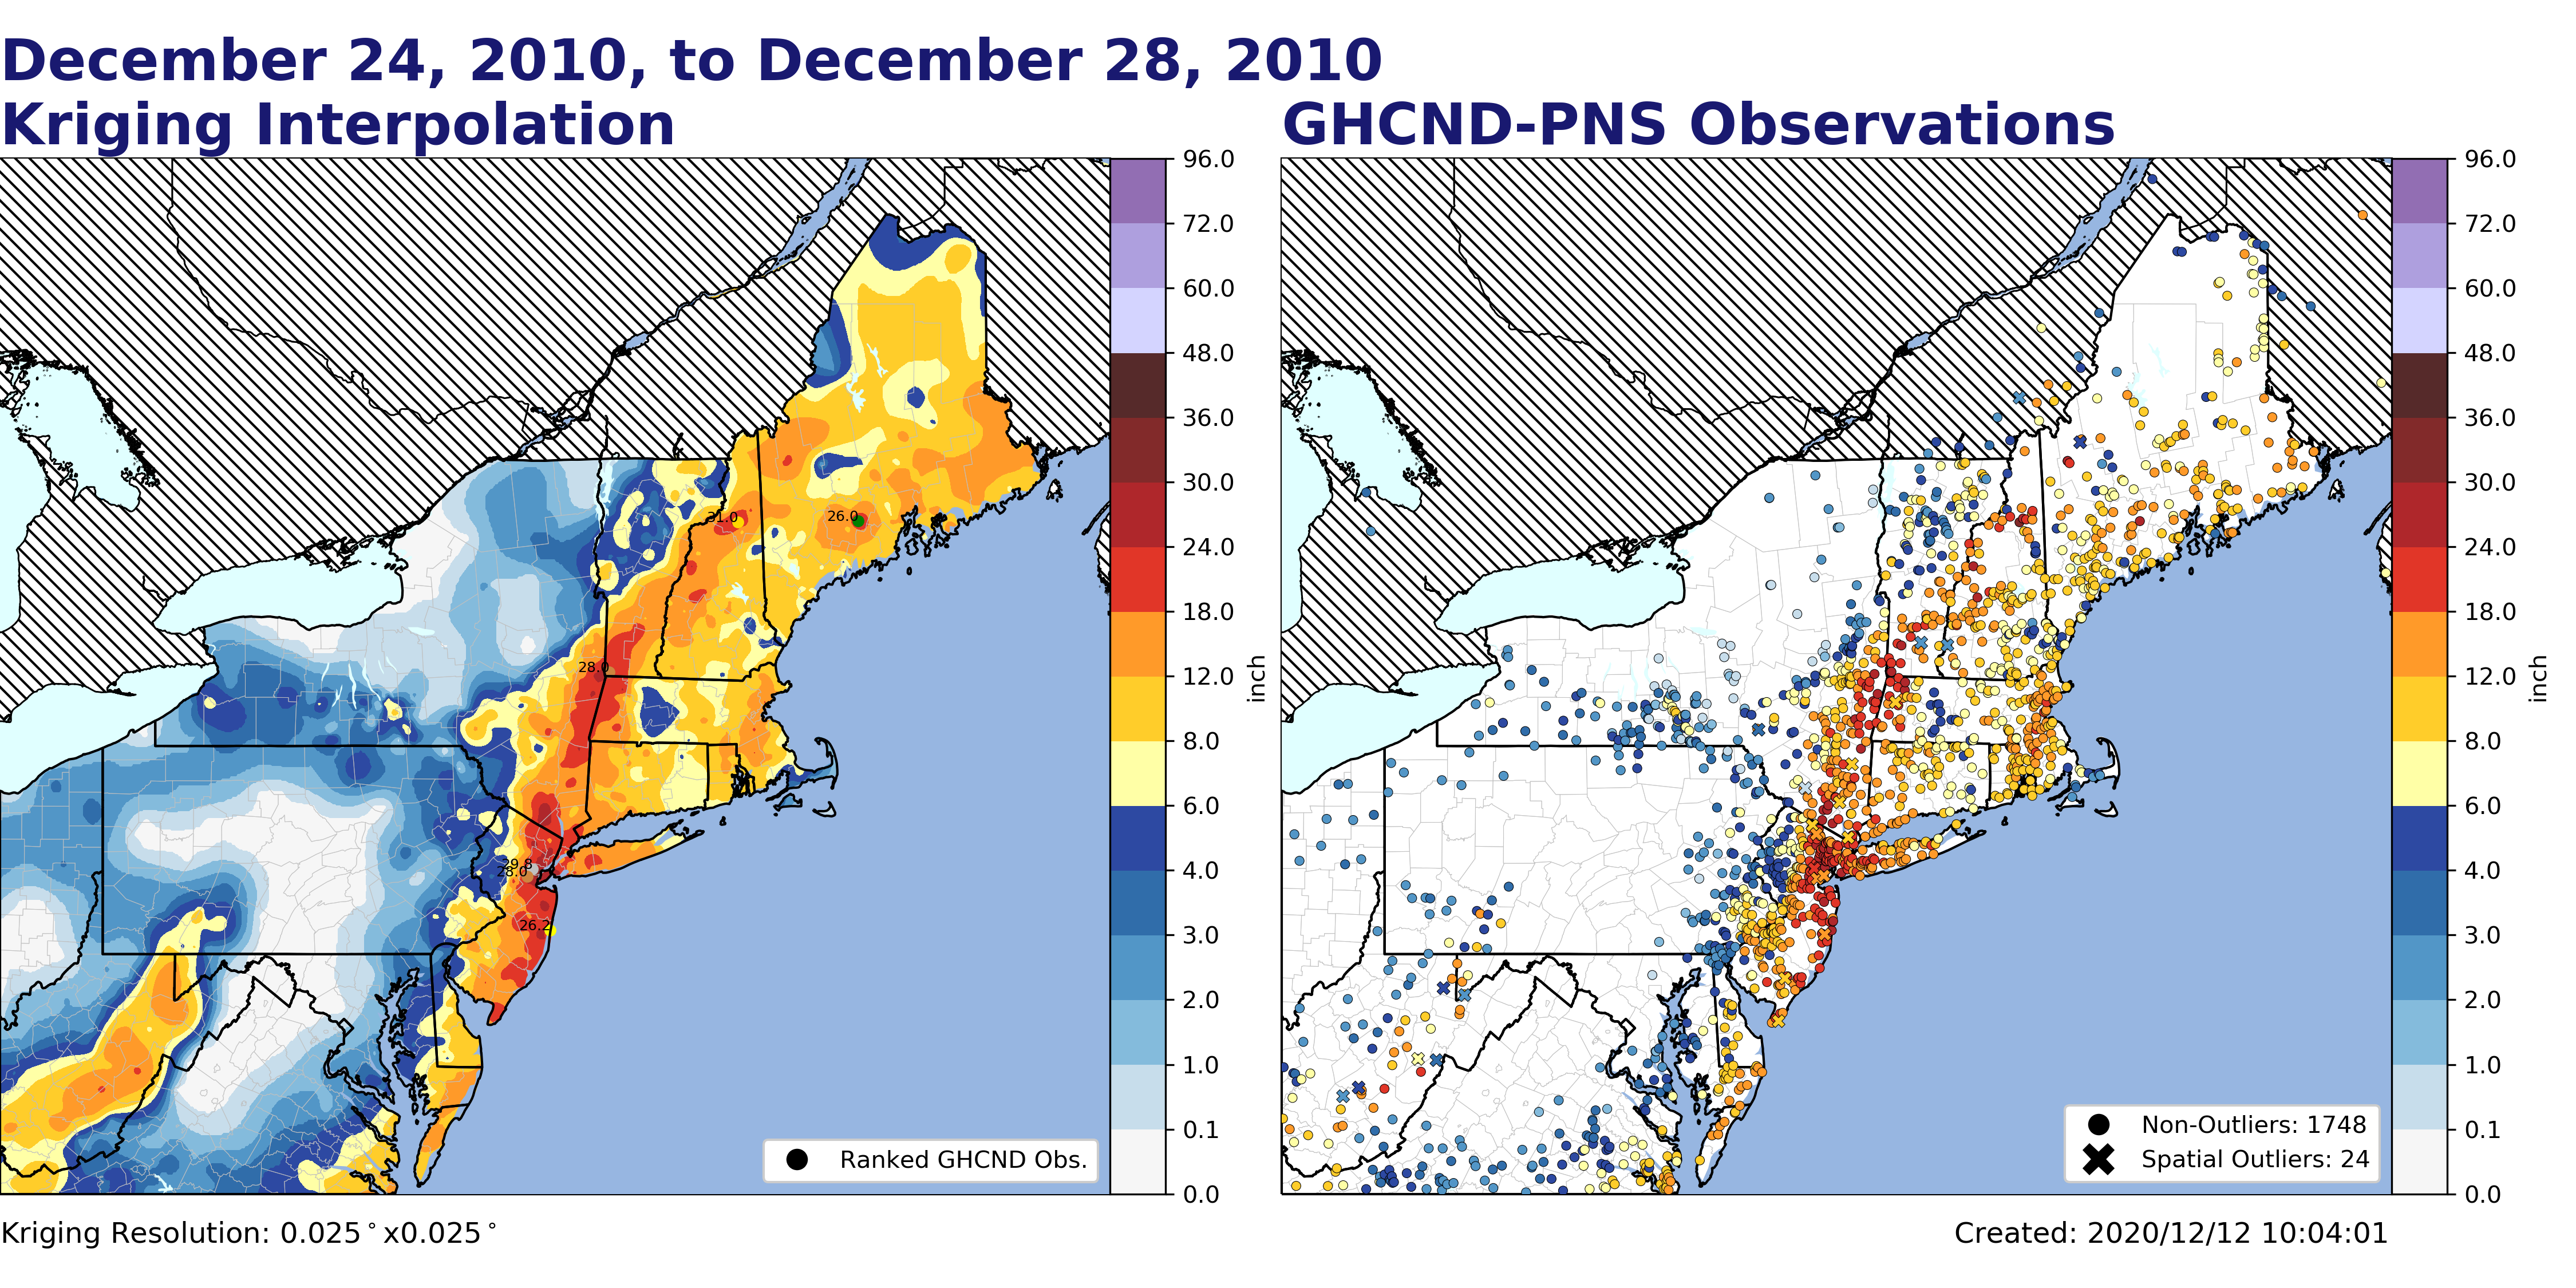
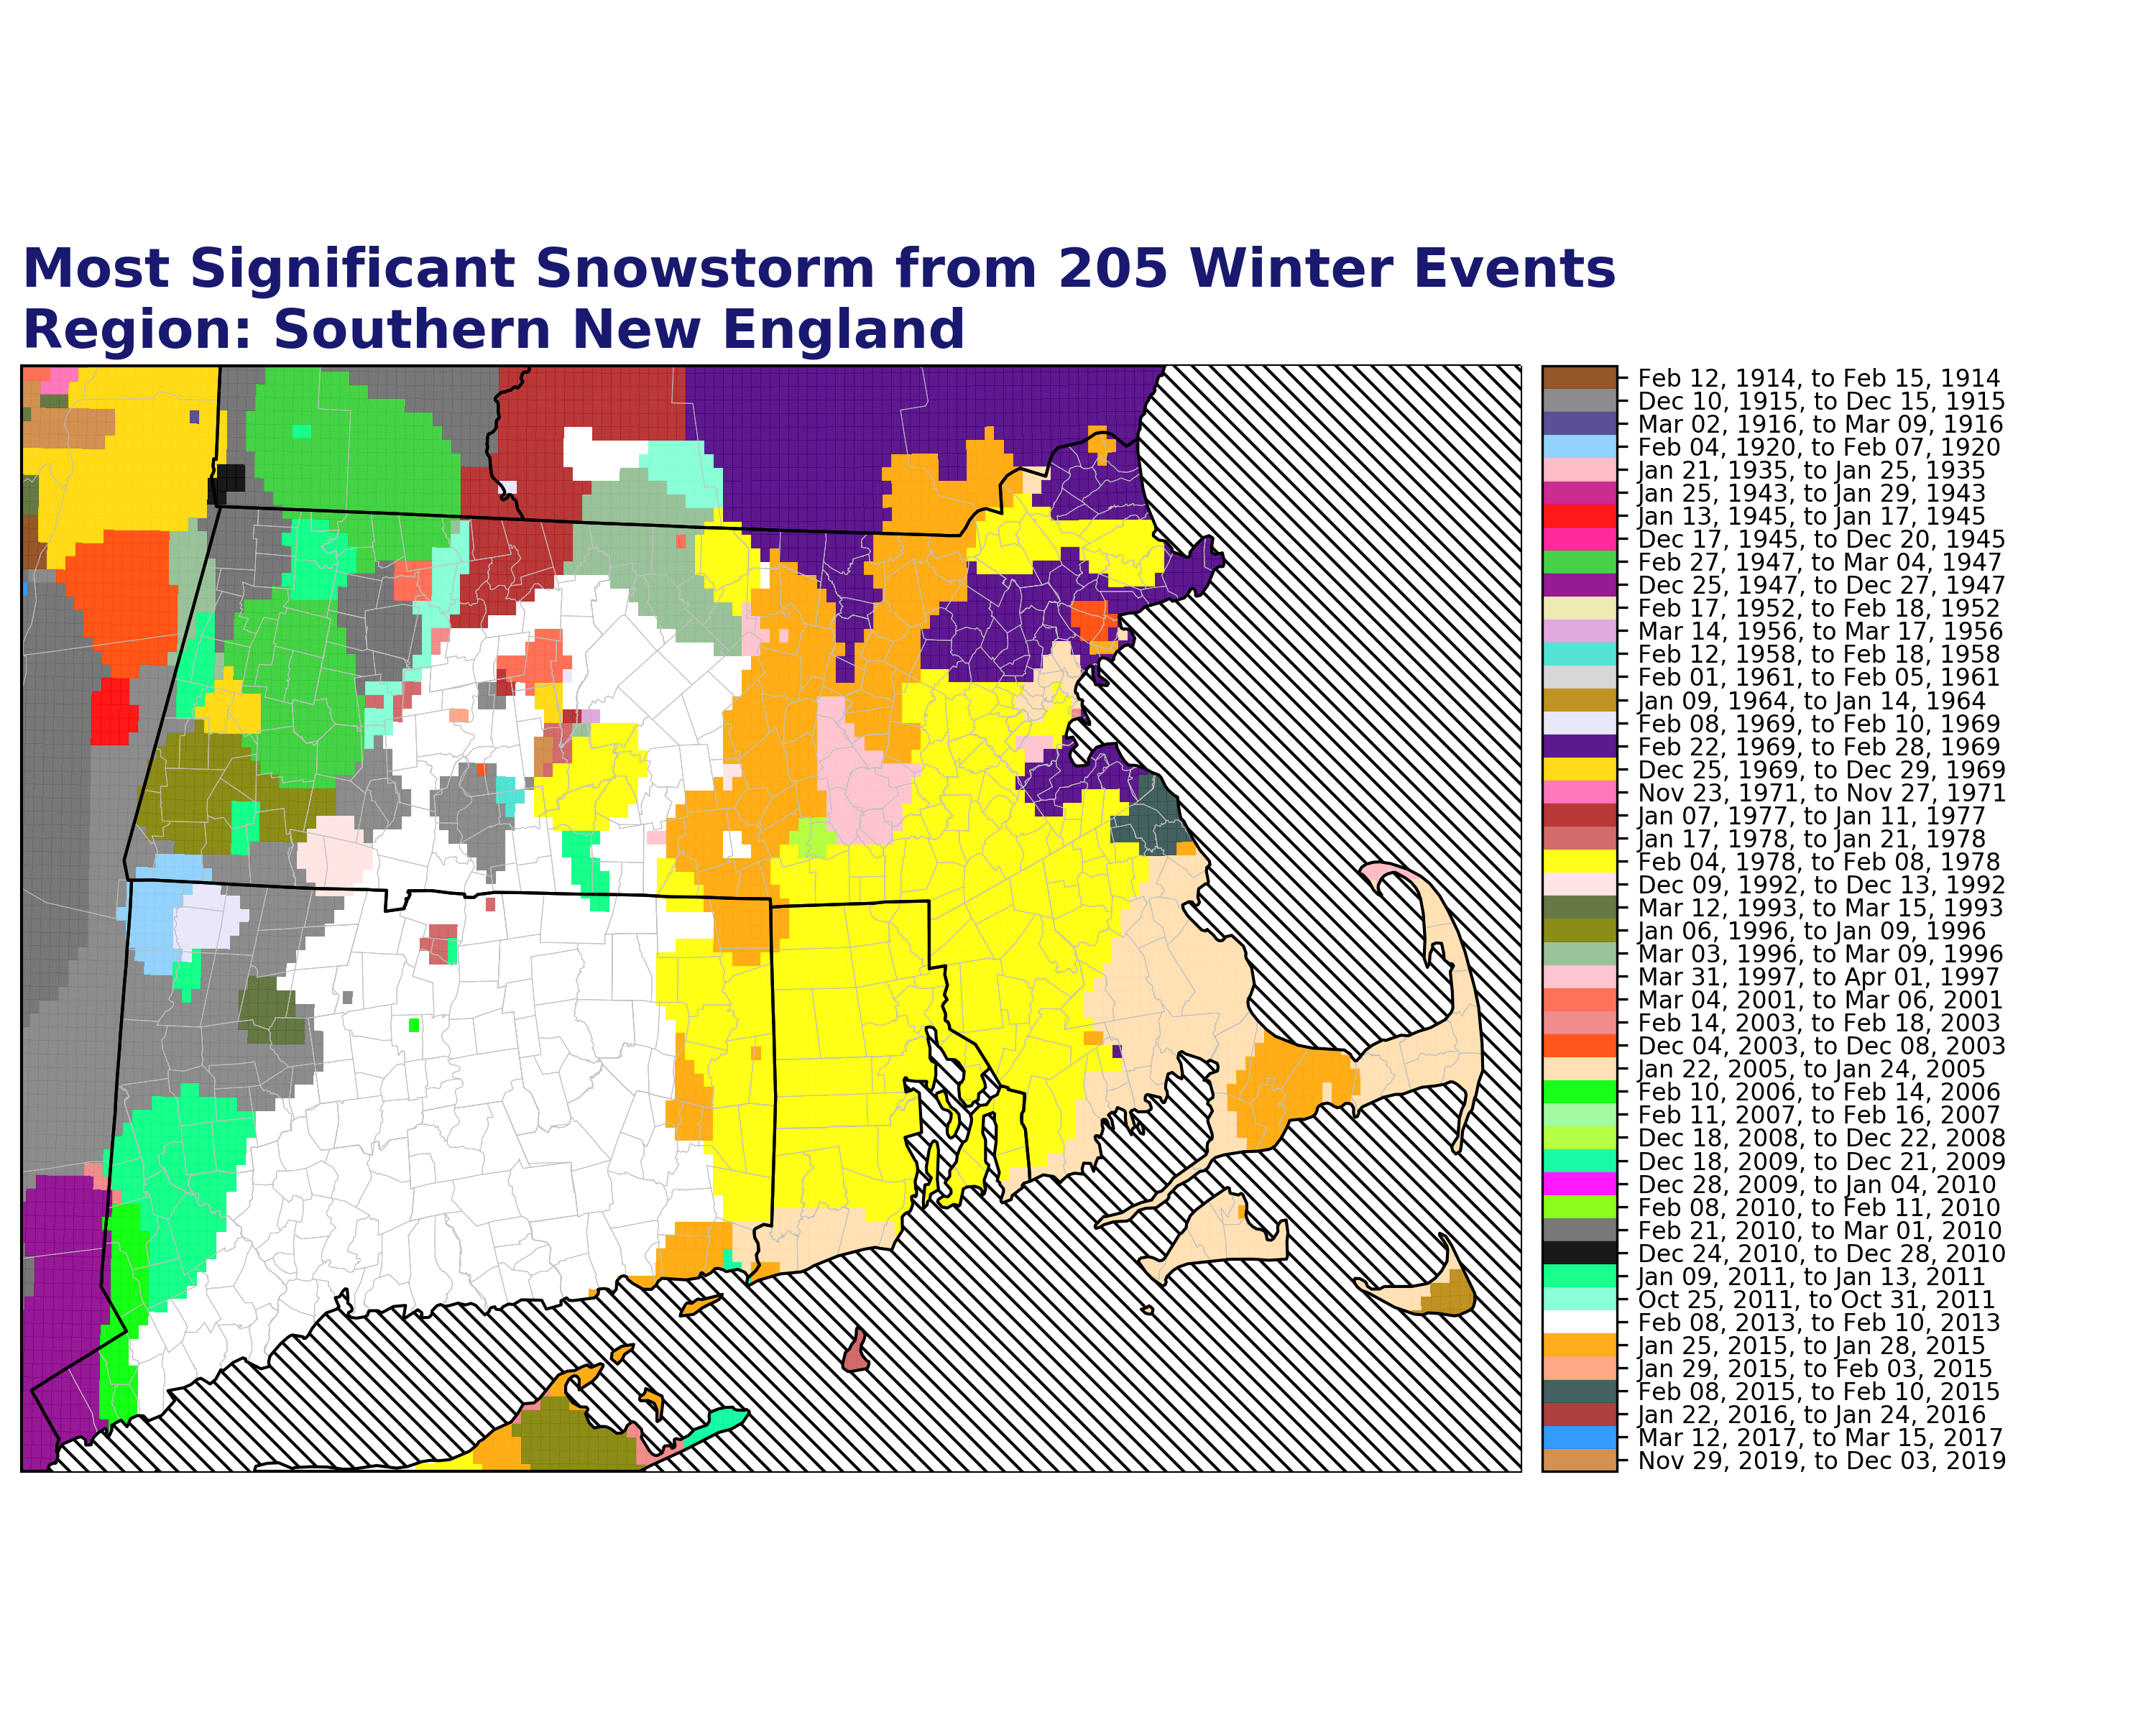
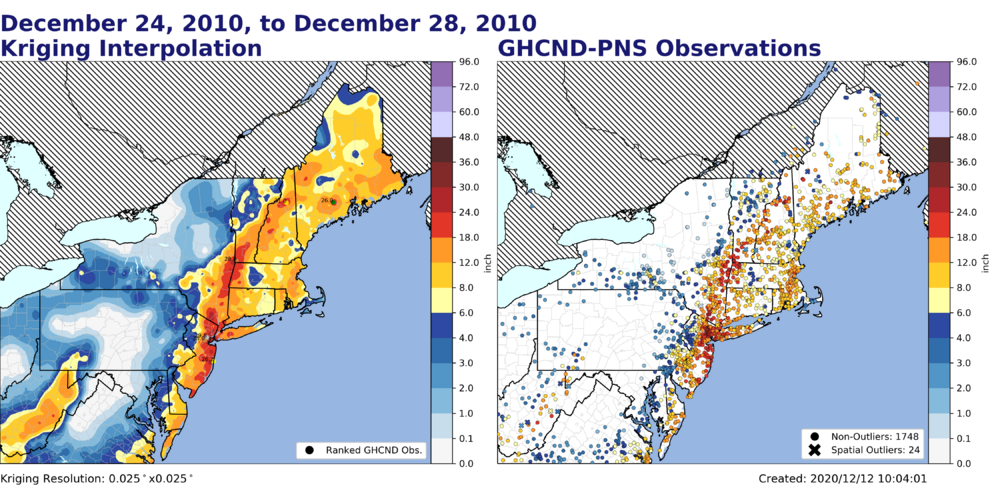
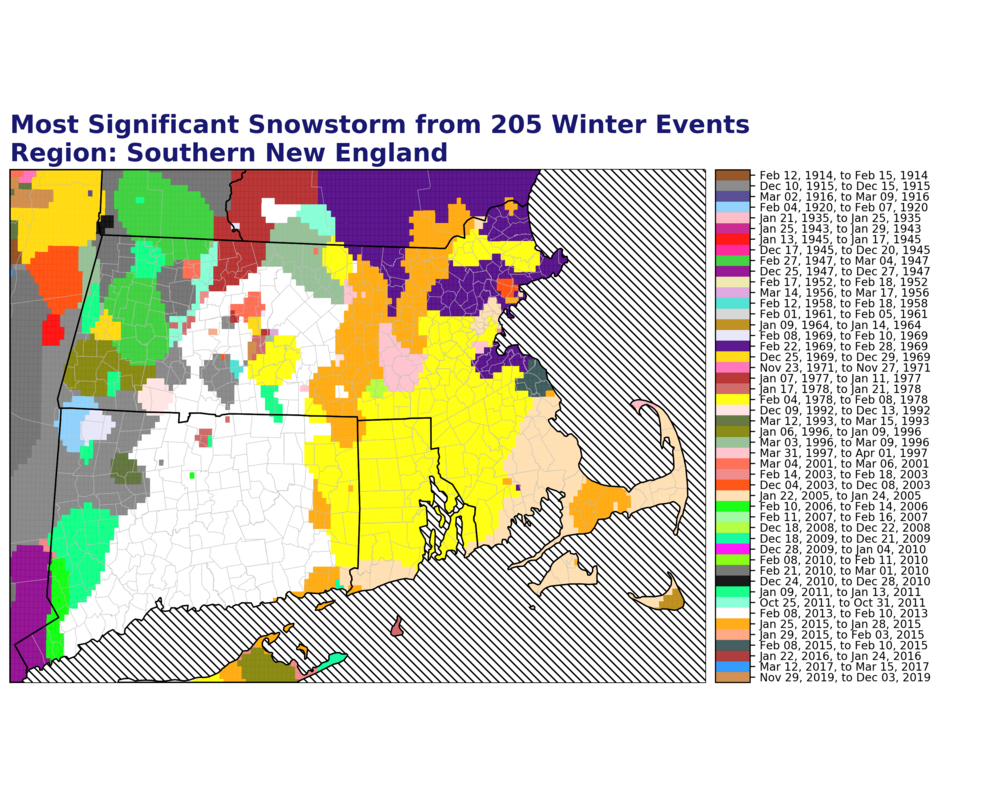
You mean for the Boxing Day blizzard? I attached an interpolation that I created using GHCND/PNS observations. I created 200 other interpolations/images. I'm sure I'm not the only one who did this... Right? Anywho, I created the plots to determine the most significant snowfall event since 1900 on a grid. If you're looking for snowfall maps since 2008, I'd recommend checking out the NSA product: https://www.nohrsc.noaa.gov/snowfall/ They create their plots using in-situ observations, SLR climatology, Stage IV precipitation analysis (from Radar), and other gridded analysis products: https://www.weather.gov/media/notification/tins/tin15-05bigrsc_snowfall_aaa.pdf
-
I added more events. When I'm running/waiting on simulations at work, I run atmospheric simulations that'd interest me. I also added radar mosaics superimposed with observations and Atlantic basin, tropical disturbance storm tracks (by year) from ~1850 to 2020. This is done solely out of personal interest. I definitely used audio from several members of this forum, if you'd like me to remove the audio from the videos, let me know :). Otherwise, if you'd like me to run an additional simulation, give me a date and I'll consider initializing one. These are strictly deterministic (WRFv4.2) simulations with additional post-processing (unified post-processor/a Python library) utilities. Despite using analysis data (not forecasted data for the IC/BC's!!!), some events performed surprisingly poor ('Nemo' and the 'Boston Debacle' snowstorm to name a few). All events were evaluated at the surface and aloft when applicable. If you'd like to view the script I use to plot or run the simulations, let me know. I automated most tasks (.py>>.ncl>>.csh).
-
Hey guys, I've been running WRFv4.2.2 simulations for funzies lately. I configured WRFv4.2.2 w/1 parent (12km) and one nested (4km) domain. My nested domain (4km) encompasses all of New York City. If you'd like to view graphics of some notorious weather events, click the links below ... Keep in mind, my focal point is New England so some of these events weren't that interesting for the New York City area. Winter Storms (testing extratropical namelist options) Jan, 2005 - https://www.youtube.com/watch?v=Pe_75ngrc8Y&li st=PL7uw9vTkqQwp1s4oh6TRd8qm6StglCkUd&index=5 Apr, 1997 - https://www.youtube.com/watch?v=uEmCRmaUPtY&list=PL7uw9vTkqQwp1s4oh6TRd8qm6StglCkUd&index=2 Jan, 1996 - https://www.youtube.com/watch?v=J4o1Nz9wdBw&t=136s Mar, 1993 - https://www.youtube.com/watch?v=kyZWFzDvS4k&list=PL7uw9vTkqQwp1s4oh6TRd8qm6StglCkUd&index=3 Feb, 1978 - https://www.youtube.com/watch?v=sm3ipMFoHoE&list=PL7uw9vTkqQwp1s4oh6TRd8qm6StglCkUd Tropical Events (testing tropical namelist options) Irene - https://www.youtube.com/watch?v=GNhYYvrQrPc&t=252s Bob - https://www.youtube.com/watch?v=FmbhsaFaC4k&list=PL7uw9vTkqQwrX5nzMSy4qFQbTqU9WCqha&index=1 Gloria - https://www.youtube.com/watch?v=60wBgKfBrHg&list=PL7uw9vTkqQwrX5nzMSy4qFQbTqU9WCqha&index=3 Freezing Rain Events (testing p-type algorithm): Dec, 2008 - https://www.youtube.com/watch?v=sNkfVaudVZ8&list=PL7uw9vTkqQwrfqeW1diEdDmR_wGGvgjZC
-
I ran additional simulations if anyone's curious. All of them are at the following paths. Winter Storms (testing extratropical namelist options) Jan, 2005 - https://www.youtube.com/watch?v=Pe_75ngrc8Y&li st=PL7uw9vTkqQwp1s4oh6TRd8qm6StglCkUd&index=5 Apr, 1997 - https://www.youtube.com/watch?v=uEmCRmaUPtY&list=PL7uw9vTkqQwp1s4oh6TRd8qm6StglCkUd&index=2 Jan, 1996 - https://www.youtube.com/watch?v=J4o1Nz9wdBw&t=136s Mar, 1993 - https://www.youtube.com/watch?v=kyZWFzDvS4k&list=PL7uw9vTkqQwp1s4oh6TRd8qm6StglCkUd&index=3 Feb, 1978 - https://www.youtube.com/watch?v=sm3ipMFoHoE&list=PL7uw9vTkqQwp1s4oh6TRd8qm6StglCkUd Tropical Events (testing tropical namelist options) Irene - https://www.youtube.com/watch?v=GNhYYvrQrPc&t=252s Bob - https://www.youtube.com/watch?v=FmbhsaFaC4k&list=PL7uw9vTkqQwrX5nzMSy4qFQbTqU9WCqha&index=1 Gloria - https://www.youtube.com/watch?v=60wBgKfBrHg&list=PL7uw9vTkqQwrX5nzMSy4qFQbTqU9WCqha&index=3 Freezing Rain Events (testing p-type algorithm): Dec, 2008 - https://www.youtube.com/watch?v=sNkfVaudVZ8&list=PL7uw9vTkqQwrfqeW1diEdDmR_wGGvgjZC Does anyone have any suggestions for my next 10 simulations? I'm looking for unique events. I'd like to try Hurricane Carol (1954 - test the reliability of ERA20c prior to 1985) and the Blizzard of 2013 next. Dec. 9, 2005 is really interesting too. Before any recommendation(s), I can run simulations with reasonable accuracy from 1978+ (so far) w/ERA5 and ERA20c reanalysis data.
-
So about those armored millipedes/centipedes... Is there a way to get rid of or prevent them from entering my property? I'm finding them everywhere around my apartment. They creep me out. Something keeps eating my plants too . I had to move them inside.
-
Glad you guys enjoyed it! There were a couple things that stood out to me: 1) The visibility observations for the RI station near Providence... The station dropped to 1 mile visibility at ~1pm on Feb 6th, then down to ~0.1 miles visibility for ~12 hours afterwards lol. 2) Wind gust >70mph in Boston. This was plotted twice... These observations were taken +-5 minutes from the simulation time stamp. 3) Several hours of mix/rain from Providence to Boston. I don't believe this occurred. For the ERA20C dataset, I can run simulations from 1900 to the current day. Some datasets go back <1900, but they likely won't perform well. I plan on doing this weekly for different events in and outside of the US out of curiosity. We'll see how the older simulations pan out, but the 78' simulation evaluated relatively well.