MegaMike
-
Posts
440 -
Joined
-
Last visited
Content Type
Profiles
Blogs
Forums
American Weather
Media Demo
Store
Gallery
Everything posted by MegaMike
-
 In my quick opinion, the biggest differences spawn from: 1) Data assimilation methodology - better ic/bcs lead to more accurate forecasts. You really need to initialize the atmosphere as realistically as possible. I'm not only referring to met. forcing data (heat and moisture fields at the surface, beneath the surface, and aloft), but static data as well... Such as elevation, land cover, snow depth, ice cover, vegetation type, urban canopy, etc... This stage of initialization is different pending the agency. 2) Horizontal and vertical configuration of a modeling system (resolution). Finer resolution leads to better results short-term, but worsen, spatially, wrt time. Courser models don't perform well initially, but spatial error vs. time isn't as significant. Unfortunately, courser models struggle with fine-scale phenomenon such as moisture flux which significantly contributes to the development/decay of a disturbance. 3) Microphysics, cumulus, etc... parameterization options followed by other physics/dynamics options. Pending the resolution of a modeling system, these options can lead to sizable differences. There's an infinite amount of options an agency can create a modeling system with. All of these differences leads to incremental error (beneath the surface, at the surface, aloft, and between grid-cells in all dimensions - dxdydz) that develops into large scale discrepancies vs. time.
 -
If the JMA is correct for the NE USA, it's for the wrong reason. It's hard to trust a global modeling system that has an extremely course resolution... Based on TT's, the global JMA (the JMA has regional/local nests too!) looks like it has a resolution of ~1 degree, but according to < https://www.wis-jma.go.jp/cms/gsm/#:~:text=The Japan Meteorological Agency's Global,layers) on an operational basis. >, the JMA has a resolution of 0.1875 degrees (20km). If the resolution is 20km, and for whatever reason, Japan truncates their output to ~1 degree, I'd (try to) trust it a bit more. Until I know for sure, in my opinion, the JMA is as useful as the NOGAPS. It's better to trust a modeling system that's developed by a country on the same continent as you. Domains are set and configured to emphasize a particular region. US weather isn't so crucial to Japan (short-term) so they can afford to truncate it in order to optimize simulation runtime or allocate additional resources somewhere else (say, add a nested domain in Asia).
-
There's no way they have the ability to code that. I write/say this all the time, but they should mention exactly what they used to produce their plots. Snowfall typically doesn't come straight from a model so post-processing is usually necessary. Post-processing is solely reliant on the vendor/user so don't be surprised if you see discrepancies from vendor-to-vendor. Some questions that come to mind: 1) Which members did they use to calculate mean snowfall. 2) Which fields did they use to post-process snowfall using 10:1 ratios. Without looking at the GEFS' output, there are a couple ways they can get snowfall using the 10:1 algorithm -> 2.a) if ptype == snow, SF = LWE*10. 2.b) Use SWE output from an ensemble member then simply multiply it by 10. I'm sure there are other options too. 2.a wouldn't make sense to me. Determining ptype for global ensemble members would be a waste of resources. My guess is that they use different ensemble members (or SWE fields) to calculate their mean. Unfortunately, you'll never know unless you see their code.
-
It's been a splendid, little storm just north of Albany. About 4.5'' where I am (Latham) with fluctuating rates (currently). I don't expect more than additional inch here, but I'd agree that east of Albany will do best. Probably along the NY/MA border just east of the Taconic's if I had to guess.
-
That storm in Dec. 05' was the most impressive weather related event I've experienced (albeit, brief). I couldn't see ~100' in front of me for about an hour in Attleboro (with plenty of thundersnow). If I remember correctly, someone observed ~6-8'' of snow in 1 hour. I was a paper boy at the time and had to deliver papers that afternoon - My mother drove me along Read St. and she ended up knocking down someone's mailbox because of "the whiteout" I ran an analysis simulation (WRF) of that event using the ECMWF20c reanalysis dataset for ic/bcs. I also created a radar animation for that event too superimposed with observations.
-
Thanks, dude! There's an archive (If I remember correctly: https://www.ncei.noaa.gov/data/snowstorm-database/archive/) that contains snow event observations. In a nutshell, I wrote script to read each shapefile, populate the grid with '0' observations, create an interpolation, plot the highest snowfall observation within multiple grid boxes, then save the image. This was done iteratively so it wasn't too time consuming. I didn't notice some were out of order - can't win em' all, I guess. From here on out, I'm leaving the snowfall interpolations to you lol
-
Historic Lake Effect Event?! 11/17-11/21
MegaMike replied to BuffaloWeather's topic in Upstate New York/Pennsylvania
I think I might be 'out' on this one because of that decision... which I support. I'm only 4 hours away so it'll hurt a little bit. Some thoughts related to the discussion that I've seen in this thread: 1) I wouldn't trust the HRDPS on this one or for anything in the US - it's just a bit too close to the boundaries for my liking. That can cause some weird output along the outer edges of the modeling system. 2) I wouldn't trust the NAM12km on this either (or anything >3km). I mentioned this before, but you really need higher resolution models to capture moisture flux for LES. It's basically a topographically induced, semi-stationary thunderstorm. Would you trust QPF from courser models for any convective event? I hope not. Regardless, QPF is still a challenge for NWP for a number of reasons. 3) Use high-res ensembles for this one. I'd recommend using the High Resolution Ensemble Forecast system (HREF) for QPF. 4) Once the band forms, I'd lean towards the HRRR (only for init. +~6 hours) since I trust its data assimilation. 5) I expect crazy totals from this. I hope you guys live stream this! -
Historic Lake Effect Event?! 11/17-11/21
MegaMike replied to BuffaloWeather's topic in Upstate New York/Pennsylvania
Oh, I know . I lived in the Providence area which kinda' sucked too. I'm in Latham if I had to be exact. Just by the airport. Any recommendations on what to do? I'm still exploring the area. Originally, I'm from MA, but I've lived in RI, CT, VT, NY, and NC over the past 10 years. It's been a crazy ride! -
Historic Lake Effect Event?! 11/17-11/21
MegaMike replied to BuffaloWeather's topic in Upstate New York/Pennsylvania
I moved to Albany, NY recently. I'm very tempted to film/experience this event. Will definitely wait to decide until the mesoscale models are within range (to decide upon a location - more interest near the Buffalo area), but I can see why you're excited for this one. In my opinion, predicting the occurrence/severity of LES is easy: In a nutshell - big, beautiful LES = cold air associated with a trough (accurate/easy to predict) + long duration/flow along the lake(s) (accurate/easy to predict) + warm lake (easy to observe). Mesoscale models should do a reasonable job here since they perform better with moisture flux and they have a better handle on topographic features (coastline and elevation, for example). Global models will do ok, but you really want NWP with a high resolution to make your forecasts with this one. -
I wrote a while ago that I'd post 400+ snowfall interpolations (1900-2022). Well, here it is. I've been wanting to do this for a while (proof of concept and what not). The main reason: End the whole percentile debate (10th,20th,...,90th,100th). I think the results are fairly reasonable, but significantly depend on the accuracy and density of snowfall observations (which is why I cutoff northern Maine from the figures). My interpolation method changed pending the two factors. If I'm missing an event, let me know. Until then, see y'all in 5 months ! For transparency, I also posted 2 similar videos which included superimposed observations and technique for each event (I did this for the CONUS too, but truncated).
-
March 2022 Obs/Disc: In Like a Lamb, Out Like a Butterfly
MegaMike replied to 40/70 Benchmark's topic in New England
Interesting plot, but they should just keep it 2-dimensional. No need to create a TIN using snowfall, then contour the TIN using snowfall Normally, TIN's are just created using topographic data and shaded by satellite imagery of landcover. -
March 12 Rain to…more rain? Maybe some snow
MegaMike replied to HoarfrostHubb's topic in New England
This happened to the 3km NAM several years ago. If I remember correctly, this is a dynamical issue (different from convective feedback)- The flow is moving too fast for the fine resolution model to resolve. Toss the 3km NAM... The 12/32km NAM looks fine. -
March 2022 Obs/Disc: In Like a Lamb, Out Like a Butterfly
MegaMike replied to 40/70 Benchmark's topic in New England
I can do you one better . I'll bun myself - -
Winter storm for the 25th of February is imminent.
MegaMike replied to Typhoon Tip's topic in New England
I thought the same. NCEP can't afford data scientists to create better graphics lol. I got the image from here: https://mag.ncep.noaa.gov/model-guidance-model-area.php Snipping Tool FTW! -
Winter storm for the 25th of February is imminent.
MegaMike replied to Typhoon Tip's topic in New England
I actually prefer the RAP over the NAM. I conducted research on analysis data and found that the NAM tends to overestimate moisture related fields at initialization. I hate to self promote my videos, but here's the evaluation I conducted (February-2020) on numerous analysis/reanalysis datasets. If you scroll to the end of the video, note that the box and whisker plots are skewed to the right for moisture related fields (radiosonde plots). I imagine that these problems plague forecast simulations as well (for the NAM). -
Winter storm for the 25th of February is imminent.
MegaMike replied to Typhoon Tip's topic in New England
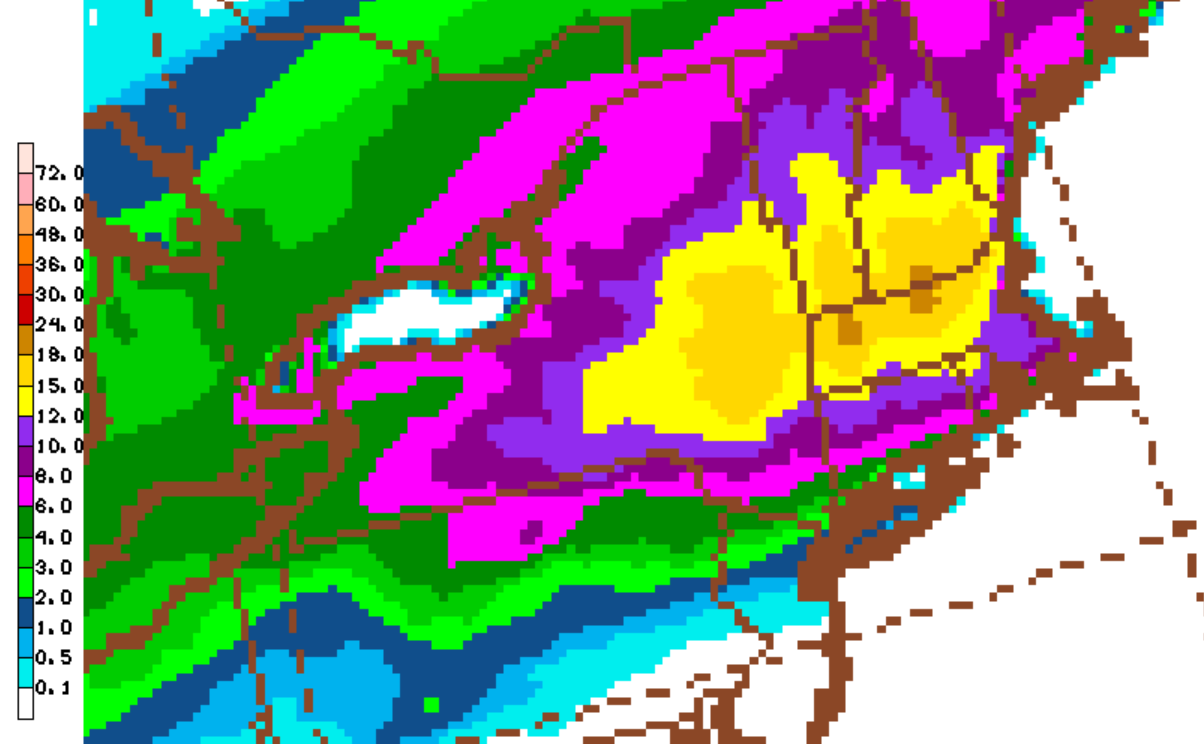
I'm letting my weenie out. Someone mentioned it a little while ago, but the RAP is quite bullish for snowfall accumulations. The image below is using its imbedded SLR algorithm (computed between PBL time-steps) which is a conditional function of hydrometeor type (ice densities for snow and sleet is calculated separately then weighted as one) and the lowest model layer's air temperature. I like the spatial extent of the accumulations, but the magnitude is too high imo...
-
Winter storm for the 25th of February is imminent.
MegaMike replied to Typhoon Tip's topic in New England
The HREF is a 10 member ensemble which includes the previous (most recent) two runs of the HiresW (2 different versions - I'm assuming it's the HRW-ARW and the HRW-ARW2), FV3, 3km NAM, and and HRRR (for the conus only). I think the model runs at 18UTC might be skewing the mean. If it warms up or stays consistent by its next cycle, then I'd agree with you. Correct me if I misread it: https://nomads.ncep.noaa.gov/txt_descriptions/HREF_doc.shtml -
How'd you get your video to fit perfectly with YouTube's x/y (16/9) dimensions? I'm still trying to figure it out. I briefly observed near whiteout conditions for several minutes despite being fringed by the best returns to my north. I wanted to film a time lapse at Blue Hills' observatory (tower), but decided against it... Bummer.
-
Ah, yes. Sounds like it's (snowfall) computed via NAM's (only available for the nested, 3km domain) microphysics scheme (Ferrier-Algo): TT has this product on their website (Ferrier SLR), so it must be available somewhere. If this is computed diagnostically, then this is the fourth model (that I'm aware of) that computes snowfall between PBL timesteps. RAP & HRRR: Weighted snow density wrt individual hydrometeors - https://github.com/wrf-model/WRF/blob/master/phys/module_sf_ruclsm.F. Most straightforward algorithm to understand - search for 'SNOWFALLAC.' Since it depends on temperature at the lowest atmospheric level, I think these products will tend to be overestimated if QPF is correct. NAM 3km: Looks like bulk snow density as a function of volume flux. https://github.com/wrf-model/WRF/blob/master/phys/module_mp_fer_hires.F - search for 'ASNOW' and 'ASNOWnew.' ICON: Can't tell for sure... Can't find its source code.
-
I'd like to know how they calculate snowfall via the GFS and NAM. I'm assuming it's a prognostic field since I can't find snowfall anywhere on the nomads server (GFS - all resolutions)... Only snow depth, categorical snow, snow water equivalent, and snow mixing ratio.
-
lol To be fair, public websites should know this and not post NAVGEM's graphics in the first place. They're confusing poor Georgy.
-
Yup! Just like what Tip wrote. You don't even have to look at the NAVGEM's specifications to realize it. It's so badly truncated just like the JMA. Theoretically, the NAVGEM should still perform well aloft, but it just always sucks. Not even worth my time to look up its configuration. The JMA has an excuse at least - a global model with the intent to 'feed' a regional/mesoscale model somewhere over Asia (:cough: Japan :end cough:). Think of the JMA as NCEP's 1 degree GFS. The purpose of global models is to initialize finer scale modeling systems. You can't run a regional or mesoscale model without updating its boundary conditions. Otherwise, you'll end up with a model that simply advects weather outside its domain.
-
If by "ice" you mean, freezing rain, then this isn't true. Remember that these prognostic fields summate snowfall by multiplying an instantaneous field (temperature, in Kuchera's case) with an accumulated field (snow water equivalent) which is usually a 1/3/6 hour interval. Just be weary of this: Post-processed algorithms are vulnerable to significant errors due to temporal inconsistencies. Also, for "snowfall," all NWP models produce a snow water equivalent field which includes the accumulated contributions of all frozen hydrometeors which is diagnosed explicitly by its applied microphysics scheme (resolves moisture and heat tendencies in the atmosphere). Typically (but not always), this includes snow and pristine ice (sleet). This is why you see "includes sleet" text when associated with some snowfall products (websites uses this swe variable to calculate snowfall). Regardless, swe (as it relates to NWP) doesn't include freezing rain (not a frozen hydrometeor) so it's already removed from the post-processed algorithm. If you're worried about taint, the RAP and HRRR produce a diagnostic snowfall field which calculates snowfall between modeled time steps. It calculates snow density by weighing the density of frozen hydrometeors individually. Hydrometeor density is a function of the temperature of the lowest temperature field (probably between 8 - 20 meters) - https://github.com/wrf-model/WRF/blob/master/phys/module_sf_ruclsm.F I'd rank snowfall products as follows: Long range >5 days: Nothing... NWP accuracy is poor. 10:1 ratios if you really, REALLY want a fix. Medium range: NBM - Snowfall is post-processed utilizing Cobb SLR's (and several other algorithms). Short range: RAP and HRRR diagnostic snowfall field... Maybe even the NBM... SREF utilized the Cobb algorithm, but man', SREF sucks.
-
OBS/DISCO - The Historic James Blizzard of 2022
MegaMike replied to TalcottWx's topic in New England
lol Right!? I noticed the leaf too. It came out of nowhere when everything should be off the trees and buried. The music (Rising Tide) makes it more dramatic. -
OBS/DISCO - The Historic James Blizzard of 2022
MegaMike replied to TalcottWx's topic in New England
Not so much in Wrentham, MA but I made a neat time-lapse out of it. We were always on the edge of the band that destroyed far SE MA. 18.0 inches was reported in Wrentham (I measured 14.5 - on average). Lots of blowing and drifting. Some drifts are >4 feet high.