
forkyfork
-
Posts
29,934 -
Joined
-
Last visited
Content Type
Profiles
Blogs
Forums
American Weather
Media Demo
Store
Gallery
Everything posted by forkyfork
-
not spirit but same difference
-
c'mon guys we need more barns
-
i just heard a cicada
-
you might be on to something. it took 5 years to get to this point though: https://www.mcall.com/news/local/mc-nws-spotted-lanternflies-missing-20211005-et63t7utlja5xj3hthvcu7l7wu-story.html Additionally, he said, some of the trees of heaven that were missed were found dead, possibly because spotted lanternflies ate them to death.
-
lanternfly shit is raining down from the trees. it's getting so disgusting
-
leaning toward more of a low coming north
-
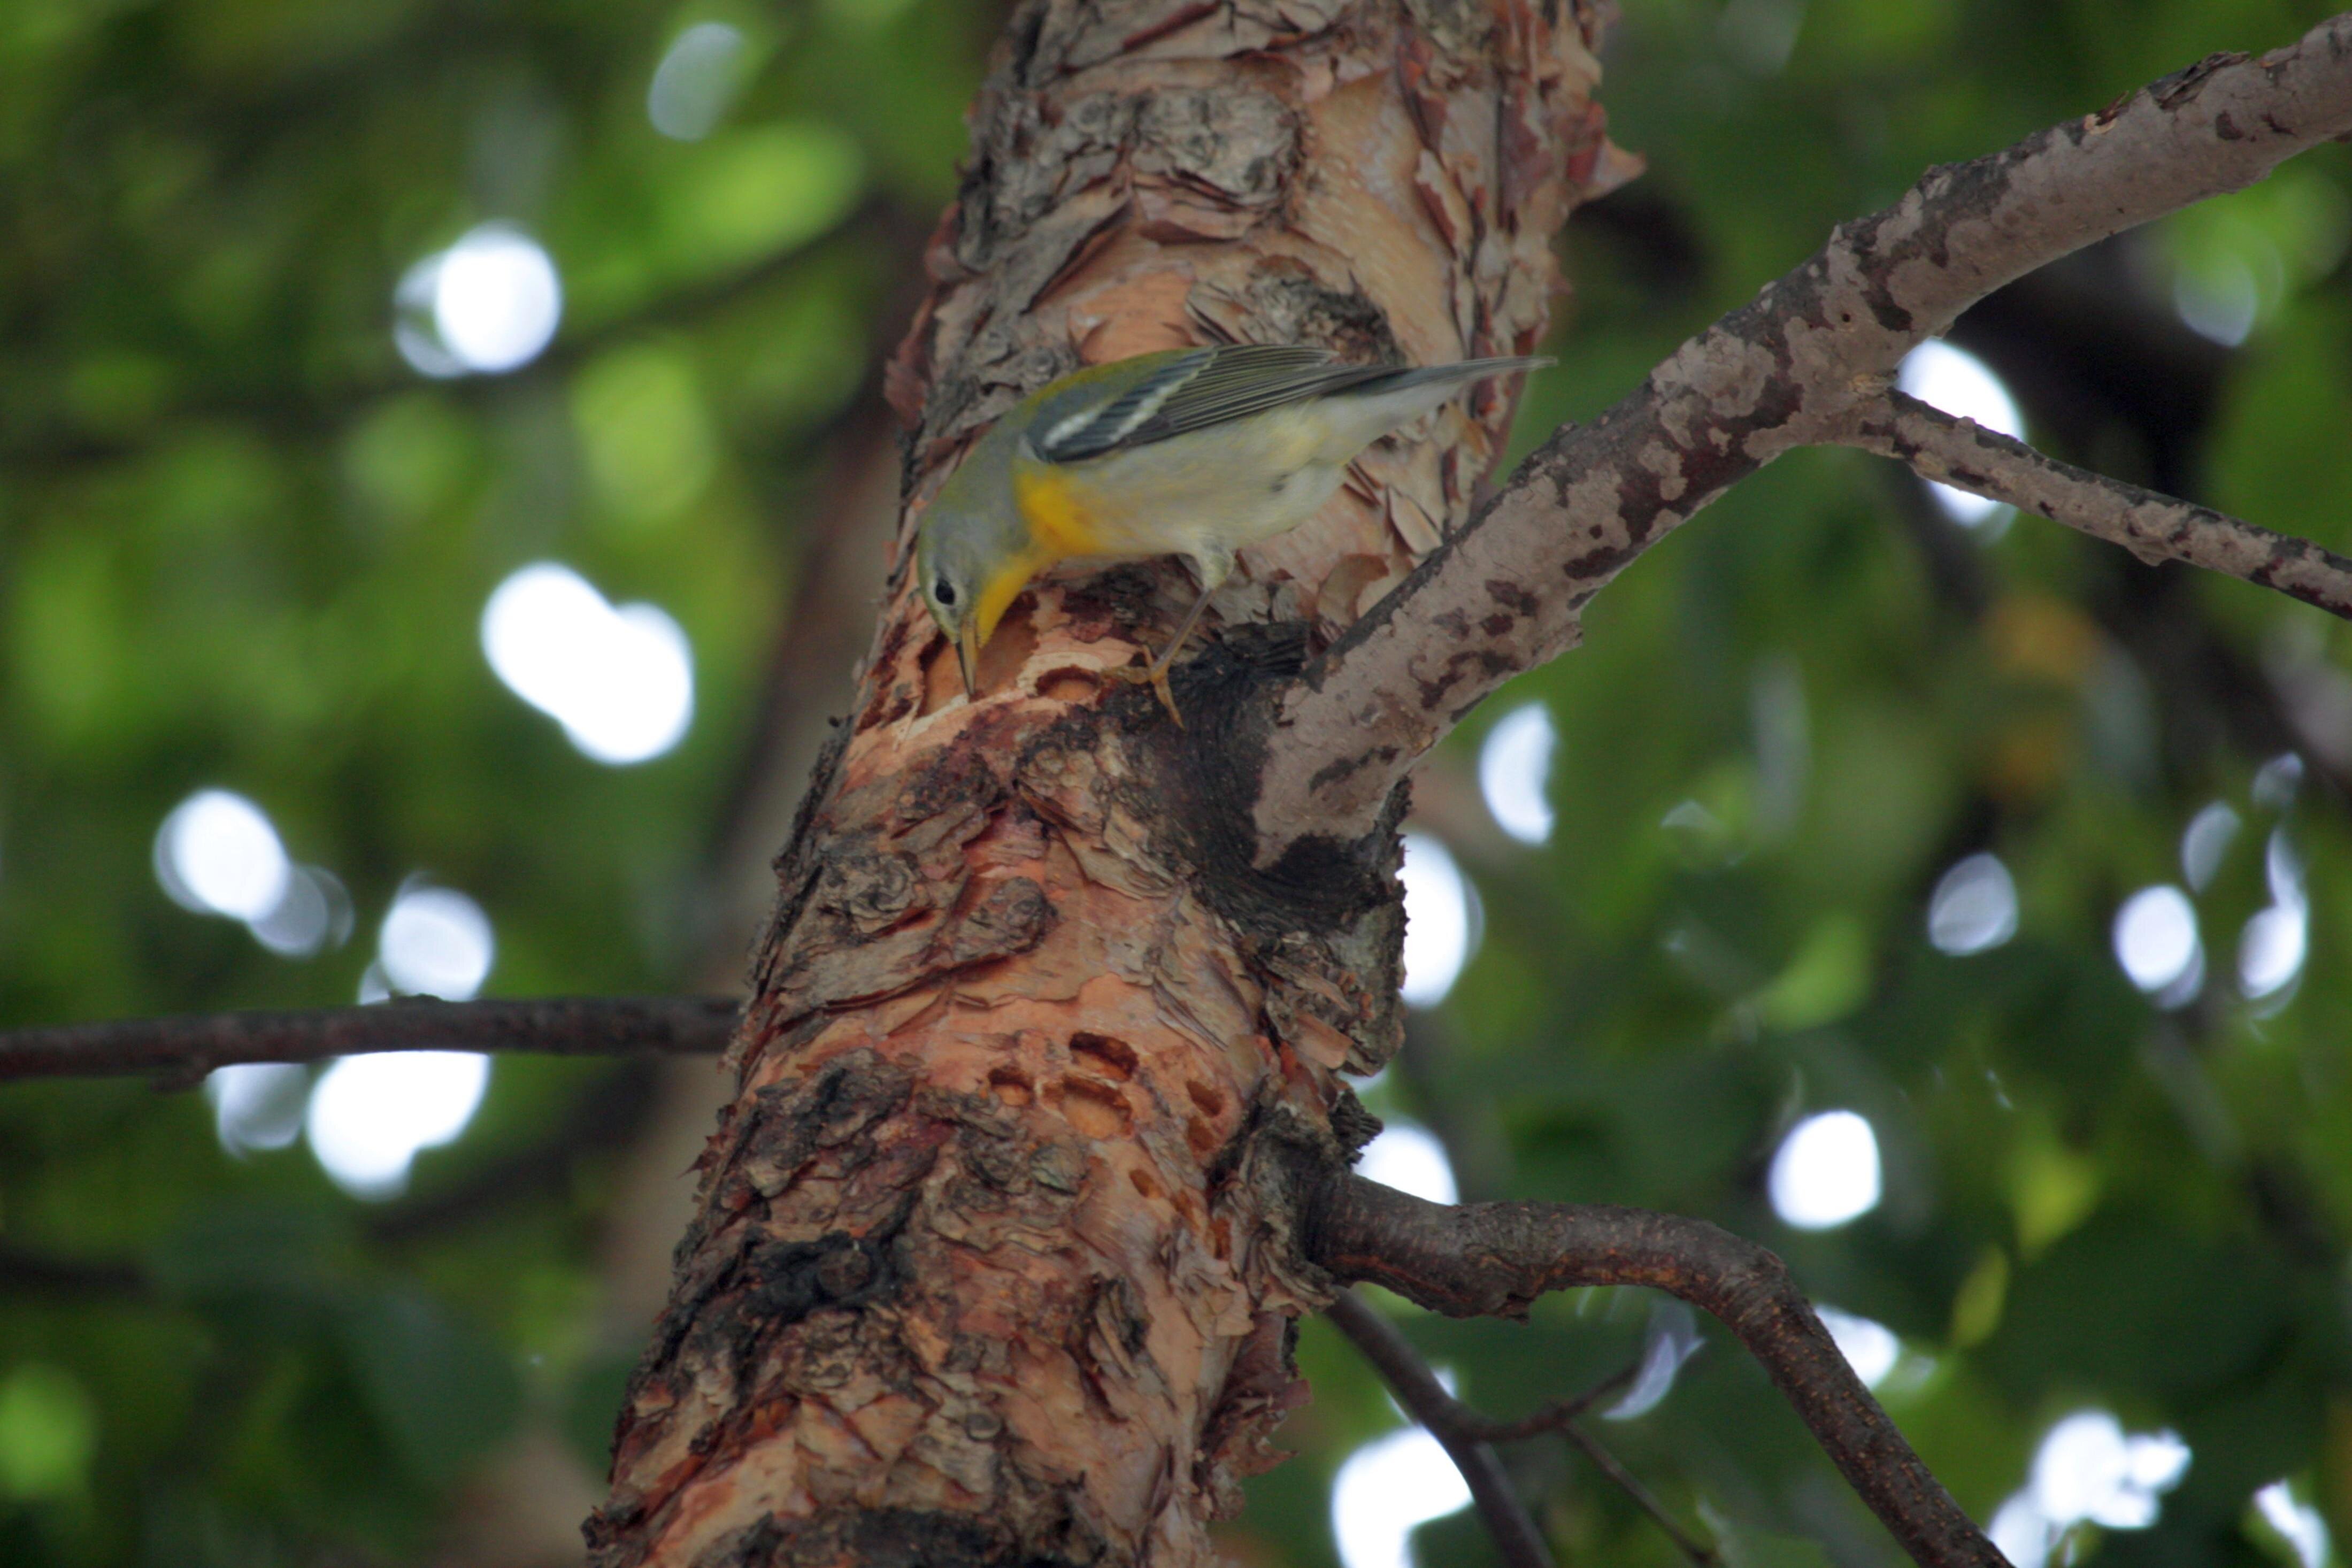
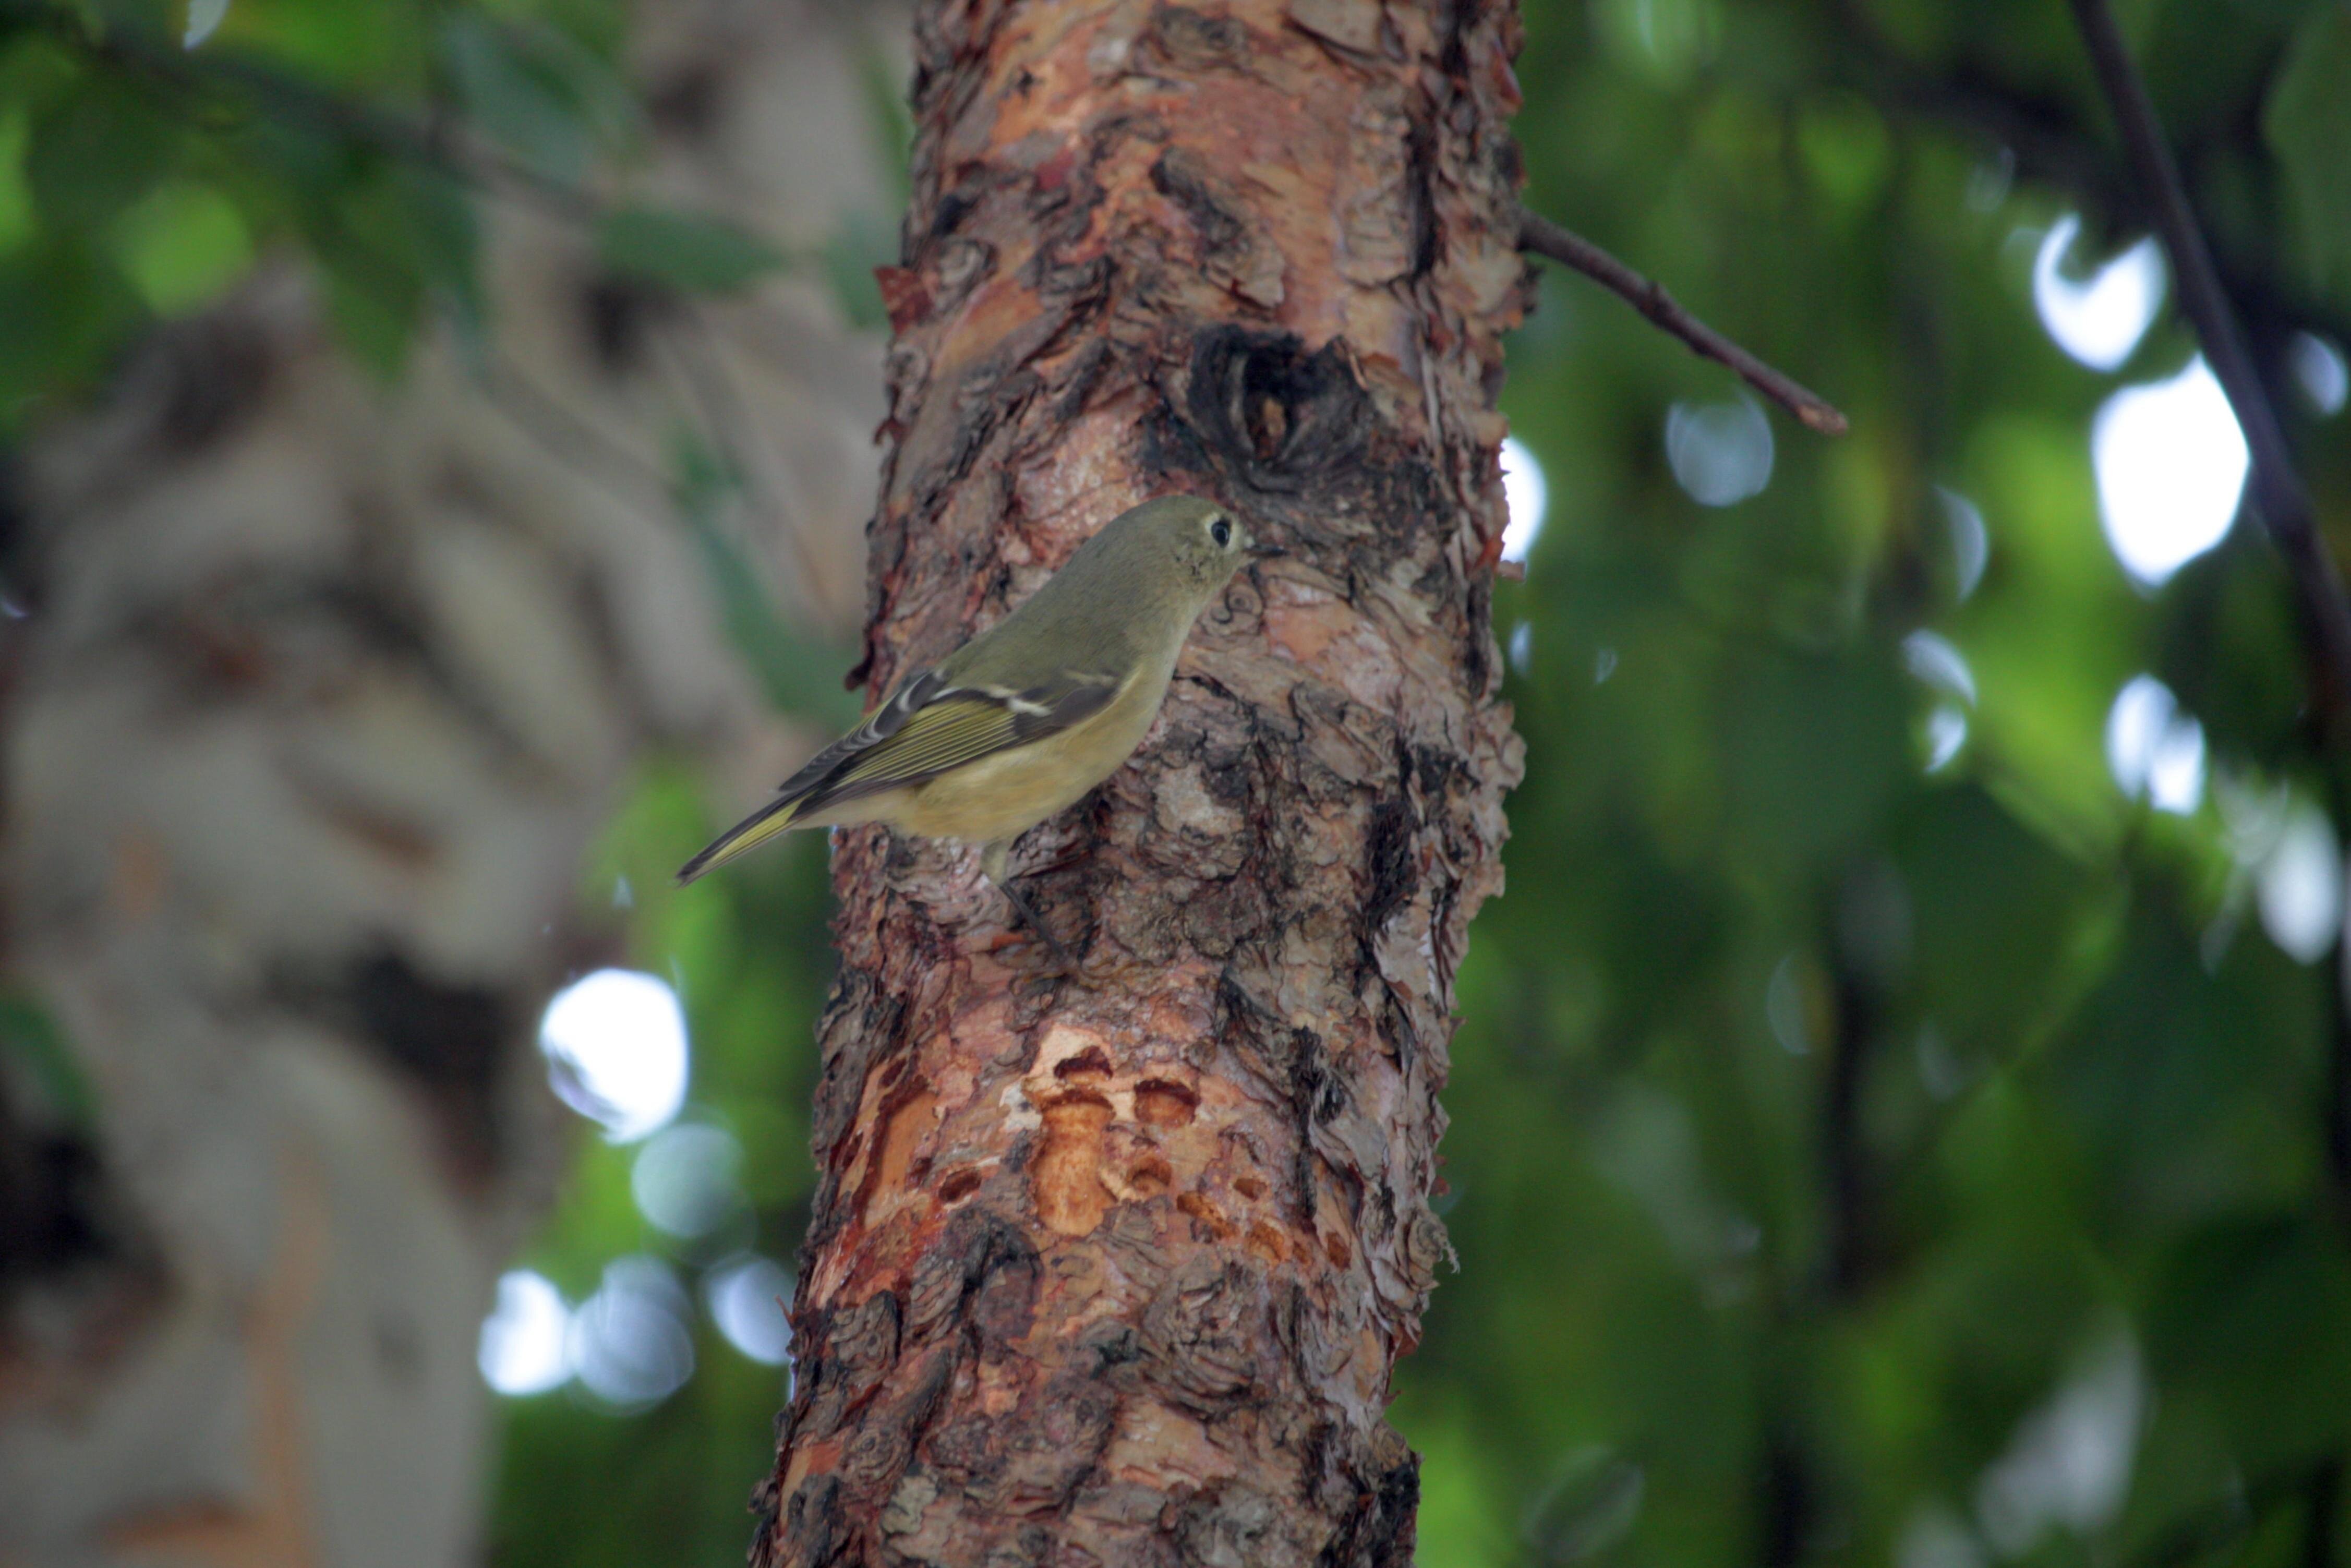
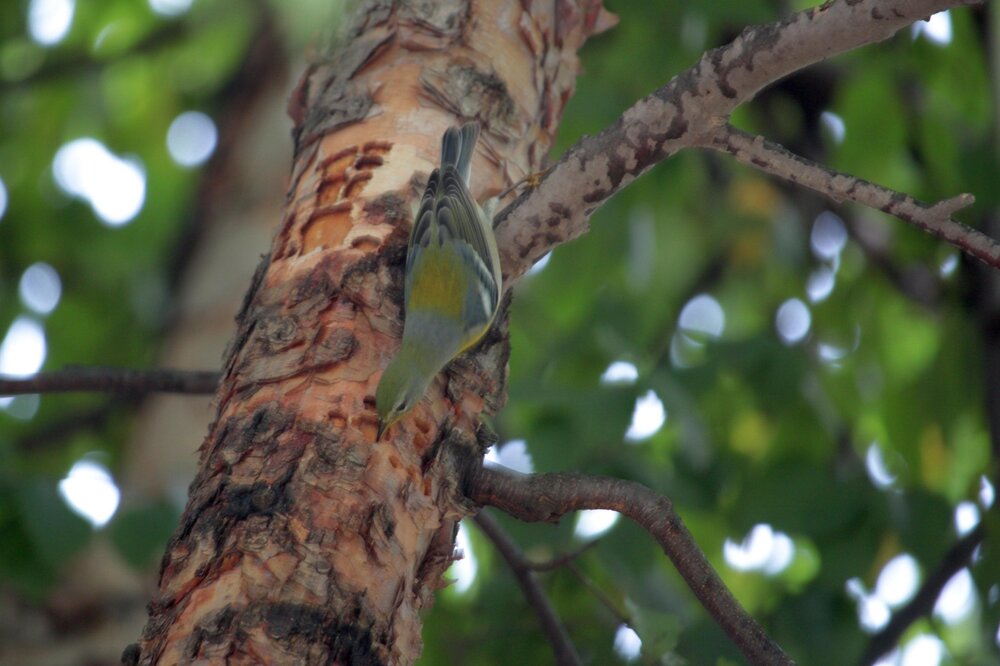
a northern parula and a ruby crowned kinglet feeding from sapsucker wells


-
cloudy, all the time
-
it's fog season
-
do you guys have any plans for when it's 60 degrees on christmas
-
i thought he did. still above normal
-

-
your normal low is 45
-
an old barn tucked into a hill
-
how about a winding road providing a focal point
-
has anyone taken a photo of the leaves reflecting in a still pond yet? or maybe something from a drone with a river breaking up the photo
-
all pictures of autumn trees look the same
-
what a thread
-
i wonder which counties in pa/ny will get a 40" storm this winter
-
a top ten warm september area wide is a colder month? lol
-
i appreciate you putting our brief cooldowns into context
-
august 1881. three days in mid august with lows in the 50s Sum 2528 2033 - - 6 280 0.86 0.0 Average 81.5 65.6 73.6 -2.5 - - - - Normal 83.3 68.9 76.1 - 1 345 4.56 0.0 1881-08-01 80 68 74.0 -3.5 0 9 0.00 0.0 1881-08-02 81 70 75.5 -1.9 0 11 0.00 0.0 1881-08-03 85 67 76.0 -1.3 0 11 0.00 0.0 1881-08-04 91 70 80.5 3.2 0 16 0.00 0.0 1881-08-05 91 75 83.0 5.8 0 18 0.07 0.0 1881-08-06 91 78 84.5 7.4 0 20 0.00 0.0 1881-08-07 79 67 73.0 -4.1 0 8 0.74 0.0 1881-08-08 78 61 69.5 -7.5 0 5 0.00 0.0 1881-08-09 81 62 71.5 -5.4 0 7 0.01 0.0 1881-08-10 86 64 75.0 -1.8 0 10 0.00 0.0 1881-08-11 78 59 68.5 -8.3 0 4 0.00 0.0 1881-08-12 81 62 71.5 -5.2 0 7 0.00 0.0 1881-08-13 96 70 83.0 6.4 0 18 0.00 0.0 1881-08-14 78 66 72.0 -4.5 0 7 0.00 0.0 1881-08-15 76 63 69.5 -6.9 0 5 0.00 0.0 1881-08-16 71 59 65.0 -11.3 0 0 0.00 0.0 1881-08-17 67 56 61.5 -14.7 3 0 0.01 0.0 1881-08-18 67 57 62.0 -14.1 3 0 0.00 0.0 1881-08-19 70 64 67.0 -9.0 0 2 0.02 0.0 1881-08-20 81 66 73.5 -2.3 0 9 0.00 0.0 1881-08-21 85 68 76.5 0.8 0 12 0.01 0.0 1881-08-22 81 67 74.0 -1.6 0 9 0.00 0.0 1881-08-23 83 61 72.0 -3.4 0 7 0.00 0.0 1881-08-24 82 63 72.5 -2.8 0 8 0.00 0.0 1881-08-25 76 65 70.5 -4.6 0 6 0.00 0.0 1881-08-26 82 63 72.5 -2.5 0 8 0.00 0.0 1881-08-27 78 66 72.0 -2.8 0 7 0.00 0.0 1881-08-28 89 67 78.0 3.4 0 13 0.00 0.0 1881-08-29 86 67 76.5 2.1 0 12 0.00 0.0 1881-08-30 85 70 77.5 3.3 0 13 0.00 0.0 1881-08-31 93 72 82.5 8.5 0 18 0.00 0.0
-
july 1874 at the park. more lows in the 60s than 70s Sum 2553 2047 - - 0 291 5.06 0.0 Average 82.4 66.0 74.2 -3.3 - - - - Normal 84.9 70.1 77.5 - 0 388 4.60 0.0 1874-07-01 83 62 72.5 -3.8 0 8 0.00 0.0 1874-07-02 80 68 74.0 -2.4 0 9 0.01 0.0 1874-07-03 76 61 68.5 -8.1 0 4 0.00 0.0 1874-07-04 76 58 67.0 -9.8 0 2 0.44 0.0 1874-07-05 70 62 66.0 -10.9 0 1 0.00 0.0 1874-07-06 80 61 70.5 -6.6 0 6 0.00 0.0 1874-07-07 82 60 71.0 -6.2 0 6 0.00 0.0 1874-07-08 91 67 79.0 1.7 0 14 0.03 0.0 1874-07-09 85 71 78.0 0.6 0 13 0.17 0.0 1874-07-10 86 69 77.5 0.0 0 13 1.94 0.0 1874-07-11 82 69 75.5 -2.1 0 11 0.78 0.0 1874-07-12 85 69 77.0 -0.7 0 12 0.83 0.0 1874-07-13 81 70 75.5 -2.2 0 11 0.00 0.0 1874-07-14 87 68 77.5 -0.3 0 13 0.00 0.0 1874-07-15 93 72 82.5 4.7 0 18 0.00 0.0 1874-07-16 86 68 77.0 -0.8 0 12 0.00 0.0 1874-07-17 80 62 71.0 -6.9 0 6 0.00 0.0 1874-07-18 85 63 74.0 -3.9 0 9 0.00 0.0 1874-07-19 84 68 76.0 -1.9 0 11 0.00 0.0 1874-07-20 90 68 79.0 1.1 0 14 0.36 0.0 1874-07-21 79 69 74.0 -3.9 0 9 0.03 0.0 1874-07-22 80 65 72.5 -5.4 0 8 0.00 0.0 1874-07-23 86 65 75.5 -2.3 0 11 0.00 0.0 1874-07-24 83 67 75.0 -2.8 0 10 0.00 0.0 1874-07-25 81 65 73.0 -4.8 0 8 0.00 0.0 1874-07-26 81 69 75.0 -2.8 0 10 0.00 0.0 1874-07-27 82 70 76.0 -1.7 0 11 0.00 0.0 1874-07-28 81 70 75.5 -2.2 0 11 0.00 0.0 1874-07-29 73 66 69.5 -8.1 0 5 0.47 0.0 1874-07-30 81 61 71.0 -6.6 0 6 0.00 0.0 1874-07-31 84 64 74.0 -3.5 0 9 0.00 0.0
-
october 1937 at ewr Sum 1929 1391 - - 355 6 4.56 0.0 - Average 62.2 44.9 53.5 -4.0 - - - - 0.0 Normal 66.0 49.0 57.5 - 253 21 3.79 0.2 - 1937-10-01 72 44 58.0 -5.3 7 0 0.00 0.0 0 1937-10-02 73 51 62.0 -0.9 3 0 0.02 0.0 0 1937-10-03 59 51 55.0 -7.5 10 0 0.01 0.0 0 1937-10-04 70 53 61.5 -0.6 3 0 0.00 0.0 0 1937-10-05 72 58 65.0 3.3 0 0 0.49 0.0 0 1937-10-06 77 65 71.0 9.7 0 6 T 0.0 0 1937-10-07 77 51 64.0 3.1 1 0 T 0.0 0 1937-10-08 56 43 49.5 -11.0 15 0 0.00 0.0 0 1937-10-09 53 38 45.5 -14.6 19 0 0.03 0.0 0 1937-10-10 50 43 46.5 -13.2 18 0 0.16 0.0 0 1937-10-11 57 43 50.0 -9.3 15 0 0.00 0.0 0 1937-10-12 71 39 55.0 -3.9 10 0 0.00 0.0 0 1937-10-13 50 45 47.5 -11.0 17 0 T 0.0 0 1937-10-14 52 38 45.0 -13.1 20 0 0.00 0.0 0 1937-10-15 51 32 41.5 -16.3 23 0 0.00 0.0 0 1937-10-16 52 41 46.5 -10.9 18 0 0.00 0.0 0 1937-10-17 56 29 42.5 -14.5 22 0 0.00 0.0 0 1937-10-18 65 35 50.0 -6.6 15 0 0.00 0.0 0 1937-10-19 66 58 62.0 5.7 3 0 0.99 0.0 0 1937-10-20 68 46 57.0 1.1 8 0 1.74 0.0 0 1937-10-21 66 42 54.0 -1.6 11 0 0.00 0.0 0 1937-10-22 67 51 59.0 3.8 6 0 0.22 0.0 0 1937-10-23 68 46 57.0 2.2 8 0 0.18 0.0 0 1937-10-24 47 37 42.0 -12.5 23 0 T 0.0 0 1937-10-25 54 33 43.5 -10.6 21 0 0.00 0.0 0 1937-10-26 62 35 48.5 -5.3 16 0 0.00 0.0 0 1937-10-27 66 50 58.0 4.6 7 0 0.15 0.0 0 1937-10-28 59 51 55.0 1.9 10 0 0.57 0.0 0 1937-10-29 61 50 55.5 2.7 9 0 T 0.0 0 1937-10-30 72 48 60.0 7.6 5 0 0.00 0.0 0 1937-10-31 60 45 52.5 0.4 12 0 0.00 0.0 0
-
now that the nws shows all station data going back to when the stations were founded i pick random months from the past to see how much we've changed