RodneyS
-
Posts
1,423 -
Joined
-
Last visited
Content Type
Profiles
Blogs
Forums
American Weather
Media Demo
Store
Gallery
Everything posted by RodneyS
-
Maximums DCA: 98 NYC: 96 BOS: 94 ORD: 93 ATL: 98 IAH: 100 DEN: 98 PHX: 114 SEA: 90
-
May 2026 at DCA tied for the 60th warmest May in DC history with an average temperature of 65.8 degrees -- 1.4 below the 1991-2020 normal. January-May 2026 averaged 50.2, the 27th warmest first five months in DC history. May 2026 precipitation at DCA totaled 2.85 inches, 1.09 below the 1991-2020 May normal of 3.94. For the first five months of 2026, DCA precipitation totaled 12.03 inches, 4.10 below the 1991-2020 normal of 16.13.
-
June DCA _ NYC _ BOS _ ORD _ ATL _ IAH _ DEN _ PHX _ SEA -0.1 0.0 -0.3 -2.3 -0.8 -1.3 2.0 0.6 0.5
-
April 2026 at DCA tied for the fifth warmest in DC history with an average temperature of 62.0 degrees. (Note: Edited on 5-1-2026 from "tied for the third warmest in DC history with an average temperature of 62.1 degrees.") January-April averaged 46.2, the 28th warmest first third of the year in DC history. April 2026 precipitation at DCA totaled 1.55 inches, 1.66 below the 1991-2020 normal of 3.21. For the first third of 2026, DCA precipitation totaled 9.18 inches, 3.01 below the 1991-2020 normal of 12.19.
-
DCA NYC BOS ORD ATL IAH DEN PHX SEA -1.8 -1.2 -0.6 -4.5 -1.8 -0.8 -0.3 0.7 2.1
-
April DCA _ NYC _ BOS _ ORD _ ATL _ IAH _ DEN _ PHX _ SEA 2.3 2.5 0.9 -0.6 1.9 1.7 3.2 2.1 0.1
-
You and @mappyneeded just that one more small Baltimore-Washington storm to push one of the two of you to victory and @AnEndlessMazedominated the IAD/DCA subdivision with a combined departure of just 0.1, but underestimated the BWI and RIC snow gods.
-
March 2026 ended the three-month cold streak at DCA with a bang, finishing at an average of 52.7 degrees -- tied for 8th warmest March in DC history. January-March averaged 40.9, the 52nd warmest first quarter in DC history, but the coldest since January-March 2015 averaged 37.3. March 2026 precipitation at DCA totaled 1.90 inches, 1.60 below the 1991-2020 normal of 3.50. For the first quarter of 2026, DCA totaled 7.63 inches, 1.20 below the 1991-2020 normal of 8.83.
-
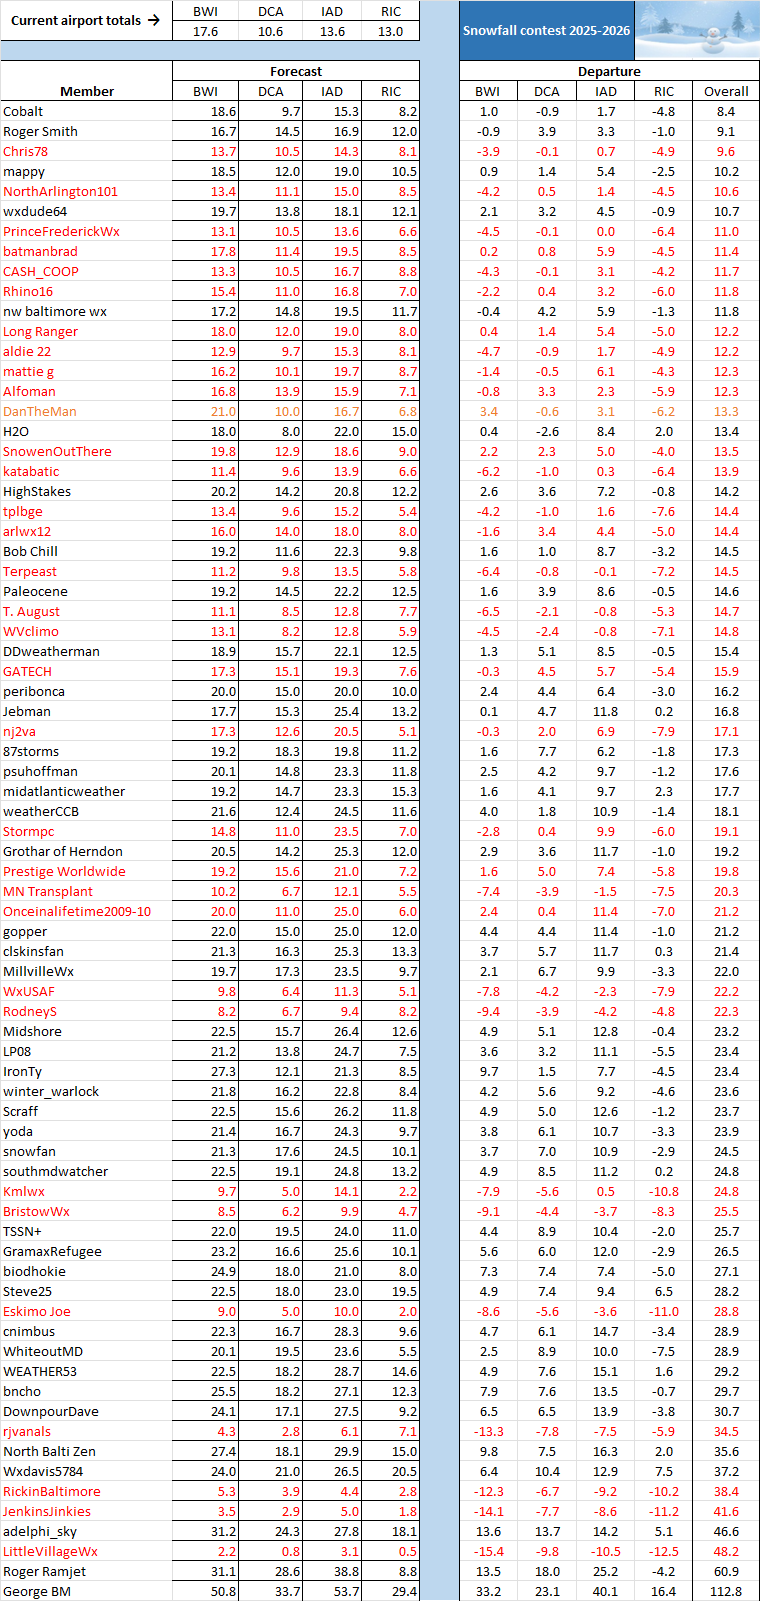
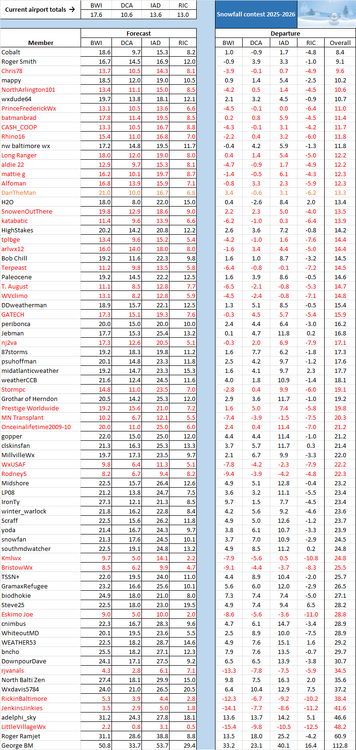
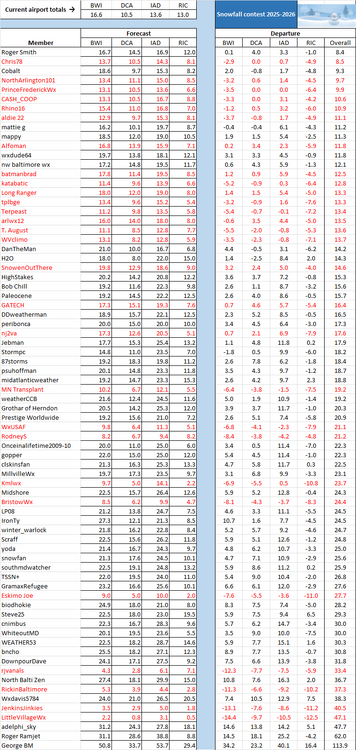
The time has arrived to award the 2025-26 Mid-Atlantic Snowfall Contest trophy to @Cobalt. This snow season was a throwback to the good old days temperature-wise, as December, January, and February were not only each below 1991-2020 Mid-Atlantic normals, but even below 1871-2025 Mid-Atlantic averages. However, snowfall was limited by the now famous "snowcrete" snow/sleet storm of January 25th and near misses in late January and late February. Still, we did receive enough at the four airports to change the leader five times. Our 2022-23 champion @LittleVillageWxhung tough early on with a repeat of his lowball snow forecast that produced victory three years ago, but snowcrete then propelled@rjvanalsbriefly into the lead until final totals confirmed that @T. Augusthad taken command. T. August held on until February 23rd when @Chris78took over after early and late February snow. Headed into March, it appeared that he might win, but March 2nd and March 12th snow reports gave a brief lead to @Roger Smith. Alas, the initial BWI snow report for March 12th was inaccurate because despite hourly reports that strongly suggested that measurable snow had fallen there, the preliminary BWI snow report showed only a trace. When that report was corrected to 1.0 inch, @Cobaltsurged into the lead. Stunningly, we then learned that Roger had passed away on February 24th. Knowing Roger as I did, I am wondering if he sent down a message to the BWI weather authorities that their March 12th snow report was off-base and that he did not want to win the contest posthumously under false pretenses. In any event, it was a well-deserved victory for Cobalt, and Roger will have to wait for his next earthly sojourn to win his Mid-Atlantic trophy, even though he claimed many other successes during his long and illustrious forecasting career.

-
I found this at https://www.google.com/search?q=mt+cranium+rip&sca_esv=f5ae96e688f1c6a3&sxsrf=ANbL-n4BUn165DsPAksiH--TojjaTqSA1g%3A1774136063265&source=hp&ei=_yq_afbwDbnm5NoPuv6CwAE&iflsig=AFdpzrgAAAAAab85D4SMSyWmc574fhzcu_GQqozcvLzq&oq=mt+cranimum&gs_lp=Egdnd3Mtd2l6IgttdCBjcmFuaW11bSoCCAMyBxAAGIAEGA0yBxAAGIAEGA0yBxAAGIAEGA0yBxAAGIAEGA0yBxAAGIAEGA0yBxAAGIAEGA0yBhAAGA0YHjILEAAYgAQYhgMYigUyCxAAGIAEGIYDGIoFMgsQABiABBiGAxiKBUjOQlAAWPshcAB4AJABAJgBrAKgAaQKqgEHNy4zLjAuMbgBAcgBAPgBAZgCC6AC8wrCAgoQIxiABBgnGIoFwgIKECMY8AUYJxieBsICDhAAGIAEGLEDGIMBGIoFwgILEC4YgAQY0QMYxwHCAgUQLhiABMICDhAuGIAEGLEDGNEDGMcBwgILEAAYgAQYsQMYgwHCAgUQABiABMICCBAAGIAEGLEDwgIREC4YgAQYsQMYgwEYxwEYrwHCAgsQLhiABBixAxiDAcICCBAuGIAEGLEDwgIOEC4YgAQYxwEYjgUYrwHCAgsQLhiABBjHARivAcICBhAAGBYYHsICCBAAGIAEGKIEmAMAkgcHNy4yLjEuMaAH25QBsgcHNy4yLjEuMbgH8wrCBwcwLjEuOS4xyAc6gAgA&sclient=gws-wiz: Roger Smith, famously known as the weather forecaster "M. T. Cranium" on boards.ie and as Peter O'Donnell on Facebook, passed away unexpectedly in February 2026. He was a highly respected figure in the Irish online community, recognized for providing detailed daily, long-term, and accurate weather forecasts for over two decades.
-
The 2025-26 astronomical (December 21-March 20) and composite (December 1-March 20) winters at DCA continued the downward trend. The former averaged 38.9 degrees, tied for the 59th warmest in DC history and down 2.2 from last year; while the latter averaged 38.3 degrees, tied for the 72nd warmest in DC history and down 3.0 from last year.
-
So saddened to just learn that Roger left us at age 76 four days after this post. He had many forecasting highlights in his life, including nailing with his AccuWeather colleagues the Presidents Day Storm of February 18-19, 1979. And he made his last appearance in this contest his best, as he is currently in 2nd place with a realistic chance to win it. https://www.americanwx.com/bb/topic/62666-roger-smith-rip/page/2/#comment-8066399
-
I'm just getting this news on Friday afternoon. Roger put more time into forecasting contests than anyone, and I had a number of private conversations with him. He had a great story of how he and his colleagues at AccuWeather nailed the President's Day Storm of February 18-19, 1979 when nobody else did. RIP, my friend, see you down the road . . .
-
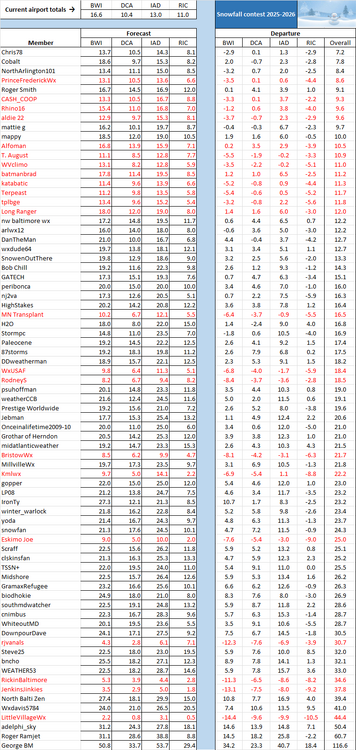
The reevaluation has now been completed and is just what the doctor ordered for @Cobalt. BWI's Thursday snow total has been revised from a trace to 1.0 inch, which makes perfect sense -- the hourly observations there on Thursday listed "heavy snow" and a temperature of 33.1 degrees at 13:54 and "light snow" and that same temperature at 14:54, with precipitation during those two hours totaling 0.19 inches. An inch of snow therefore translates into a snow/precipitation ratio of 5.3, which is reasonable with a wet snow. On the other hand, only a trace of snow with those hourly observations would have been close to impossible. So Cobalt is our new leader, but @Roger Smithremains in strong condition; see below.
-
FYI, this winter thus far has two interesting parallels to the winter of 1989-90 in the Mid-Atlantic. (1) A major consecutive day streak in which the maximum temperature failed to reach the freezing mark at DCA: December 16-25, 1989 and January 24-February 1, 2026 (2) A March mini heat wave in which the maximum temperature soared way above normal at DCA: March 12-16, 1990 maximums were 89, 87, 86, 81 and 81 and March 8-12, 2026 maximums were 76, 76, 84, 86, and 78 So, what happened right after the March 1990 mini heat wave? Several minor snow events between March 20-April 7, 1990 totaling 0.2 inches at RIC, 2.6 at DCA, 2.8 at BWI, and 10.4 at IAD.
-
FYI, yesterday's DCA snow amount was upgraded from 0.1 to 0.2 inch. Also, yesterday's BWI snow amount is now listed as "missing" rather than a trace, which could mean that amount is being reevaluated. See revised table below:

-
I was looking at @Cobaltas your biggest threat, but BWI seemed to be in a snow hole today while RIC hit the jackpot.
-
Today's decline at DCA of 45 degrees from a high of 78 at 12:44 AM to a low of 33 at 2 PM was the greatest there in more than 48 years. On January 19, 1978, the decline was 48 degrees -- from 62 to 14. The greatest intra-day temperature swing in DC history was 50 degrees, which occurred on March 23, 1907, when the temperature rose from 40 to 90. Also, 78 degrees is the warmest it has been in DC history on the same day as accumulating snow (DCA recorded 0.2 inch today). Before that, the highest temperature was 67 degrees on November 11, 1995, when 0.2 inch fell. Moreover, yesterday’s high of 86 degrees was also the warmest on the day prior to snow accumulation in DC history. Before that, the warmest it had been the day before was 78 degrees on March 18, 1934 -- 0.1 inch fell the next day.
-
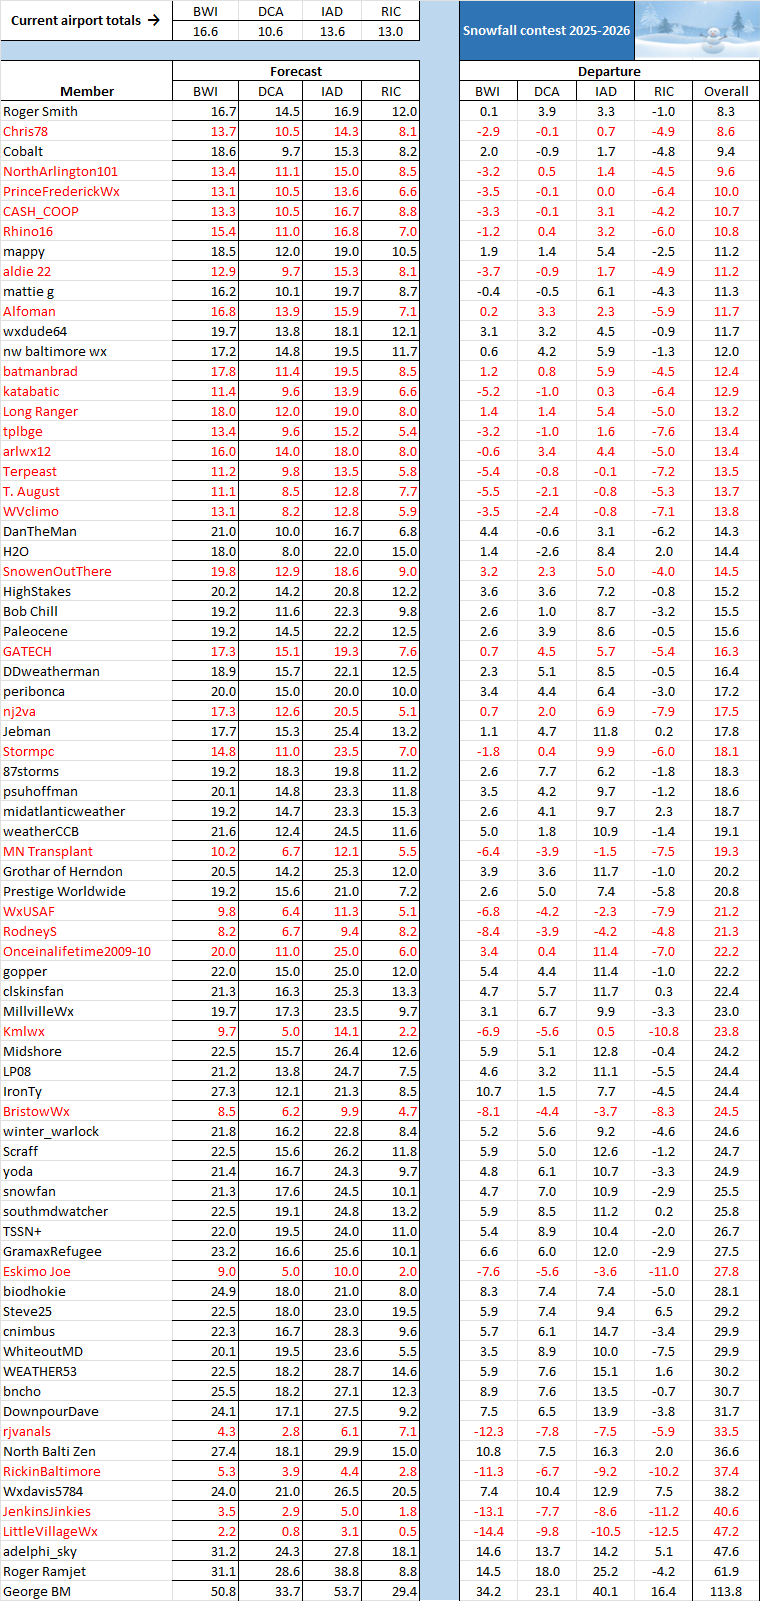
Quite a day in the Mid-Atlantic -- from summer in the early morning to winter in the late morning. That resulted in the following snow totals today: BWI trace, DCA 0.1, IAD 0.6, and RIC 2.0. As a result, our forecasting guru @Roger Smithis the new leader.
-
Don't throw in the towel yet -- Palm Sunday falls on March 29th this year -- the same day that it fell on in 1942: https://www.democraticunderground.com/10565582#google_vignette
-
If we can get some snow this weekend in 70+ temperatures, you will be in great shape.
-
Yup, the snow gods had some fun with you yesterday. The 0.4 at IAD was reported yesterday afternoon, but this morning we woke up to find that was it there, whereas DCA checked in at 0.8. However, another 0.5 at BWI could still win it for you.
-
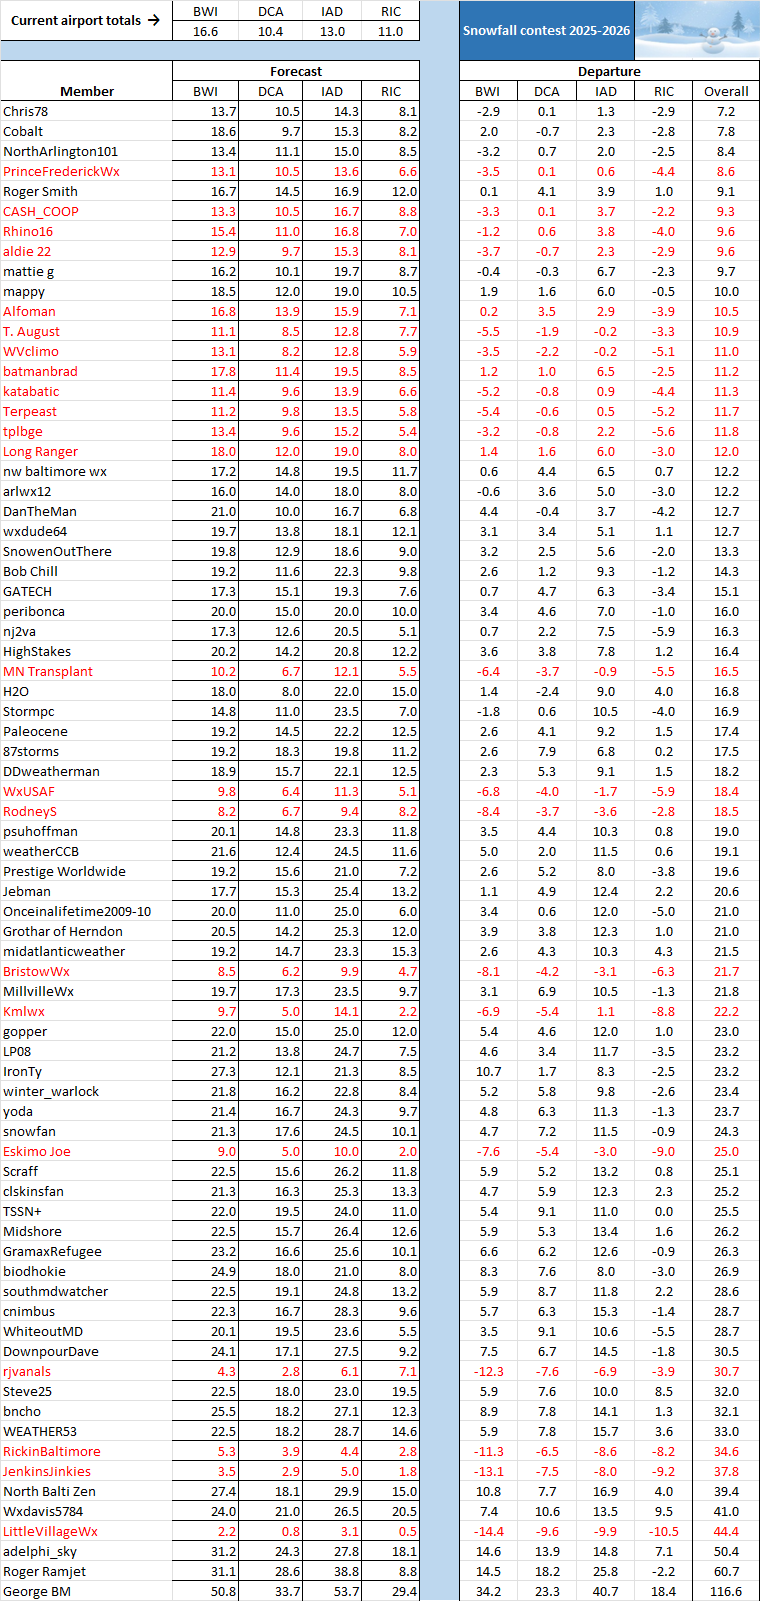
Snow totals for March 2nd were: BWI 1.0, DCA 0.8, and IAD 0.4. Those numbers eliminate several entrants from winning -- in fact only six (in black) of the top 18 remain in contention. @Chris78maintains a narrow lead over @Cobaltwith @Roger Smiththe highest ranking entrant with all positive departures at the four airports.
-
FYI, the February 24th temperature range at DCA has been confirmed as 27 to 40 degrees: https://www.weather.gov/wrh/Climate?wfo=lwx
-
Good points. By the way, the DCA February 24th temperature data are still officially missing. During that day, I noted a temperature range there of 27 to 40 and so used that to calculate my averages, but that range could change marginally. I'm unsure whether the weather station at DCA is having equipment problems or what's going on there, but missing data has been reported there several times in recent weeks.