

bluewave
-
Posts
34,246 -
Joined
-
Last visited
Content Type
Profiles
Blogs
Forums
American Weather
Media Demo
Store
Gallery
Everything posted by bluewave
-
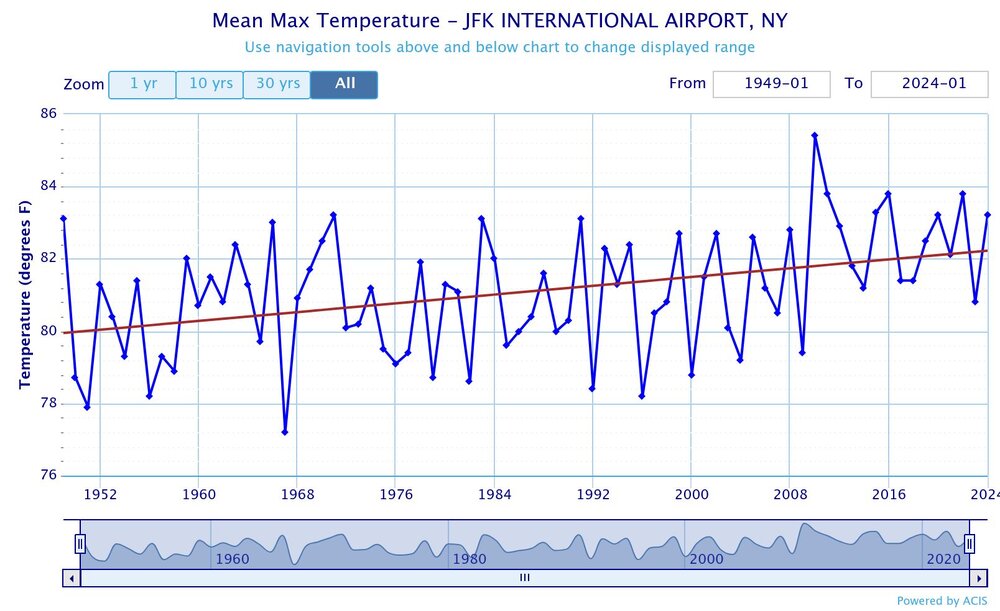
That graph was just JJA to focus on the summer.
-
The elongation of the subtropical ridge north to just east of New England has turned the flow more onshore at JFK. But the overall summer average high temperatures have been rising faster than the maximum high temperatures.So the rate of the average increase is faster than the increase in 90 days. This is due to the warmer minimums acting as a higher launch point for the afternoon highs. This results in the rate of 85° days increasing faster than the 90° days. Since the stronger afternoon sea breeze slows the rate of 90° days increasing faster increases. So two things can be true at the same time.


-
THE NEWARK NJ CLIMATE SUMMARY FOR APRIL 19 2025... CLIMATE NORMAL PERIOD 1991 TO 2020 CLIMATE RECORD PERIOD 1931 TO 2025 WEATHER ITEM OBSERVED TIME RECORD YEAR NORMAL DEPARTURE LAST VALUE (LST) VALUE VALUE FROM YEAR NORMAL ................................................................... TEMPERATURE (F) YESTERDAY MAXIMUM 87 302 PM 92 1976 64 23 55 MINIMUM 58 1242 AM 33 2001 45 13 44 2020 AVERAGE 73 55 18 50 PRECIPITATION (IN) YESTERDAY 0.00 1.97 1978 0.13 -0.13 T MONTH TO DATE 1.85 2.42 -0.57 3.65 SINCE MAR 1 6.43 6.55 -0.12 11.64 SINCE JAN 1 9.71 12.95 -3.24 18.91 SNOWFALL (IN) YESTERDAY 0.0 4.1 1983 0.0 0.0 0.0 MONTH TO DATE 0.0 0.5 -0.5 0.0 SINCE MAR 1 0.0 6.1 -6.1 T SINCE JUL 1 13.6 31.5 -17.9 12.2 SNOW DEPTH 0 DEGREE DAYS HEATING YESTERDAY 0 11 -11 15 MONTH TO DATE 257 267 -10 205 SINCE MAR 1 772 964 -192 711 SINCE JUL 1 3987 4467 -480 3627 COOLING YESTERDAY 8 0 8 0 MONTH TO DATE 9 0 9 4 SINCE MAR 1 9 1 8 4 SINCE JAN 1 9 1 8 4 ................................................................... WIND (MPH) HIGHEST WIND SPEED 30 HIGHEST WIND DIRECTION SW (230) HIGHEST GUST SPEED 46 HIGHEST GUST DIRECTION SW (240) AVERAGE WIND SPEED 14.2
-
Yeah, moving the ASOS under the trees in the 1990s has kept the 90° day count closer to 20. My guess is that if the ASOS was out in the open like before 1995, NYC would have had well over 40 days reaching 90° back in 2010 instead of only 37. So it’s the only site away from the immediate shore which has had a decrease in 90° days. The sea breeze at Newark has been slowing the rate of increase there relative to sites like Freehold-Marlboro which have avoided the sea breeze. Over 40 days reaching 90°has become the norm away from the sea breeze in NJ during the 2020s. https://mesonet.agron.iastate.edu/plotting/auto/?_wait=no&q=74&network=NJCLIMATE&station=NJTEWR&season=all&dir=above&var=high&threshold=90&year=1961&_r=t&dpi=100&_fmt=png


-
Mid to upper 80s today for the warm spots with very steep lapse rates and gusts approaching 40 mph. But it will be a warm WSW wind instead of the cold NW winds we have recently been getting. So the strongest winds ahead of the front for a change instead of behind it.

-
Storms usually begin to get weaker after April 15th. I can remember the famous Tax Day Nor’easter in 2007 getting under 970 mb. That is about the deepest we have seen so late in the season. Pattern looks more Southeast Ridge dominant going forward keeping the rainy zone further to our west. So while the dry conditions have eased a bit, still no widespread soaker in sight which would completely end the drier conditions. My guess is that our summer forecast will come down to the wind direction again. If the flow is more onshore like recent summers, then NJ will get the warmest conditions. We would need the ridge east of New England to shift back west allowing more offshore flow. But that has been difficult in recent years. NJ has had 4 summers with near to over 40 days reaching 90° in the 2020s. So top 10 summers for 90s have been very consistent west of the Hudson away from the sea breeze influence. Data for January 1, 2024 through December 31, 2024 Click column heading to sort ascending, click again to sort descending. HIGHTSTOWN 2 W COOP 41 HARRISON COOP 41 CANOE BROOK COOP 37 SOMERSET AIRPORT WBAN 35 NEWARK LIBERTY INTL AP WBAN 33 CALDWELL ESSEX COUNTY AP WBAN 33 Newark Area ThreadEx 33 INDIAN MILLS 2 W COOP 31 TETERBORO AIRPORT WBAN 31 PHILADELPHIA/MT. HOLLY WFO COOP 30 PENNSAUKEN 1N COOP 30 TETERBORO AIRPORT COOP 30 Data for January 1, 2022 through December 31, 2022 Click column heading to sort ascending, click again to sort descending. SOUTH JERSEY REGIONAL AIRPORT WBAN 53 Newark Area ThreadEx 49 NEWARK LIBERTY INTL AP WBAN 49 HIGHTSTOWN 2 W COOP 49 CANOE BROOK COOP 47 SOMERSET AIRPORT WBAN 46 HARRISON COOP 44 New Brunswick Area ThreadEx 43 NEW BRUNSWICK 3 SE COOP 43 FREEHOLD-MARLBORO COOP 42 ESTELL MANOR COOP 41 INDIAN MILLS 2 W COOP 40 Data for January 1, 2021 through December 31, 2021 Click column heading to sort ascending, click again to sort descending. FREEHOLD-MARLBORO COOP 43 HIGHTSTOWN 2 W COOP 41 Newark Area ThreadEx 41 NEWARK LIBERTY INTL AP WBAN 41 HARRISON COOP 38 CALDWELL ESSEX COUNTY AP WBAN 37 NEW BRUNSWICK 3 SE COOP 36 SOUTH JERSEY REGIONAL AIRPORT WBAN 36 New Brunswick Area ThreadEx 36 for January 1, 2020 through December 31, 2020 Click column heading to sort ascending, click again to sort descending. HIGHTSTOWN 2 W COOP 42 FREEHOLD-MARLBORO COOP 40 HARRISON COOP 39 CANOE BROOK COOP 37 CALDWELL ESSEX COUNTY AP WBAN 37 ESTELL MANOR COOP 36
-
Starting to see the seasonal weakening of the jet stream so not as much wind or rain as the storms track through the Great Lakes.
-
This was expected due to the record lack of coupling this year.
-
Heading into a warmer and drier pattern to close out the month.


-
There was a sea breeze in July 1977 along the South Shore which kept JFK cooler. But the South Shore was warmer with the late August 1973 heatwave. Those were the two big 1970s heatwaves. Monthly Data for August 1973 for Upton NY NWS CWA Click column heading to sort ascending, click again to sort descending. NY MINEOLA COOP 101 NJ NEWARK LIBERTY INTL AP WBAN 100 NY NEW YORK LAUREL HILL COOP 100 NJ PATERSON COOP 100 NJ JERSEY CITY COOP 99 NY NEW YORK AVE V BROOKLYN COOP 99 NJ TETERBORO AIRPORT WBAN 99 NJ LITTLE FALLS COOP 99 NJ CRANFORD COOP 98 NY NY WESTERLEIGH STAT IS COOP 98 NY NY CITY CENTRAL PARK WBAN 98 NY WEST POINT COOP 98 NY JFK INTERNATIONAL AIRPORT WBAN 98 NJ PLAINFIELD COOP 97
-
That was in the old days before they put the ASOS under the trees in Central Park. Monthly Data for July 1977 for Upton NY NWS CWA Click column heading to sort ascending, click again to sort descending. NY NEW YORK LAUREL HILL COOP 104 NY NY CITY CENTRAL PARK WBAN 104 NY DOBBS FERRY-ARDSLEY COOP 103 CT NORWALK GAS PLANT COOP 102 NJ NEWARK LIBERTY INTL AP WBAN 102 NJ TETERBORO AIRPORT WBAN 102 NY WEST POINT COOP 101 NY VANDERBILT MUSEUM COOP 101 NJ ESSEX FELLS SERVICE BLDG COOP 101 NY MARYKNOLL COOP 100 CT STAMFORD 5 N COOP 100 NY SCARSDALE COOP 100 CT NEW HAVEN COOP 100 CT MIDDLETOWN 4 W COOP 100 NJ PLAINFIELD COOP 100 NJ CRANFORD COOP 100 NY NEW YORK AVE V BROOKLYN COOP 100 NY NY WESTERLEIGH STAT IS COOP 100 NJ LITTLE FALLS COOP 100 NJ WANAQUE RAYMOND DAM COOP 99 NY SUFFERN COOP 99 CT DANBURY COOP 99 NY WESTCHESTER CO AP WBAN 99 NY SETAUKET STRONG COOP 99 CT GROTON COOP 99 NJ CANOE BROOK COOP 99 NY LAGUARDIA AIRPORT WBAN 99 NY WALDEN 1 ESE COOP 98 NY CARMEL COOP 98 CT NORWICH PUBLIC UTILITY PLANT COOP 98 NY MIDDLETOWN 2 NW COOP 97 NY MINEOLA COOP 97 NY YORKTOWN HEIGHTS 1W COOP 97 CT NEW HAVEN TWEED AP WBAN 97 CT MOUNT CARMEL COOP 97 NY RIVERHEAD RESEARCH FARM COOP 97 NJ JERSEY CITY COOP 97 NY PATCHOGUE 2 N COOP 96 NY ISLIP-LI MACARTHUR AP WBAN 96 NJ CHARLOTTEBURG RESERVOIR COOP 95 NY JFK INTERNATIONAL AIRPORT WBAN 95 NY PORT JERVIS COOP 95 CT PUTNAM LAKE COOP 94 NY GREENPORT POWER HOUSE COOP 94 CT IGOR I SIKORSKY MEMORIAL AIRPORT WBAN 93 CT WESTBROOK COOP 93 NY BRIDGEHAMPTON COOP 93 NY MONTAUK COOP 93 NY WANTAGH CEDAR CREEK COOP 91
-
It’s possible but there was missing data from 1978 to 1999 with no records over those years.
-
That isn’t the case as a faulty ASOS sensor could just as easily run too cold like was the case in Albany several years back. https://cbs6albany.com/weather/weather-extra/octobers-weather-highlights-and-why-temps-at-albany-remain-a-problem October temperature data at Albany continued to suffer from the estimated 2-3 degree cold bias that was introduced into the climate record on July 17 as a result of the temperature sensor being replaced at the airport ASOS (automated surface observation station.)Hope, however,grew in October that the problem was corrected when the National Weather Service announced the sensor had again been replaced on October 15. Unfortunately, the replacement sensorwas not new, but instead a refurbished unit and has subsequently also illustrated a cold bias.We know there is a cold bias through comparisons we can make utilizing nearby observations sites including sites that are part of the New York Mesonet.The sensor appears a little better, but the bias may be as great as 2 degrees, which is significant when it comes to the climate record.I'm told the sensor is under evaluation and therefore it is not known if it will again be replaced.In terms of the temperature data going into Albany's climate record since July 17, it is not known what if anything will be done to adjust it.A determination has to be made on how cold the July 17th sensor was and that either has not yet been determined or the information has not yet been released.So stay tuned on that one.When I learn of any decision by NOAA's National Center for Environmental Information (NCEI), the keepers of the nation's climate data, I'll let you know.
-
New Haven hasn’t made it to 100° since 2011 due to all the onshore flow from the ridge extending east of New England. I am just to the east of the ASOS. So my temperatures are pretty similar. Time Series Summary for NEW HAVEN TWEED AP, CT - Jan through Dec Click column heading to sort ascending, click again to sort descending. 2024 95 1 2023 95 1 2022 95 0 2021 94 0 2020 94 2 2019 97 2 2018 93 3 2017 90 0 2016 94 0 2015 91 1 2014 89 0 2013 97 0 2012 95 3 2011 101 0 2010 100 0
-
March tied for warmest on record using the Berkeley Earth dataset continuing the streak of record warmth which began in 2023.
-
Most of the springs summers living back in Long Beach before I moved featured onshore flow. But occasionally we would get into W or WNW flow like 1993,1999, 2010, 2011, and 2012. Those were the occasions when we reached close to or made it to 100°. Even here along the CT Shoreline still get into an onshore flow much of the time as I only had 9 days reach 90° last summer vs 40 days in parts of NJ.
-
The Euro has a WSW flow on Saturday ahead of the cold front. So so Western LI north of the Southern State could approach 80°. JFK should be able to go 75°+ but not sure about 80° yet since there could be a short trajectory off the water.


-
The best La Niña snowfall analogs for Chicago this winter were 22-23 and 11-12. The strongest winter temperature analogs were 17-18, 18-19, and 20-21. While the Euro seasonal forecast was warmer than what actually verified for Chicago, the snowfall forecast was pretty good. It’s also funny how that joke about Tampa snowfall in the forecast wasn’t far from the mark with the record snow in New Orleans. Time Series Summary for Chicago Area, IL (ThreadEx) - Oct through Sep Click column heading to sort ascending, click again to sort descending. 1 1920-1921 9.8 0 2 1997-1998 10.4 79 3 1921-1922 11.5 0 4 1936-1937 12.0 0 5 1948-1949 14.3 0 6 2024-2025 17.6 168 7 1924-1925 18.9 0 8 1914-1915 19.0 0 - 1901-1902 19.0 0 9 1912-1913 19.1 0 10 2011-2012 19.8 0 11 1957-1958 20.0 0 12 2022-2023 20.2 0 2018-2019 26.7 0 1990-1991 26.8 0 2017-2018 26.9 0 - 1968-1969 26.9 0 - 1957-1958 26.9 0 - 1939-1940 26.9 0 1946-1947 27.0 0 1967-1968 27.1 0 - 1924-1925 27.1 0 1934-1935 27.2 0 2024-2025 27.3 0 2020-2021 27.4 0
-
Looks like the cutter next week won’t be as strong. So our next run on 80° this weekend won’t be followed by such strong winds. Then another chance of approaching 80° next week. So improving spring conditions going forward.


-
Yeah, it was the windiest winter also. While there have always been cutters, the storm track through the Great Lakes this year has been supercharged. This is how a winter with an average of 34.8° in NYC can run 41.0° on the 11 days that precipitation over .25 fell.
-
The biggest issue for the Philly airport is it consistently is subject to cooling breezes off the Delaware River. This makes it an unrealistic proxy for the actual warm season temperatures in downtown Philadelphia which runs several degrees warmer. So residents in the densest population zones in the Philadelphia urban centers are experiencing warmer conditions than the airport. Same goes for the airport at Newark. The ASOS is very close to the bay and experiences cooling sea breezes which keep the temperatures lower than the urban areas just inland from the sea breeze influence. So where the residents actually live they experience warmer conditions than the airport. NYC has a different twist to underreporting the actual urban temperatures. When the NWS left NYC in the early 1990s the Central Park observing site fell into disrepair. They installed an ASOS under a tree canopy placing it in the deep shade in 1995. The old ASOS was in an open sitting not under a cooler canopy. So this created an artificial cooling in the NYC temperature record around 1995 since the measurements before then were taken out in the open. This is why the NYC readings started running cooler than surrounding sites when it had been warmer or as warm as the surrounding sites in the years prior to the 1990s. LaGuardia airport also has issues with cooler warm season readings than the surrounding sites since the ASOS is right on the water and gets cooling breezes. So its temperatures in the warm season run cooler than the surrounding sites. The good news is that NYC established a micronet and placed sensors in the densest urban city neighborhoods where the people actually live. These readings have shown that the neighborhoods where the people actually live have consistently run warmer than the airport. There have been numerous 100° readings just inland from the airport to the south when the airport only maxed out in the 90s. So the moral of the story is that we need more thermometers in the warmer neighborhoods since they aren’t subject to the cooling breezes that the airports often get. This does a disservice to the residents in these urban environments that have to experience higher levels of heat than the cooler local airports.
-
The strong winds will continue to be the common denominator.
-
Saturday looks like or next run on 80° for the warm spots.
-
Good question. Today should see a drop off in the winds. But tomorrow will have very steep low level lapse rates. So we could see 45-50 mph westerly gusts especially if the downslope warming beats guidance by a few degrees like we haven been regularly experiencing.
-
Yeah, they made to 93° on 4-14-23 and had to wait until July 3rd to get that warm again.


