tacoman25
-
Posts
4,958 -
Joined
-
Last visited
Content Type
Profiles
Blogs
Forums
American Weather
Media Demo
Store
Gallery
Everything posted by tacoman25
-
.4" here!
-
They do exist: https://www.caranddriver.com/kia/ev4
-
Looks like they're starting to come into general agreement for a quick 1-3" for much of the Front Range with the cold front Friday overnight.
-
I don't think the point was that there is no alternative, just that we are hooked on oil in so many ways that there simply is no way to fully transition away from it at this point. And as far as energy/power goes, we are a long ways from being able to fully rely on electric. Not to mention the challenges that the current AI race is adding to the mix, with the enormous need for power there.
-
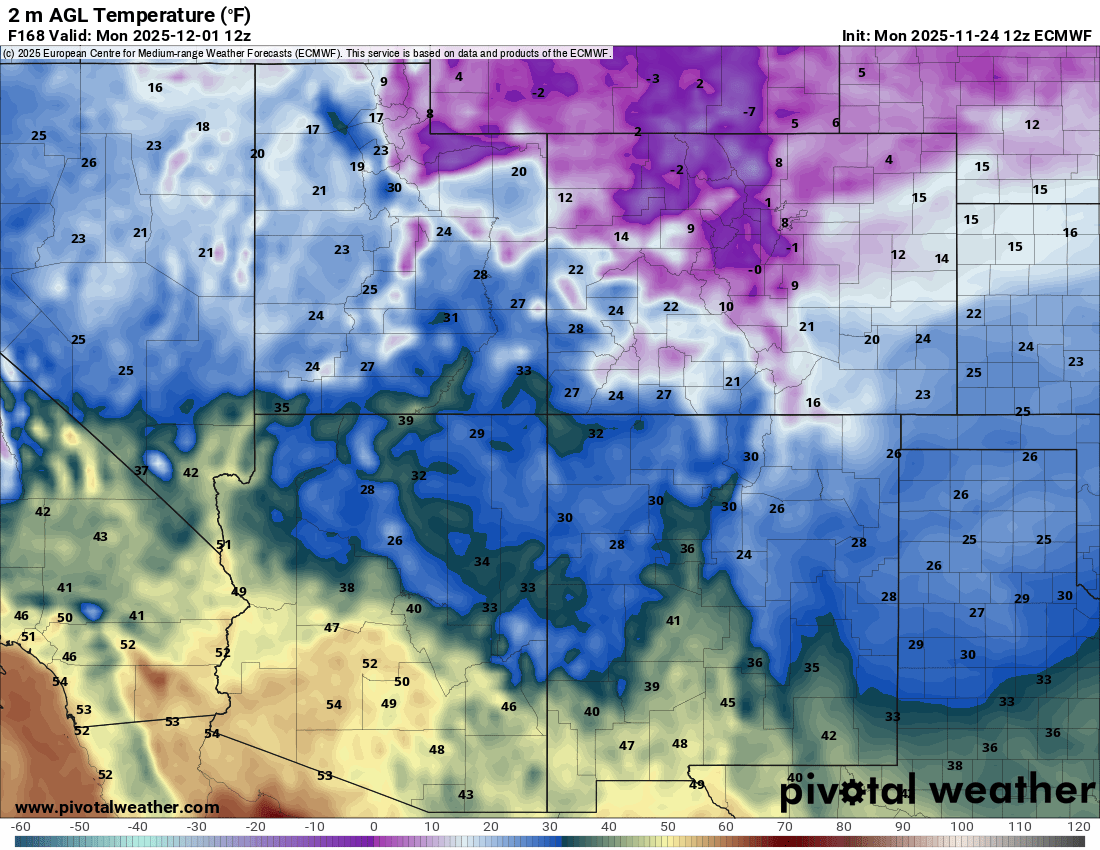
Latest Euro gives us a couple shots of snow. And yeah, pretty chilly.

-
He says a lot more than that in that scene...not that I buy all of it, just thought there was some interesting points brought up.
-
-
Sure, anyone who points this out is a denier...it's the same dogma that leads to "everything about climate change is CATASTROPHIC and EVIL!"
-
What could go wrong?
-
Picked up .03"!! At least a precip-less month is off the table.
-
I think the pattern finally starts to turn significantly colder/stormier towards the end of the month into early December. Model ensembles are pretty strongly hinting at this. You're definitely right that a lot of heat/dry records have been set in recent years, but...let's not be too prisoner of the moment. - Denver's driest year was way back in 1954 - Hottest temp of 105 was first recorded in the late 1800s and was tied in 2005 and 2012 but has not been touched since - Boulder's snowiest winter on record was 2019-20 - Denver's warmest year on record was 1981 So it could be worse. Also, there have been some impressive winter cold waves in the past decade or so. - two separate very cold waves in Feb 2025, the second which delivered a 12/-7 day on 2/19, about as cold as it gets that late in the season (though topped by an even more impressive event below) - DEN fell to -19 in the Jan 2024 cold wave. That was the coldest Jan temp since 1984. - Dec 2022 featured a -6/-24 day. That was the coldest max temp since 1990, the third coldest on record (-9 is coldest), and the low was one degree off the coldest temp recorded in the airport era (-25) - That was followed by a top tier blast in late Feb 2023, featuring a 7/-11 day at DEN on 2/23. The -11 broke the daily record by 11 degrees, and was the second latest a temp that cold had ever occurred - Feb 2021, another record-breaking cold wave. On Valentine's Day, DEN was 1/-14. That was followed by a low of -16 the next morning. The high was the coldest that late since 1962, and same for the low of -16.
-
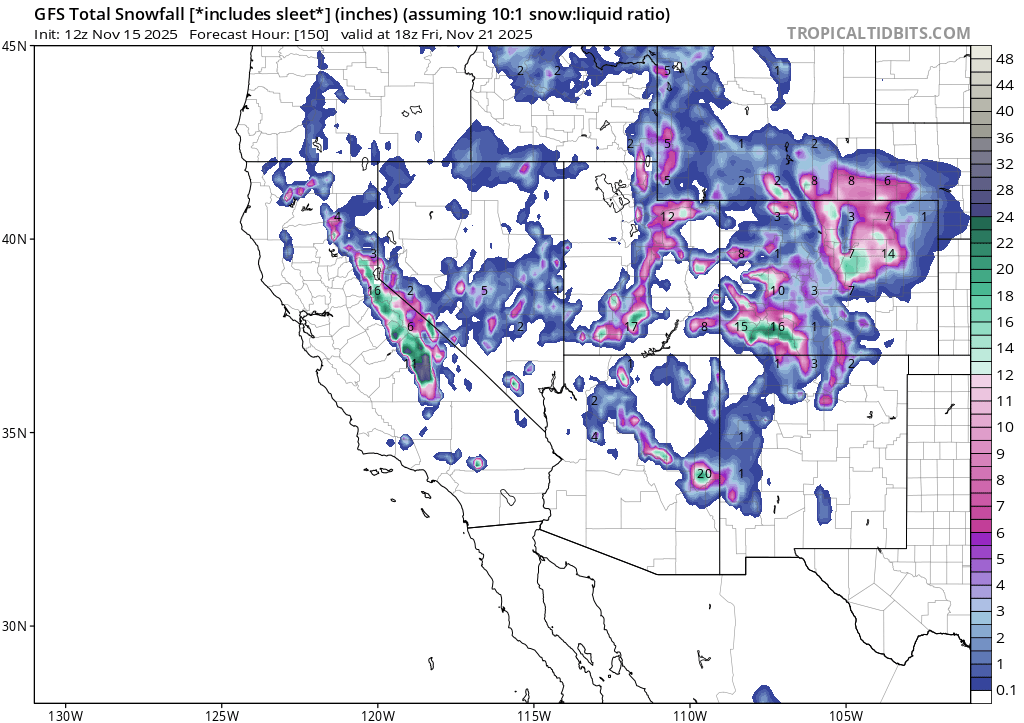
Sadly, the trend today in models has been to dry it out for most of the area, with the precip focused further east. We'll get a little rain it appears, which is better than nothing, but still disappointing given the potential.
-
Models are now showing the storm Friday to be mainly rain for the urban corridor. Except for the GEM, which still think there will be a heavy, wet snowstorm in Denver.
-
Yes, both things can be true.
-
Stereotype or not, it's just fact that China has way more cheap labor than any other country in the world. The fact that many factories have become more automated doesn't negate that.
-
GFS is probably on crack, but all models have trended wetter with the system next week.

-
Jan/Feb weren't bad at all. Both months were colder and snowier than normal for DEN.
-
Yeah, it's been a historically warm/dry stretch here. DEN has seen a grand total of .14" since 9/29, with nothing so far this month. On track to rival 2021, which holds the record with just .11" in Oct/Nov. Not quite as warm as 2021, but still ridiculous with six 70+ November days now. Just a complete lack of troughing in the region this fall. -ENSO falls tend to be warm and dry, but 2021 and this year are extreme examples.
-
China has a major nuclear initiative in action. They have dozens of new nuclear power plants currently being built while the U.S. has none. That being said, there is a big push from the current administration to build more (primarily to meet rapidly growing datacenter demand due to the AI frenzy), but previous projects have been very slow to get underway.
-
And to think, last year at this time we were in the midst of the snowiest November for Denver in over 30 years.
-
Only .03" here since 10/5. Been a brutal stretch.
-
DEN set a new November record today with a high of 83.
-
Correlation of extreme hurricanes, AGW, and solar cycles
tacoman25 replied to WolfStock1's topic in Climate Change
Yep, lower trend. -
Correlation of extreme hurricanes, AGW, and solar cycles
tacoman25 replied to WolfStock1's topic in Climate Change
This is one of those graphs where the trend line is heavily affected by the starting point. Start in 1987 or 1989 instead of 1982 (which fell during a period of suppressed activity, but there were definitely busier periods prior), and it's quite different. -
Correlation of extreme hurricanes, AGW, and solar cycles
tacoman25 replied to WolfStock1's topic in Climate Change
Does this account for closer monitoring of storms especially those well offshore in recent decades, though?