donsutherland1
-
Posts
21,072 -
Joined
Content Type
Profiles
Blogs
Forums
American Weather
Media Demo
Store
Gallery
Everything posted by donsutherland1
-
This morning, temperatures were mainly in the teens in and around New York City. Moderation will follow tomorrow, but another brief cold shot is likely around mid-week before temperatures moderate yet again. In addition, a period of light snow or flurries is possible tonight as warmer air moves northward. A coating to an inch is possible, mainly outside New York City. Some of the distant suburbs could pick up 1"-3" of snow. There remains uncertainty about the second half of the month. The ECMWF weeklies have now shifted to below normal temperatures after moving to a warmer than normal outlook. The AO is now forecast to go strongly negative. These recent developments increase prospects for a colder pattern. Precipitation will likely be near or somewhat above normal. The AO is now positive and is expected to remain predominantly positive through the first week of February before falling sharply. Since 1950, just 2 of 19 (11%) of storms with an AO of +2.000 or above during January 15-February 15 saw 6" or more of snow in New York City. In addition, the NAO is likely to remain at +1.000 or above through the first 10-14 days of February. Since 1950, just 1 of 18 (6%) of storms with an NAO of +0.900 or above saw 6" or more snow in New York City. That storm occurred with an AO of -1.769. As a result, prospects for a 6" or above snowstorm in the New York City area will likely be limited through at least the first 10 days of February. The low probability of a 6" or above snowstorm does not mean that there cannot be snowfall or there won't be snowfall. Smaller events are possible. The ENSO Region 1+2 anomaly was -0.4°C and the Region 3.4 anomaly was -0.9°C for the week centered around January 22. For the past six weeks, the ENSO Region 1+2 anomaly has averaged -0.08°C and the ENSO Region 3.4 anomaly has averaged -0.80°C. La Niña conditions are underway and will likely persist into the start of spring. The SOI was +20.51 today. The preliminary Arctic Oscillation (AO) was +0.913 today.
-
Nice shift to colder on the ECMWF weeklies.
-
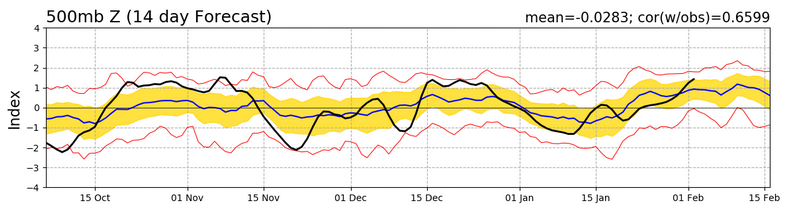
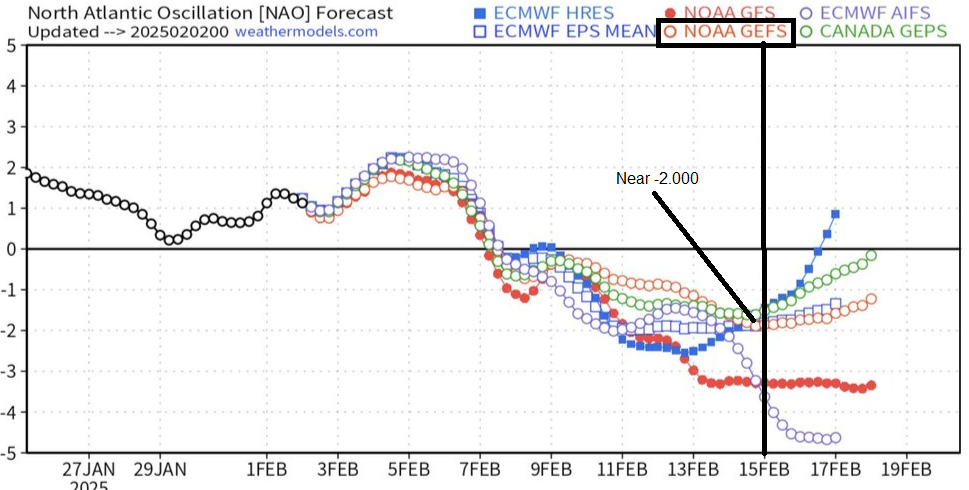
If the WxBell (and also WxModels) GEFS idea is to verify, it would have to exceed the largest 14-day error over the last three months by easily the largest margin. I am increasingly beginning to question whether it makes sense to continue to subscribe to paid plans with what appears to be a growing amount of questionable or incorrect data. I suspect the same programming flaw that produces the GEFS maps is also responsible for the low NAO values on the EPS and ECMWF. A negative NAO is plausible by mid-month (not assured), but a -2.000 or below value seems very unlikely.
-
I only have vendor information. The ECMWF does not post teleconnection charts, so I can't verify whether a similar issue exists. The AI number is all but certain to be wrong. The record low value for the NAO is -3.254.
-
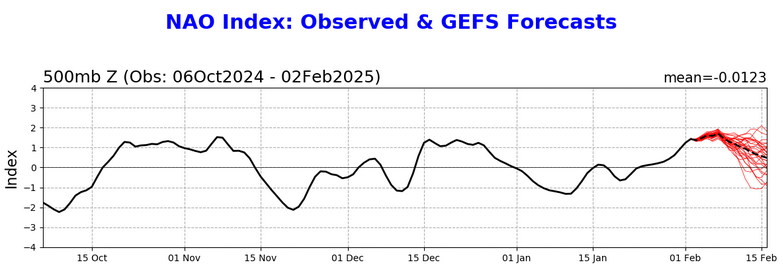
The NAO chart is suspect. Here's the GEFS forecast from NCEP: On the official site, not a single member of the GEFS forecasts an NAO value near -2.000 by February 15. Also, for February 2010, the NAO was at or below -1.000 on 14/28 (50%) days and < 0 on all 28 days. That is not going to be the case this February. The NAO's preliminary values for February 1 and 2 are +1.269 and +1.535. A February 2010 NAO scenario is not on the table.
-
This is a big and welcome change with the AO.
-
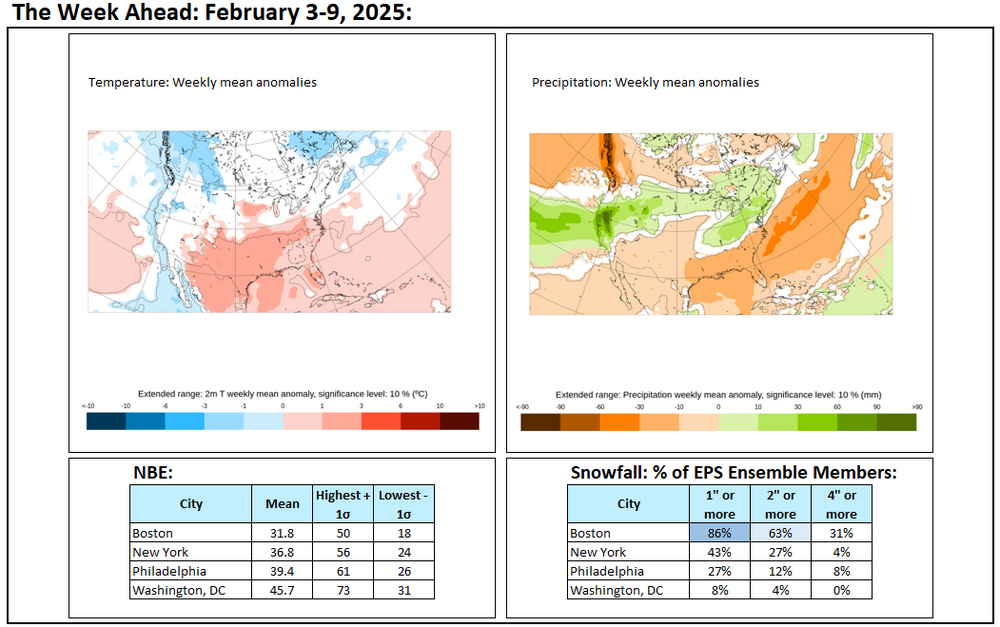
The week ahead:
-
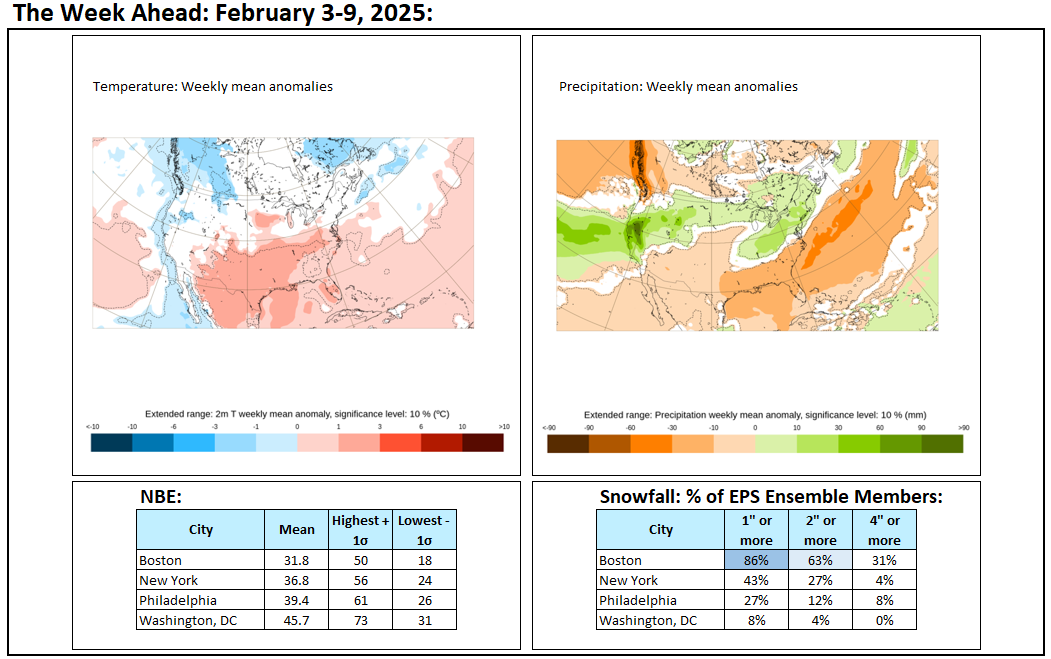
The first week of February will feature a temperature roller-coaster. February will get off to a relatively brisk start. However, moderation will follow after the weekend, but another brief cold shot is likely around mid-week before temperatures moderate yet again. Overall, the first week of February will likely wind up near or somewhat above normal in the New York City area. There remains considerable uncertainty about the second half of the month. The ECMWF weeklies have again swung back to near normal temperatures after shifting to a warmer than normal outlook in recent days. There is greater confidence with precipitation coming out near or somewhat above normal. The AO is now positive and is expected to remain predominantly positive through at least the first week of February. Since 1950, just 2 of 19 (11%) of storms with an AO of +2.000 or above during January 15-February 15 saw 6" or more of snow in New York City. In addition, the NAO is likely to remain at +1.000 or above through the first two weeks of February. Since 1950, just 1 of 18 (6%) of storms with an NAO of +0.900 or above saw 6" or more snow in New York City. That storm occurred with an AO of -1.769. As a result, prospects for a 6" or above snowstorm in the New York City area will likely be limited through the first 10-14 days of February. The low probability of a 6" or above snowstorm does not mean that there cannot be snowfall or there won't be snowfall. Smaller events are possible. The ENSO Region 1+2 anomaly was -0.4°C and the Region 3.4 anomaly was -0.9°C for the week centered around January 22. For the past six weeks, the ENSO Region 1+2 anomaly has averaged -0.08°C and the ENSO Region 3.4 anomaly has averaged -0.80°C. La Niña conditions are underway and will likely persist into the start of spring. The SOI was +25.21 yesterday. The preliminary Arctic Oscillation (AO) was +0.965 today.
-
Yes. They have gone back. Hopefully, that will be the outcome that verifies.
-
Occasional Thoughts on Climate Change
donsutherland1 replied to donsutherland1's topic in Climate Change
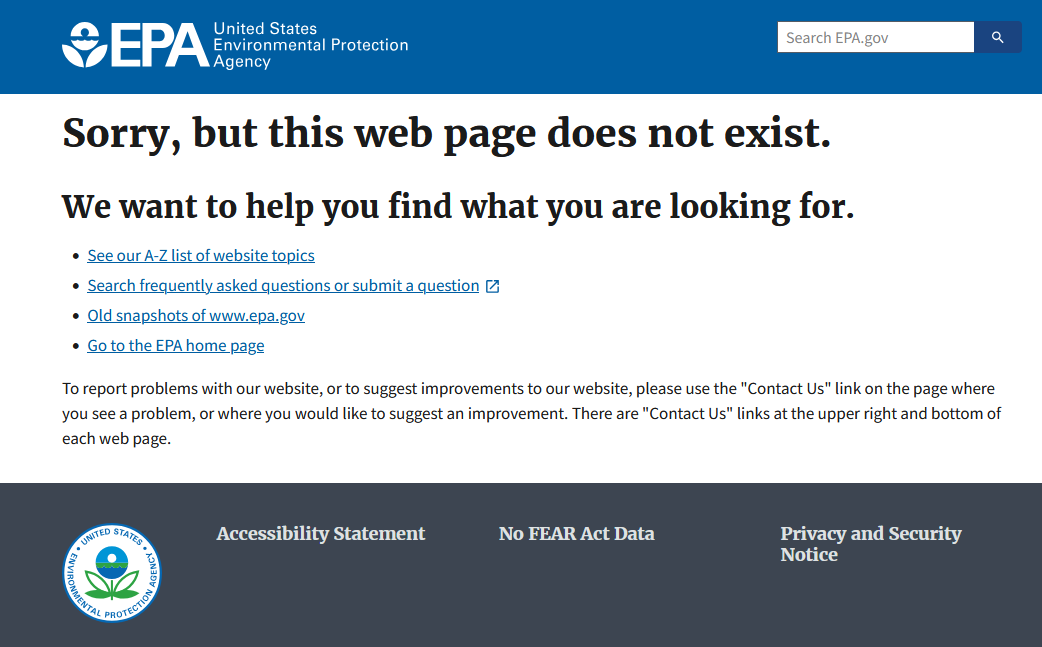
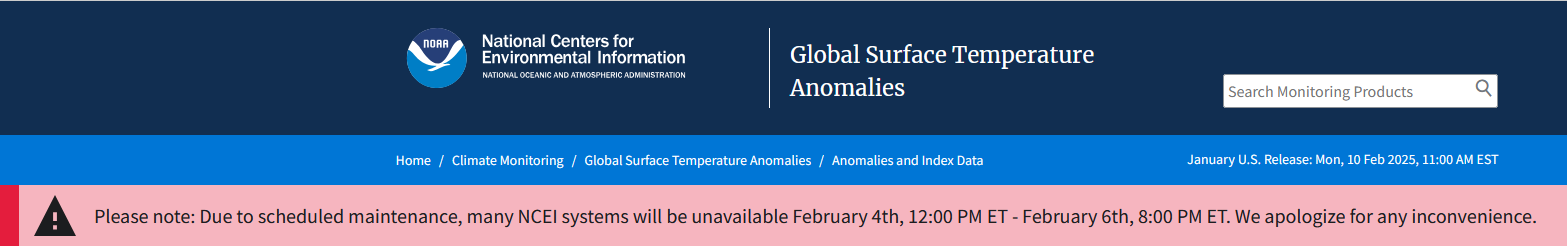
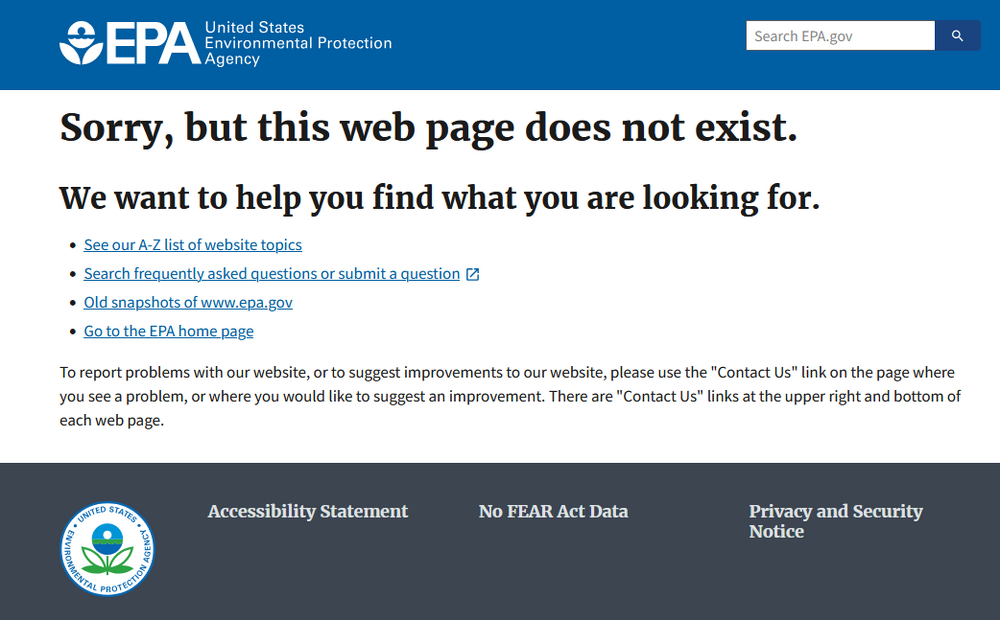
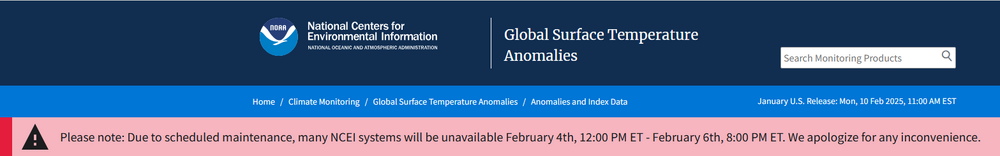
The federal government hosts a wide range of webpages that provide resources and information on climate change: climate change mitigation, climate change adaptation, climate science, climate change outcomes, link to the burning of fossil fuels, core data and tools. There is a growing risk that climate change-related information could be targeted. Moreover, initial efforts aimed at such information are already getting underway. The January 31, 2025 edition of The Washington Post reported: The Post also found in its analysis that some agencies were also starting to change how they talk about climate change, a policy area where Trump has sharply diverged from his predecessor... “Climate change” was also removed from a page describing an Environmental Protection Agency tool used to analyze greenhouse gas emissions and air quality. And several Department of Transportation references to “climate change” have been replaced with “climate resilience,” a more generic term that describes protections from disasters, without investigating their root causes, according to Alys Campaigne, Climate Initiative Leader at the Southern Environmental Law Center, a nonpartisan, nonprofit organization. These early developments, some of which come straight out of recommendations set forth in the Project 2025 playbook despite efforts by the Trump campaign to distance itself from the initiative, are likely the start of a sustained and comprehensive campaign to recast the federal government’s position on climate change. During the previous Trump administration (2017-2021), federal climate-related web pages were altered or removed, especially those managed by agencies under executive influence. For example, climate language was removed from EPA and Department of Energy sites, and reports were downplayed or delayed. One example from the EPA's Climate Indicators Overview Page: An ominous banner on numerous additional sites that deal with climate or climate change: Based on the first Trump term, Project 2025’s goals and recommendations, and early reporting related to the Administration’s editing of climate change-related information, below is a table of potential changes and an early risk assessment. AI played a role in developing the table and its risk assessments, particularly in broadening the perspective and reducing the risk of "blind spots."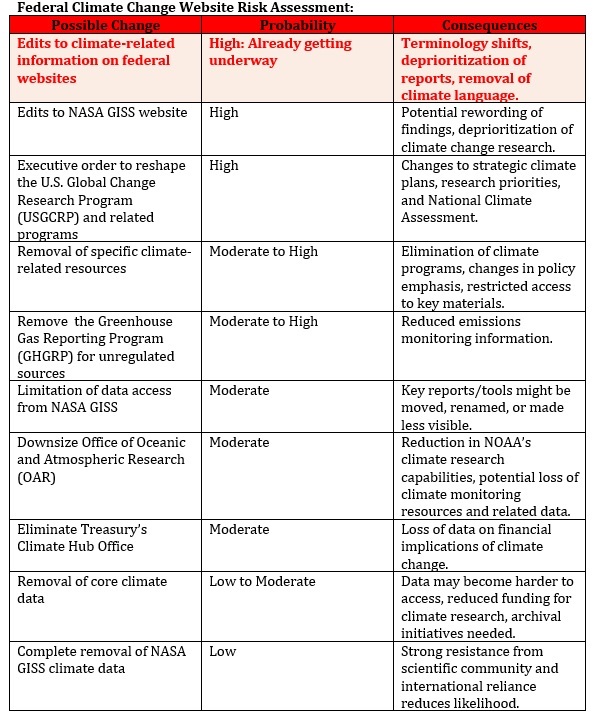
-
Report: Another Year of Record Heat for the Oceans
donsutherland1 replied to donsutherland1's topic in Climate Change
A new paper on ocean warming. The paper notes that global sea surface temperatures are rising at an accelerating rate due to Earth's increasing energy imbalance, likely exceeding past 40-year warming in just 20 years. The factors driving the increasing Earth energy imbalance include rising atmospheric greenhouse gas concentration (especially carbon dioxide and methane), reduction in anthropogenic aerosols, and cloud feedbacks. The paper can be found here: https://iopscience.iop.org/article/10.1088/1748-9326/adaa8a -
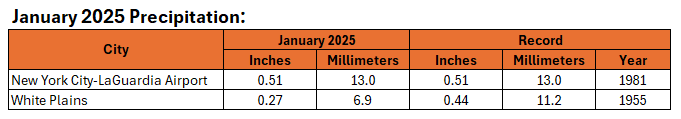
Some updates on last week’s thoughts: 1. Southern California saw badly-needed rain, mainly from Sunday through Monday. Los Angeles (LAX) received 0.94” of rain. Blythe’s record 300-day streak without measurable rainfall ended on Monday when 0.01” fell. Phoenix’s 159-day stretch without measurable rainfall ended on Wednesday with 0.01” of rain. However, Las Vegas saw no rainfall, so its second longest streak without measurable rainfall continues. 2. Heavy rain affected parts of Texas on Wednesday and Thursday. The area of heavy rainfall was smaller than expected. Two-day rainfall at Dallas came to 4.13” (with 2.80” on January 29, which broke the old record of 0.93” from 1999 and 1.33” on January 30, which broke the old record of 1.24” from 1982). The daily value of 2.80” was the 6th highest daily value for all of January. January records go back to 1899. However, Houston saw only 0.23”. 3. The idea of little or no rainfall through the end of January in New York City and Philadelphia was incorrect. January 31 rainfall totals came to: New York City: 0.61” and Philadelphia: 0.93”. As a result, New York City and Philadelphia did not set a record for its driest January on record. Newark wound up tying its monthly record and White Plains set a new monthly record. 4. There was no significant snowfall in the Great Lakes and Middle Atlantic regions. In fact, record warmth affected parts of the Great Lakes and Upper Midwest regions. La Cross, WI set a January monthly high temperature record of 58° on January 30. Green Bay and Madison approached their monthly records. Three Thoughts Going Forward: 1. Northern California will see above to much above normal precipitation next week. Redding could pick up 3”-6” of rain for the week. Normal rainfall is 1.41”. 2. No significant (6” or above) snowfalls are likely from Washington, DC to New York City or Chicago and Detroit through the first week of February. The February 3-6 timeframe could see accumulating snow in such cities as Billings, Great Falls, and Rapid City. 3. It will turn unseasonably warm in parts of the West early next week. Denver could challenge its record of 70° from 1890 and 1954 on February 3. Oklahoma City could challenge its record high of 78° from 1934 and 1962 on February 3. Phoenix could challenge its record high of 85° on February 4 (1925 and 1963). The abnormal warmth will then spread eastward. As a result, Little Rock could challenge its record high of 75° from 2008 on February 5 and Nashville will challenge its record high of 73° from 2019 on the same day. One or more of those cities will likely tie or break their daily records during the peak of the heat. Longer-Range: It will turn wetter in the Great Lakes Region and parts of the eastern U.S. However, with the AO likely to be predominantly positive through the first 10 days of February and the NAO positive to strongly positive through mid-month, the probability of a significant (6” or above) snowstorm in the New York City and Philadelphia areas will be limited for at least the first 10 days of February. Smaller snowfalls would be possible. There is considerable uncertainty about the second half of February. Heading into the second half, there is a large difference between the GEFS and EPS. However, the the ECMWF weeklies have grown warmer in recent runs for the eastern half of the United States. The CFSv2 remains very warm.
-
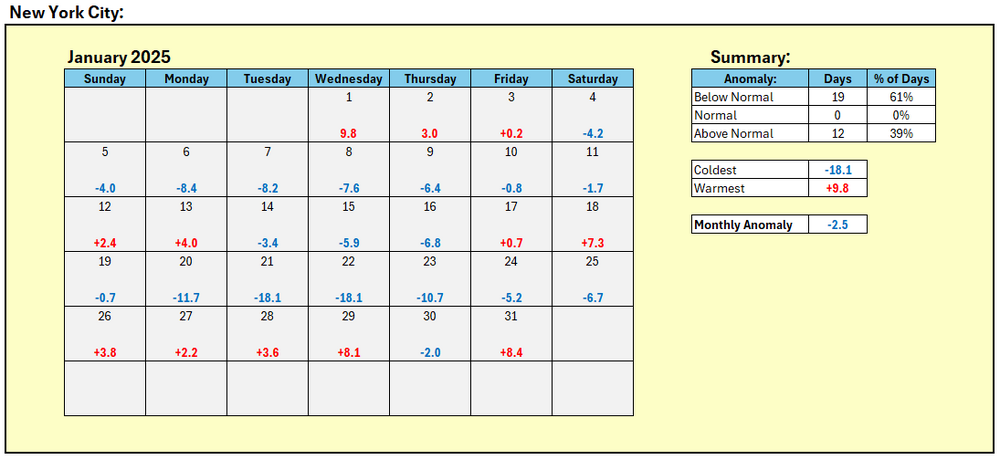
Correction, it was 2.5° below normal. 0.6° below normal against both earlier baselines.
-
White Plains doesn't measure snow, so there is no total snowfall.
-
Although New York City (0.61") just missed its record for least January precipitation, LaGuardia Airport tied its record and White Plains set a new record.
-
NYC was 2.5° below normal. The mean temperature of 31.2° was 1.1° below the 1901-2000 January average.
-
Yes it was.
-
February 2015 had the second lowest monthly mean temperature. It also occurred during a warmer month and warmer climate.
-
9.1 below normal.
-
Allan is using 1988-89. He's referring to February 1989. The two storms were: February 17-19, 1989: Raleigh: 6.2"; Norfolk: 15.4"; New York City: None February 23-24, 1989: Raleigh: 4.9"; Norfolk: 9.0"; New York City: None
-
January 1977 had a -9.4° anomaly at JFK.
-
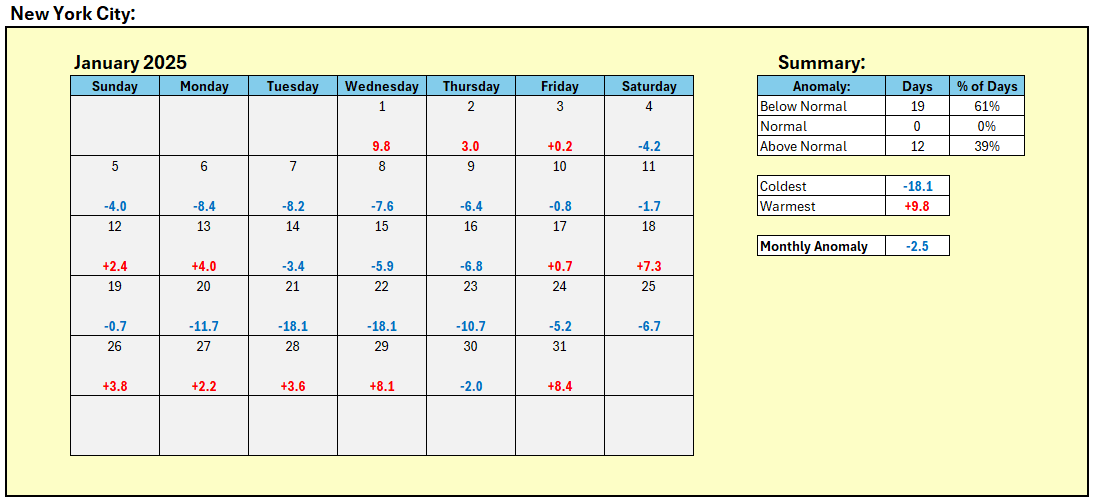
January 2025 is concluding with a mean temperature of 31.2° (2.5° below normal). That is New York City's coldest January since January 2022. January 2022 had a mean temperature of 30.3°. January 2022 was far snowier with 15.3" monthly snowfall in New York City vs. 2025's 3.0". In contrast, January 2024 (2.3") and January 2023 (Trace) saw even less snowfall than January 2025. In fact, five of the six past years have seen less snowfall in New York City than January 2025. The first few days of February will see cooler readings, but moderation will follow after the coming weekend. Overall, February will likely wind up on the warmer side of normal. It will also likely be wetter than normal. The AO is now positive and is expected to remain predominantly positive through at least the first week of February. Since 1950, just 2 of 19 (11%) of storms with an AO of +2.000 or above during January 15-February 15 saw 6" or more of snow in New York City. In addition, the NAO is likely to remain at +1.000 or above through the first two weeks of February. Since 1950, just 1 of 18 (6%) of storms with an NAO of +0.900 or above saw 6" or more snow in New York City. That storm occurred with an AO of -1.769. As a result, prospects for a 6" or above snowstorm in the New York City area will likely be limited through the first two weeks of February. The ENSO Region 1+2 anomaly was -0.4°C and the Region 3.4 anomaly was -0.9°C for the week centered around January 22. For the past six weeks, the ENSO Region 1+2 anomaly has averaged -0.08°C and the ENSO Region 3.4 anomaly has averaged -0.80°C. La Niña conditions are underway and will likely persist into the start of spring. The SOI was +17.29 yesterday. The preliminary Arctic Oscillation (AO) was +0.448 today.
-
The main point I was making is that the betting figure is speculation. It's interesting to see what others are thinking, but it doesn't offer much insight.