donsutherland1
-
Posts
21,074 -
Joined
Content Type
Profiles
Blogs
Forums
American Weather
Media Demo
Store
Gallery
Everything posted by donsutherland1
-
Occasional Thoughts on Climate Change
donsutherland1 replied to donsutherland1's topic in Climate Change
The Raleigh-Durham Airport temperature has been warming in line with the data at the Durham 11W USCRN site, which would rule out a largely UHI expansion argument. However, records for the common reference period only go back to 2008, so more data is needed for greater confidence. -
A comfortably warm day with low humidity is concluding. More such days lie ahead. Much of this week will feature refreshing temperatures and low humidity. Temperatures will mainly top out in the middle and upper 70s. Fair weather should persist through Friday. Showers are possible on Saturday. Overall, the first week of September will likely wind up somewhat cooler than normal. A ridge in the West, trough in the East pattern could persist into the second week of the month allowing for additional cooler than normal days. As a result, parts of the West that just went through their hottest summer on record could remain abnormally warm through the first half of the month. As extreme heat spreads back into the Pacific Northwest this week, Portland could tie or break its record for latest 100° day on record. Salem will likely reach 100° on one or two days, which would break the annual record of 7 100° or above days that was set in 1988. The ENSO Region 1+2 anomaly was -0.5°C and the Region 3.4 anomaly was -0.2°C for the week centered around August 28. For the past six weeks, the ENSO Region 1+2 anomaly has averaged -0.35°C and the ENSO Region 3.4 anomaly has averaged -0.07°C. Neutral ENSO conditions will likely evolve into a La Niña event during the fall. The SOI was +9.03 today. The preliminary Arctic Oscillation (AO) was +0.471 today.
-
A cold front was moving across eastern Long Island early this evening. Behind it, much of the week will feature refreshing temperatures and low humidity. Temperatures will mainly top out in the middle and upper 70s. Overall, the first week of September will likely wind up somewhat cooler than normal. A ridge in the West, trough in the East pattern could persist into the second week of the month allowing for more cooler than normal days. As a result, parts of the West that just went through their hottest summer on record could remain abnormally warm through the first half of the month. Just today, Blythe, CA reached 110° for the 69th time this year. That broke the record of 68 days that was set in 2020. The ENSO Region 1+2 anomaly was -0.3°C and the Region 3.4 anomaly was 0.0°C for the week centered around August 21. For the past six weeks, the ENSO Region 1+2 anomaly has averaged -0.35°C and the ENSO Region 3.4 anomaly has averaged 0.00°C. Neutral ENSO conditions will likely evolve into a La Niña event during the fall. The SOI was +21.34 today. The preliminary Arctic Oscillation (AO) was +0.914 today.
- 1,154 replies
-
- 1
-

-
- tropics
- heavy rainfall
- (and 3 more)
-
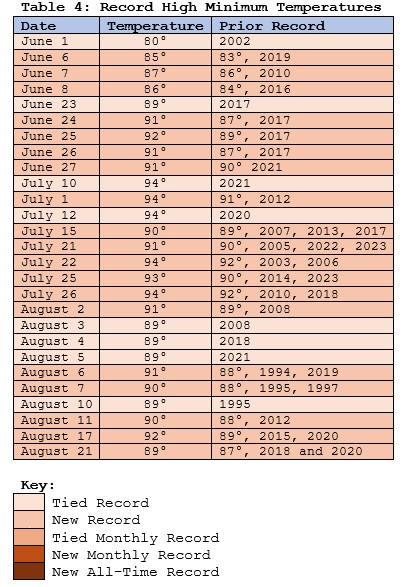
After a brief hiatus following three consecutive record hot summers (2016-2018), Las Vegas demolished its summer heat record. Summer 2024 got off to a blistering start with its hottest June on record. July became that City’s hottest month on record. August also became its hottest August on record. July featured a 12-day extreme heat event (Clarke et al., 2014 methodology) during which the temperature reached or exceed 115° on a record seven consecutive days. That extreme heat event was highlighted by Las Vegas’ hottest reading on record (120°) and three other temperatures that surpassed the old all-time mark of 117°. On account of the historic heat, Las Vegas saw its longest stretches of 80° or above lows, 105° or above highs, 110° or above highs, and 115° or above highs: 80° or above lows: 63 days, June 21-August 22; old record: 33 days, July 4-August 5, 2020 105° or above highs: 43 days, June 20-August 1; old record: 25 days, June 15-July 9, 2017 110° or above highs: 11 days, July 3-13; old record: 10 days, June 17-26, 1961 and July 14-23, 2023 115° or above high: 7 days, July 6-12; old record: 4 days, July 16-19, 2005 Anthropogenic climate change amplified by the urban heat island effect is driving a warming of Las Vegas’ summers. The warming has accelerated in recent decades. Between 1950 and 2023, summers have warmed by 0.8° per decade in Las Vegas. Since 1980, summers have warmed by 1.0° per decade. Select highlights:
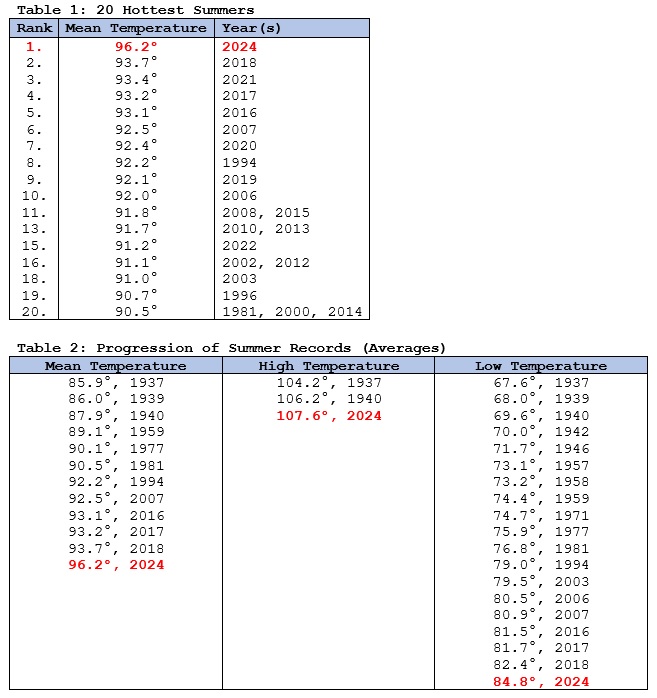
-
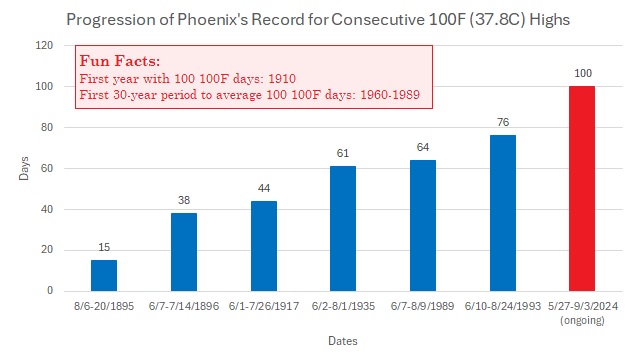
In what has become a seemingly regular occurrence beginning in 2020, Phoenix has experienced its hottest summer on record. Since 2020, Phoenix has eclipsed the summer mark in 2020, 2023, and again this year. A major theme, as was the case in 2020 and 2023 when the heat set in, was its persistence. Summer 2024 got off to a blazing start with its hottest June, by far, on record. The sizzling June was followed by Phoenix’s second hottest July and second hottest month on record. July featured an 11-day extreme heat event (Clarke et al., 2014 methodology) during which the temperature reached or exceed 115° on six days. That was the second longest such event on record. Summer concluded with the third hottest August on record. On account of the historic heat, Phoenix saw its longest stretches of 80° or above lows, 100° or above highs, and 105° or above highs: 80° or above lows: 74 days, June 5-August 17; old record: 51 days, July 1-August 20, 2023 100° or above highs: 97 days (as of August 31 and ongoing); old record: 76 days, June 10-August 24, 1993 105° or above highs: 63 days, June 5-August 6; old record: 56 days, June 24-August 18, 2023 Anthropogenic climate change amplified by the urban heat island effect is driving a warming of Arizona’s and Phoenix's summers. Data from a joint May 2024 report published by Climate Central, Red Cross Red Crescent Climate Centre and World Weather Attribution revealed that the influence of climate change has resulted in a 231.1% increase in Arizona’s days with temperatures above the 90th percentile (1991-2020 baseline) over the figure expected without the influence of climate change. The warming has accelerated in recent decades. Between 1950 and 2023, summers have warmed by 0.6° per decade in Phoenix. Since 1980, summers have warmed by 0.9° per decade. As a result, Phoenix has set summer records in 2020, 2023, and now 2024. As a result, the annual number of days on which the high temperature has exceeded the 90th percentile for summer maximum readings (1991-2020 baseline) has increased from 6.5 days during 1961-1990 to 9.99 days during 1991-2020. The most recent 30-year moving average (1995-2024) is 12.7 such days per year (through August 31, 2024). Select highlights: Updates: Phoenix records 100th 80° low temperature of the year Progression of Phoenix's Record Streak of 100° Highs Phoenix and Surrounding Area 100° Highs and 80° Lows U.S. Sites with 110 or More Consecutive 100° Highs and Population Hottest Last 7 Days of September Phoenix Experiences its Hottest September on Record Phoenix's Extreme September 28th and October 1st High Temperatures Phoenix Experiences its Hottest First Week of October on Record Phoenix Sets or Ties Daily High Temperature Records on an Unprecedented 21 Consecutive Days Climate Change not the Urban Heat Island Effect drove Phoenix's Record Autumn Heatwave Southwest Region Summer Trends Phoenix Follows its Hottest Summer with its Warmest Fall on Record Phoenix Caps Off its Warmest Year with Its Warmest December on Record
-
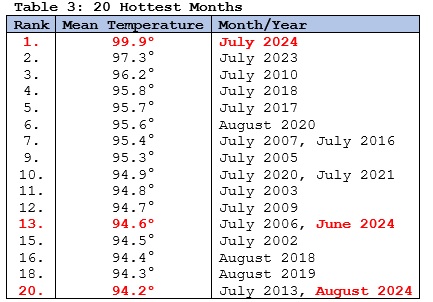
August Daily Temperature Summary:
-
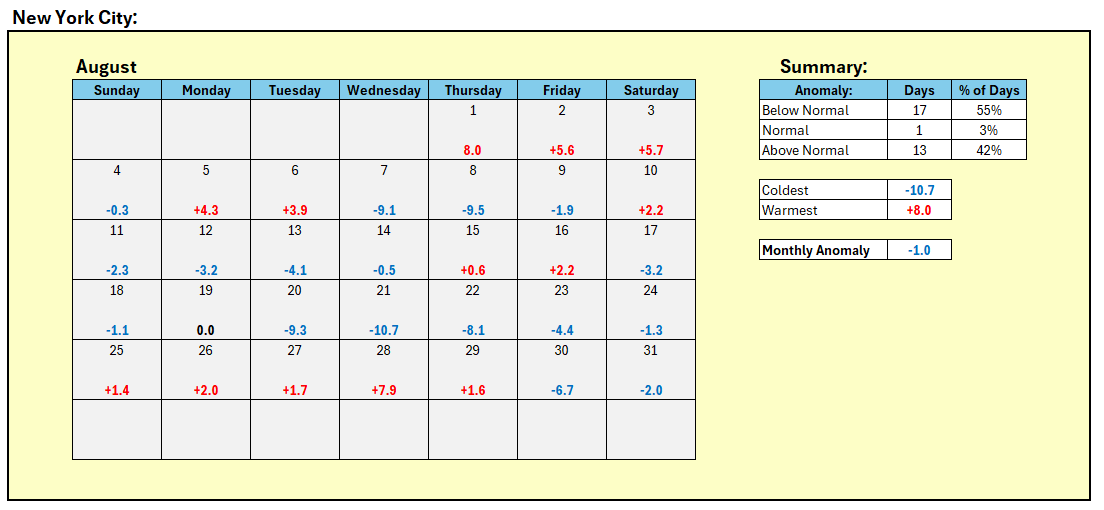
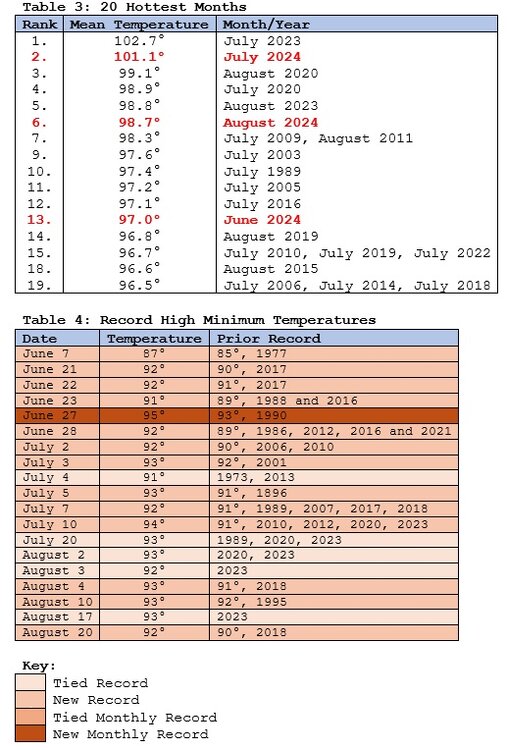
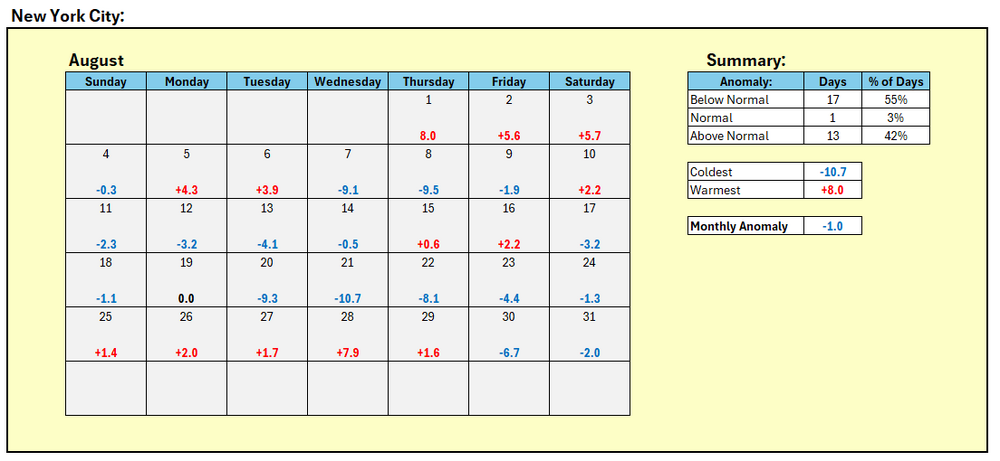
August finished with a mean temperature of 75.1° in New York City. That was 1.0° below normal. That ended a streak of 8 consecutive warmer than normal months. Out West, a historically hot summer is concluding. Phoenix reached 100° for the 92nd time this summer making summer 2024 the first summer on record where every high temperature was 100° or above. Fresno, Las Vegas, Needles, Palm Springs, and Phoenix are among cities registering their hottest summer on record. Showers and thundershowers are likely tonight into tomorrow. High temperatures will generally reach the upper 70s and lower 80s, but a few locations could top out in the middle 80s. Another shot of cooler air will arrive early next week. Afterward, high temperatures will mainly reach the middle and upper 70s. Overall, the first week of September will likely wind up somewhat cooler than normal. Moreover, it is somewhat more likely than not that September could wind up becoming New York City's second consecutive cooler than normal month. The last time New York City saw two consecutive cooler than normal months was May-June 2023. The ENSO Region 1+2 anomaly was -0.3°C and the Region 3.4 anomaly was 0.0°C for the week centered around August 21. For the past six weeks, the ENSO Region 1+2 anomaly has averaged -0.35°C and the ENSO Region 3.4 anomaly has averaged 0.00°C. Neutral ENSO conditions will likely evolve into a La Niña event during the fall. The SOI was +22.03 today. The preliminary Arctic Oscillation (AO) was +1.186 today.
- 1,764 replies
-
- 5
-
-

-
- hurricanes
- tropics
- (and 5 more)
-
DCA _ NYC _ BOS __ ORD _ ATL _ IAH __ DEN _ PHX _ SEA 0.0 -0.1 -0.1 0.8 0.5 0.5 1.8 2.5 2.7
-
Thank you for the kind words.
- 1,764 replies
-
- 1
-
-
- hurricanes
- tropics
- (and 5 more)
-
Highs will reach the upper 70s to lower 80s during the weekend. A shower or thunderstorm is likely tomorrow evening and tomorrow night. Sunday could be the warmest day with some locations reaching the middle 80s, but another shot of cooler air will arrive early next week. Overall, the first week of September will likely wind up somewhat cooler than normal. The ENSO Region 1+2 anomaly was -0.3°C and the Region 3.4 anomaly was 0.0°C for the week centered around August 21. For the past six weeks, the ENSO Region 1+2 anomaly has averaged -0.35°C and the ENSO Region 3.4 anomaly has averaged 0.00°C. Neutral ENSO conditions will likely evolve into a La Niña event during the fall. The SOI was +10.14 yesterday. The preliminary Arctic Oscillation (AO) was +1.368 today. Based on sensitivity analysis applied to the latest guidance, there is an implied near 100% probability that New York City will have a cooler than normal August (1991-2020 normal). August will likely finish with a mean temperature near 75.1° (1.0° below normal).
- 1,764 replies
-
- 1
-
-
- hurricanes
- tropics
- (and 5 more)
-
Arctic Sea Ice Extent, Area, and Volume
donsutherland1 replied to ORH_wxman's topic in Climate Change
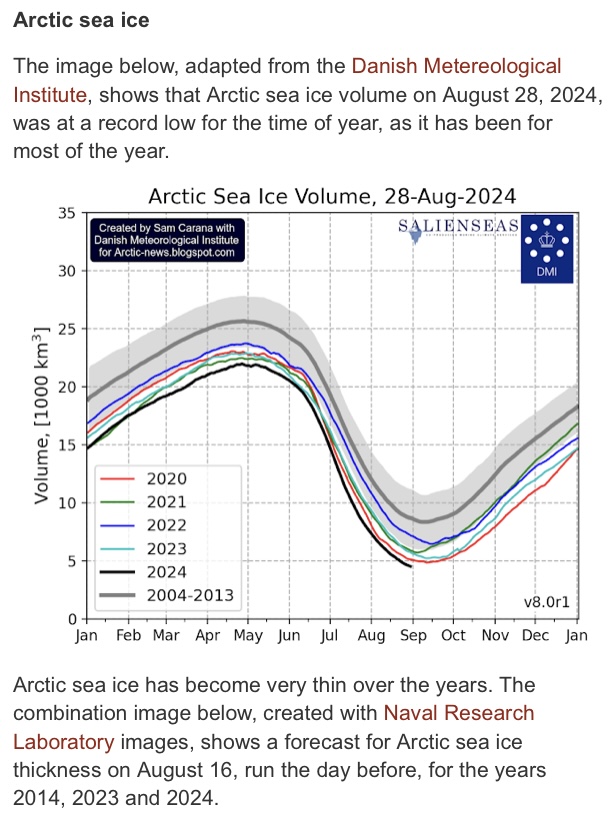
From the latest Arctic News blog: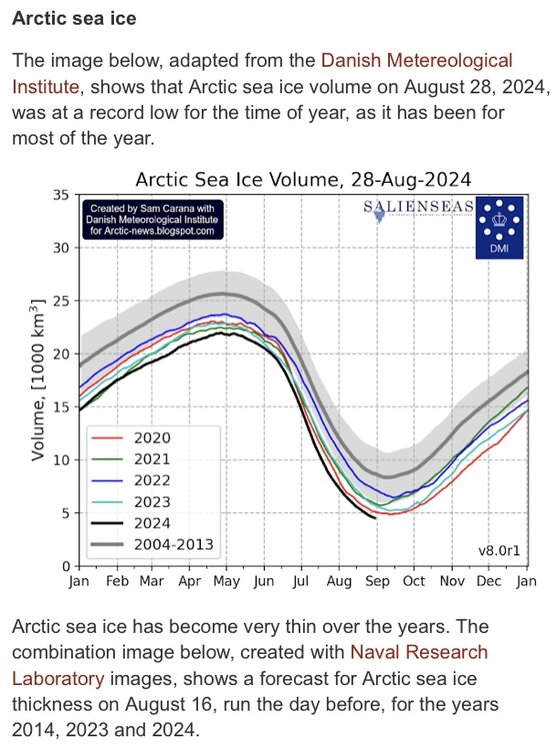
-
A fresh shot of Canadian air began overspreading the region last night. The cooler air will remain in place to close out the month. Highs will again reach the middle and upper 70s tomorrow and then the upper 70s to lower 80s during the weekend. Sunday could be the warmest day with some locations reaching the middle 80s, but another shot of cooler air will arrive early next week. Overall, the first week of September will likely wind up somewhat cooler than normal. The ENSO Region 1+2 anomaly was -0.3°C and the Region 3.4 anomaly was 0.0°C for the week centered around August 21. For the past six weeks, the ENSO Region 1+2 anomaly has averaged -0.35°C and the ENSO Region 3.4 anomaly has averaged 0.00°C. Neutral ENSO conditions will likely evolve into a La Niña event during the fall. The SOI was +13.17 yesterday. The preliminary Arctic Oscillation (AO) was +1.488 today. Based on sensitivity analysis applied to the latest guidance, there is an implied near 100% probability that New York City will have a cooler than normal August (1991-2020 normal). August will likely finish with a mean temperature near 75.1° (1.0° below normal).
- 1,764 replies
-
- 1
-
-
- hurricanes
- tropics
- (and 5 more)
-
Arctic Sea Ice Extent, Area, and Volume
donsutherland1 replied to ORH_wxman's topic in Climate Change
Total nonsense. He shifted the goalposts (evaded the actual issue) and then blocked me so that I couldn’t reply. In fact, it turns out he is a serial spreader of disinformation. Examples: Atlantic Cooling: https://factcheck.afp.com/doc.afp.com.36EV7CC Sea level rise: https://factcheck.afp.com/doc.afp.com.34ZB4RX Arctic sea ice: https://factcheck.afp.com/doc.afp.com.34QL9NW With three fact checks by AFP for posted disinformation, Martz is in elite company. Numbers through August 28, 2024: P.S. His conduct has not gone unnoticed by NWS and private sector meteorologists, a number of whom he attacked at various times. That's not a good way to earn trust among prospective colleagues (something some have told him to little avail).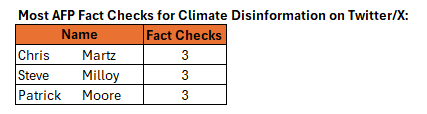
-
Probably near normal snowfall in the Detroit area.
-
When I mention lack of skill, I am referring to forecasting for two specific locations (Raleigh and Richmond) for a specific month. I do think the odds favor a warmer than normal winter in much of the East given the likely state of ENSO, PDO, and long-term warming, etc. Aside from New England, I also lean toward below normal snowfall. New England may do better than it has during the last two winters. A lot can still change, but that's my early thinking.
-
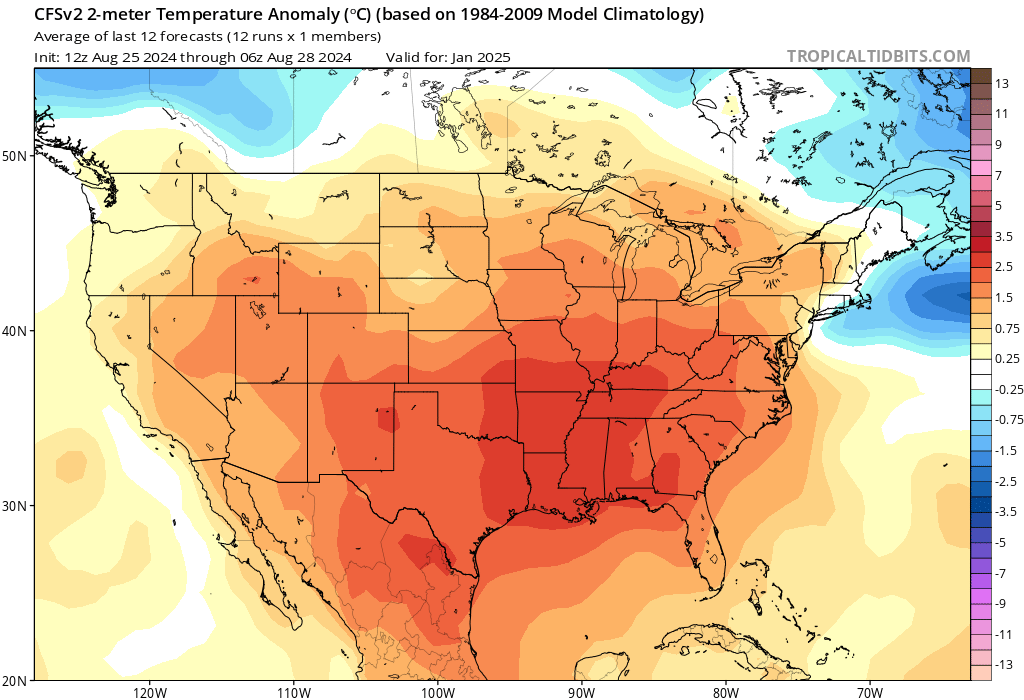
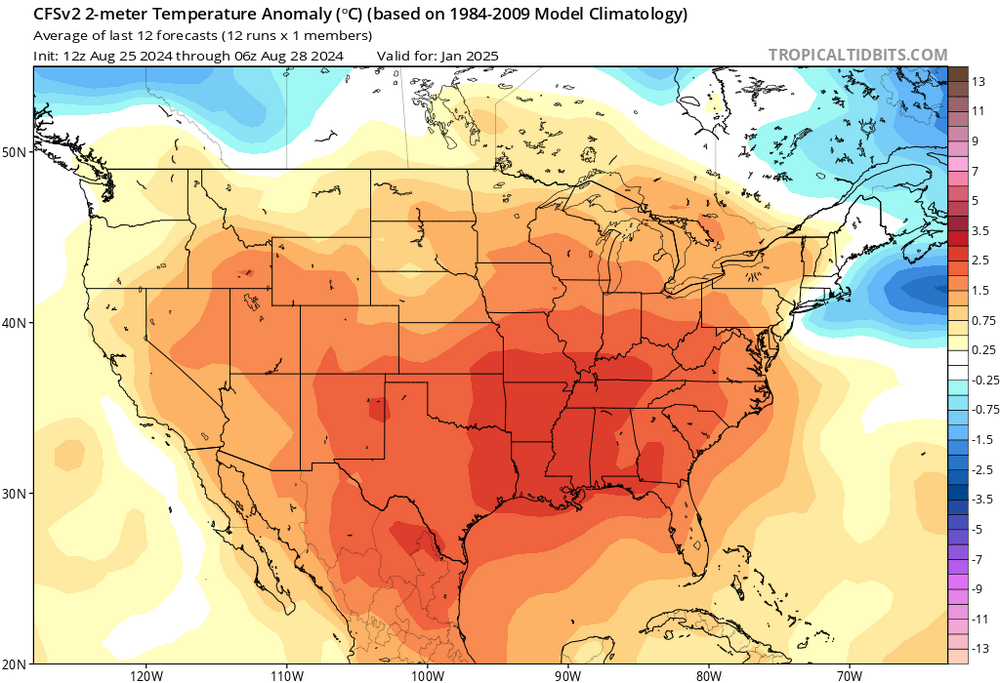
We agree concerning the WB CFS maps. In fact, the above map shows a -7C anomaly in Richmond. Only two January cases (1940 and 1977) would satisfy what the map shows. It shows a -7.5C anomaly for Raleigh. Only January 1977 would fit that criteria. Winters have warmed considerably since 1977, much less 1940. While I can't say with any confidence that January 2025 would be colder or warmer than normal from this far out (no meaningful skill exists at that timeframe), I can state with reasonable confidence that January 2025 will not come close to what the map is showing. Moreover, given the ENSO forecast and likely negative PDO, I suspect that the map shown on Tropical Tidbits will probably be closer to reality. But we'll see once we get closer to January. Having said that, I don't think its prudent to speculate on the basis of any of the maps right now, aside from stating that the kind of extreme cold shown on the WB map is not likely to verify.
-
The temperature rose to 91° in New York City and Islip and 95° at Newark. Further south, it was even hotter. Washington, DC saw the mercury reach 100°. However, the heat will break after today. A fresh shot of Canadian air will arrive overnight to close out the month. Following the frontal passage, highs will reach the middle and upper 70s tomorrow and Friday and then the upper 70s to lower 80s during the weekend. The ENSO Region 1+2 anomaly was -0.3°C and the Region 3.4 anomaly was 0.0°C for the week centered around August 21. For the past six weeks, the ENSO Region 1+2 anomaly has averaged -0.35°C and the ENSO Region 3.4 anomaly has averaged 0.00°C. Neutral ENSO conditions will likely evolve into a La Niña event during the fall. The SOI was +19.36 yesterday. The preliminary Arctic Oscillation (AO) was +1.718 today. Based on sensitivity analysis applied to the latest guidance, there is an implied 98% probability that New York City will have a cooler than normal August (1991-2020 normal). August will likely finish with a mean temperature near 75.0° (1.1° below normal).
-
Arctic Sea Ice Extent, Area, and Volume
donsutherland1 replied to ORH_wxman's topic in Climate Change
Yesterday, Arctic sea ice extent fell to the third lowest for August 27th on JAXA. At present, it appears that 2024 will become the fourth year to record a minimum figure under 4 million square kilometers. 2012, 2019, and 2020 are the other years with minimum figures below 4 million square kilometers. The decline despite less than hostile conditions illustrates the importance of thickness. Thin ice melts out more easily. Winter recovery means little if the ice remains thin. Climate change deniers often point to winter ice recovery to make bold and ultimately futile claims that Arctic sea ice is recovering. One such example was fact checked back in May, and now looks even more foolish in light of the most recent data. https://factcheck.afp.com/doc.afp.com.34QL9NW -
The temperature rose to 86° in New York City and 87° at Newark. Tomorrow will be even warmer as an air mass that brought the temperature to a record 99° in Chicago comes eastward. The temperature could soar to 90° or above as far north as southern New England. It is likely that Baltimore and Washington, DC will reach heatwave status as the mercury rises into the upper 90s and approaches 100°. A fresh shot of Canadian air will arrive late in the week to close out the month. Following the frontal passage, highs will reach the middle and upper 70s. The ENSO Region 1+2 anomaly was -0.3°C and the Region 3.4 anomaly was 0.0°C for the week centered around August 21. For the past six weeks, the ENSO Region 1+2 anomaly has averaged -0.35°C and the ENSO Region 3.4 anomaly has averaged 0.00°C. Neutral ENSO conditions will likely evolve into a La Niña event during the fall. The SOI was +22.09 yesterday. The preliminary Arctic Oscillation (AO) was +1.801 today. Based on sensitivity analysis applied to the latest guidance, there is an implied 96% probability that New York City will have a cooler than normal August (1991-2020 normal). August will likely finish with a mean temperature near 75.0° (1.1° below normal).
- 1,764 replies
-
- 1
-
-
- hurricanes
- tropics
- (and 5 more)
-
The first half of the week will likely see above to occasionally much above normal readings. It is likely that Baltimore and Washington, DC could experience a heatwave. The temperature could even approach or reach 90° on Wednesday in New York City. A fresh shot of Canadian air will arrive late in the week to close out the month. Following the frontal passage, highs will reach the middle and upper 70s. The ENSO Region 1+2 anomaly was -0.3°C and the Region 3.4 anomaly was 0.0°C for the week centered around August 21. For the past six weeks, the ENSO Region 1+2 anomaly has averaged -0.35°C and the ENSO Region 3.4 anomaly has averaged 0.00°C. Neutral ENSO conditions will likely evolve into a La Niña event during the fall. The SOI was +22.09 today. The preliminary Arctic Oscillation (AO) was +2.220 today. Based on sensitivity analysis applied to the latest guidance, there is an implied 92% probability that New York City will have a cooler than normal August (1991-2020 normal). August will likely finish with a mean temperature near 75.0° (1.1° below normal).
- 1,764 replies
-
- 1
-
-
- hurricanes
- tropics
- (and 5 more)
-
Report: Another Year of Record Heat for the Oceans
donsutherland1 replied to donsutherland1's topic in Climate Change
I don't believe he cares. He seems to increasingly push data whether accurate or not to support his narrative, which is usually incorrect. Indeed, he's downplaying what has likely been a top 10 or perhaps even top 5 hottest summer for the U.S. as being "no big deal." On the sea surface temperatures issue, he has been corrected multiple times. If his geothermal idea had any merit--and it doesn't--the warming would be occurring from the bottom up, not top down. -
The first half of the week will likely see above to occasionally much above normal readings. It is likely that Baltimore and Washington, DC could experience a heatwave. The temperature could even approach or reach 90° on Wednesday in New York City. A fresh shot of Canadian air will likely arrive late in the week to close out the month. Following the frontal passage, highs will reach the middle and upper 70s. The ENSO Region 1+2 anomaly was 0.0°C and the Region 3.4 anomaly was -0.1°C for the week centered around August 14. For the past six weeks, the ENSO Region 1+2 anomaly has averaged -0.33°C and the ENSO Region 3.4 anomaly has averaged +0.05°C. Neutral ENSO conditions will likely evolve into a La Niña event during the fall. The SOI was +8.92 today. The preliminary Arctic Oscillation (AO) was +2.335 today. Based on sensitivity analysis applied to the latest guidance, there is an implied 83% probability that New York City will have a cooler than normal August (1991-2020 normal). August will likely finish with a mean temperature near 75.1° (1.0° below normal).
-
Temperatures will top out mainly in the lower and middle 80s through the remainder of August. It is possible that Baltimore and Washington, DC could see some 90° readings. A fresh shot of Canadian air could arrive to close the month. Out West, cities such as Flagstaff, Las Vegas, and Phoenix remain on track for their hottest summer on record. Del Rio is in the midst of its record third extreme heat event (Clarke et al., 2014 framework) of the year. However, the heat began to fade in Texas after setting monthly and even all-time records. Amarillo reached a daily record 105° (old record: 103°, 1922, 1973 and 2011), its 9th consecutive 100° day. That broke the record of 8 days that was set during June 12-19, 1924 and tied during June 22-29, 1998. The previous longest August stretch of 7 consecutive days occurred during August 9-15, 1936. The ENSO Region 1+2 anomaly was 0.0°C and the Region 3.4 anomaly was -0.1°C for the week centered around August 14. For the past six weeks, the ENSO Region 1+2 anomaly has averaged -0.33°C and the ENSO Region 3.4 anomaly has averaged +0.05°C. Neutral ENSO conditions will likely evolve into a La Niña event during the fall. The SOI was +7.46 today. The preliminary Arctic Oscillation (AO) was +2.548 today. Based on sensitivity analysis applied to the latest guidance, there is an implied 81% probability that New York City will have a cooler than normal August (1991-2020 normal). August will likely finish with a mean temperature near 75.0° (1.1° below normal).
-
A warmer pattern will develop during the weekend. Afterward, highs will top out mainly in the lower and middle 80s through the remainder of August. Out West, cities such as Flagstaff, Las Vegas, and Phoenix remain on track for their hottest summer on record. Del Rio is in the midst of its record third extreme heat event (Clarke et al., 2014 framework) of the year. High temperature records fell in parts of Texas. Highs included: Abilene: 112° (old record: 104°, 1943 and 2010) Amarillo: 107° (old record: 102°, 1973 and 2011) Del Rio: 108° (old record: 106°, 1917) San Angelo: 108° (tied record set in 2010) Today was Abilene's fourth consecutive 109° or above high temperature. That is the longest such streak on record. The old record of three consecutive days was set during July 18-20, 2022. It was also Abilene's third consecutive 111° or above day. Prior to the current heatwave, Abilene's only 111° day had occurred on August 17, 2023. Records go back to September 1885. Las Vegas saw its record 63-day streak of 80° or above low temperatures end. The prior record was 33 consecutive days. The ENSO Region 1+2 anomaly was 0.0°C and the Region 3.4 anomaly was -0.1°C for the week centered around August 14. For the past six weeks, the ENSO Region 1+2 anomaly has averaged -0.33°C and the ENSO Region 3.4 anomaly has averaged +0.05°C. Neutral ENSO conditions will likely evolve into a La Niña event during the fall. The SOI was +16.20 today. The preliminary Arctic Oscillation (AO) was +2.656 today. Based on sensitivity analysis applied to the latest guidance, there is an implied 78% probability that New York City will have a cooler than normal August (1991-2020 normal). August will likely finish with a mean temperature near 75.1° (1.0° below normal).
- 1,764 replies
-
- 1
-
-
- hurricanes
- tropics
- (and 5 more)