donsutherland1
-
Posts
21,074 -
Joined
Content Type
Profiles
Blogs
Forums
American Weather
Media Demo
Store
Gallery
Everything posted by donsutherland1
-
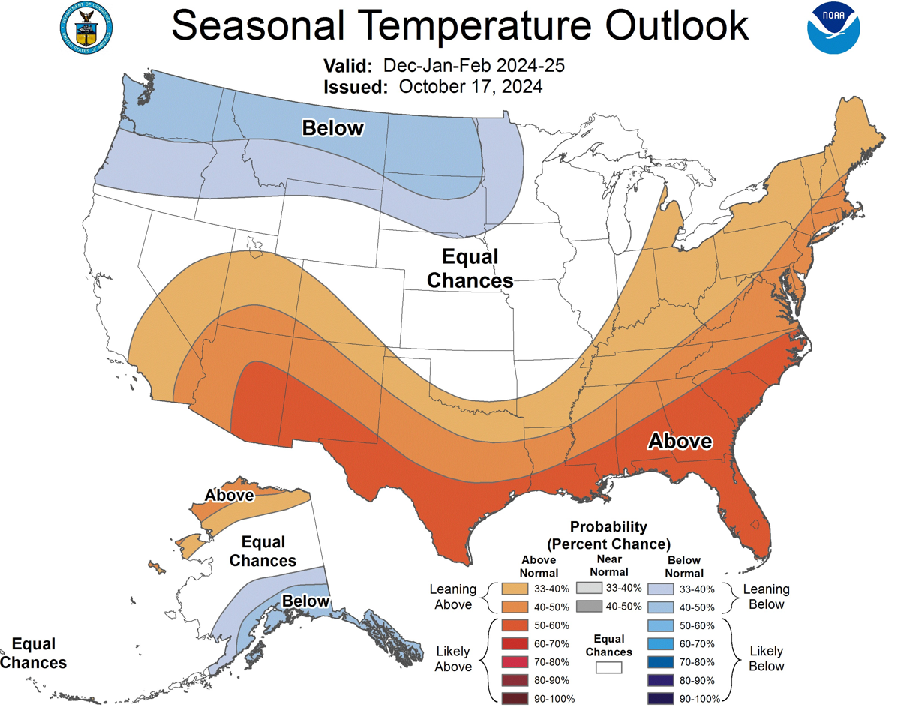
The just-released CPC winter outlook seems to be more in line with what I'm thinking than the ECMWF seasonal forecast, particularly for the Great Lakes Region.

-
I agree. The growing coverage of extraordinary heat--in this case, an unprecedented autumn heatwave with nothing comparable in the U.S. climate record--has made it very difficult for those who dismiss or deny AGW to do so with any degree of credibility. Therefore, they desperately invoke issues that seem realistic. But when the data is examined more closely, their bad arguments disintegrate.
-
Given how flawed the maps are and how obvious the flaws are when the maps are compared to those from other sources, it is almost inexplicable that WB hasn't tried to fix the problem.
-
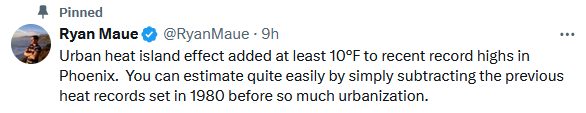
With Phoenix's unprecedented autumn heatwave now in the books, some are trying to rewrite what happened in order to minimize the nature and magnitude of what took place. The above post might seem informative. It isn't. It is an attempt to essentially erase the record-breaking nature of the heat. Phoenix broke its October high temperature record by 7°. That old record was set in 1980 and tied in 2020. Subtract 10°, and suddenly the 2024 heatwave loses its record-breaking outcome. Now for some facts: 1. Urban Heat Island (UHI) Effect is real. However, its largest impact is at night. 2. An attribution study that covered Phoenix during June-July 2023 (when the City saw a record 31 consecutive 110° days) found that the heat was "virtually impossible" without climate change and that climate change had made the heat 2°C (3.6°F) hotter. Using the attribution study for guidance, that means that 3.6° of the 6° margin by which Phoenix beat the 1980/2020 record or 60% was due to climate change. If one attributed all the rest of the margin to UHI, 40% was due to UHI. 3. If Maue's argument had validity, small locations not subject to UHI would not have set monthly records. In fact, they did. Ajo (Population: 2,922) broke its October record by 4°. Picacho (Population: 289) broke its monthly record by 5°. Tacna (Population: 3,393) broke its October record by 3°. The average margin of record for these three sites that experience no UHI was 4°. Those numbers, which were due completely to climate change, are reasonably in line with the findings of the 2023 attribution study's 3.6° figure. 4. If one looks at the bigger picture, dozens of locations in Arizona and California smashed their October monthly records during the heatwave. In sum, UHI amplifies heat. UHI made Phoenix hotter than it would otherwise have been, but the exceptional heat was not solely or largely an artifact of UHI. The heat was driven by climate change (otherwise small population areas would not have been smashing monthly records). Even without UHI, based on the attribution study and experience of small population sites, Phoenix would have set a new October record (probably topping out at 110°-111° vs. 113°). The heat would still have been unprecedented for the season, both for its magnitude and its persistence.
-
Thanks to unrelenting marine heatwaves, San Juan has had 120 80° or above low temperatures this year. Last year, which set the prior record, the mark was 89 days. Before 2023, the record stood at 59 days (2009). So, the record has been more than doubled in just two years.
-
I suspect that this winter will see more variability than the last two. December might actually do well for snowfall in the Great Lakes region with a storm track that cuts toward and east of the Lakes. Some La Niña events have seen healthy snowfall from Chicago to Toronto in December. The long range modeling (but lowest skill at the timeframes concerned) seems to hint at more opportunities for cold outbreaks and snowfall in the CONUS/southern Canada during February into March. I think the big question right now concerns the degree of blocking that will develop. That really can't be forecast reliably at long timeframes (even AO+/NAO+ winters can still have one or two good episodes of blocking and if the blocking is timed with an active jet, opportunities for snowfall can exist). For now, I still think the Great Lakes region will see near normal to somewhat above normal snowfall (around 45" in Detroit), even as temperatures are somewhat warmer than normal. The same applies for Chicago and Toronto. The Mid-Atlantic and New England regions will probably be below normal with snowfall (lower precipitation even as the winter isn't as warm as the last two), but not as bad as the last two winters. Boston will probably end its record slump where it hasn't received 4" or more daily snowfall (964 consecutive days through today). The Northern Plains/Northern Rockies probably have the best chance in the CONUS of being colder than normal. Western Canada could be cold especially as the PDO- is likely to persist.
-
Overnight, low temperatures will again fall into the lower 40s in New York City and 30s outside the City where frost is likely. The mercury will recover to the upper 50s tomorrow and then lower and middle 60s on Friday. The warming trend will continue during the weekend. With a PNA-/AO+ pattern forecast to develop, an above normal temperature regime could last into the closing days of October. The probability of a 60° October mean temperature in New York City has increased to just over 40%. Since 2020, 2021 (62.0°) and 2023 (60.5°) have seen such warmth. Since regular recordkeeping began in 1869, New York City has only seen two consecutive 60° or warmer Octobers on three occasions: 1946-1947, 1949-1950, and 1953-1954. Precipitation in the northern Mid-Atlantic region will likely remain below to much below normal into at least the fourth week of October. The ECMWF ensembles, along with the experimental AIFS and FuXi AI versions continue to show very little precipitation. There is a possibility that October 2024 could see less than 1.00" monthly rainfall in New York City for the first October since 2013 and that Philadelphia could see its second consecutive October with less than 1.00" of rain. As a result, D0 and D1 conditions will likely continue to expand in the region and the pocket of D2 conditions in southern New Jersey will likely grow. The NAO fell to a preliminary -2.751 on September 24th (all-time September record: -2.371, September 12, 1971). That was the 9th lowest value on record. La Niña winters following September cases where the NAO fell to -1.900 or below featured a predominantly positive NAO. The most recent such winters were 2016-2017 and 2022-2023. The mean temperatures for those winters in New York City were 39.3° and 41.0° respectively. The 1991-2020 normal value is 36.2°. A warmer outcome is favored by the October run of the C3S multi-model forecast for Winter 2024-2025. Weekly ENSO data remains unavailable due to the disruptive impact Hurricane Helene's floods had on NCEI in Asheville. The ENSO Region 1+2 anomaly was +0.2°C and the Region 3.4 anomaly was -0.5°C for the week centered around September 18. For the past six weeks, the ENSO Region 1+2 anomaly has averaged -0.20°C and the ENSO Region 3.4 anomaly has averaged -0.18°C. Neutral ENSO conditions will likely evolve into a La Niña event during the fall. The SOI was -11.86 today. The preliminary Arctic Oscillation (AO) was +0.290 today. Based on sensitivity analysis applied to the latest guidance, there is an implied 72% probability that New York City will have a warmer than normal October (1991-2020 normal). October will likely finish with a mean temperature near 59.5° (1.6° above normal).
-
Occasional Thoughts on Climate Change
donsutherland1 replied to donsutherland1's topic in Climate Change
I don’t have access to the algorithms where the discontinuities are removed for purposes of the national climate record. -
Occasional Thoughts on Climate Change
donsutherland1 replied to donsutherland1's topic in Climate Change
From reading Roger's response and the initial post (Maue's post) to which he responded, I don't believe Roger was seeking to cherrypick. He was suggesting that the ongoing warming can be seen in many lines of evidence, including lower troposphere satellite observations. The satellite record he highlighted only goes back to 1980. On a separate note, Maue knows that NOAA homogenization of data removes the urban heat island effect, as he has dealt with the data in creating weather and climate maps. The trends in the adjusted data closely resemble those found in the USCRN network. Thus, there is no basis to his "calculation" that removing such cities as Phoenix from the climate record would have a material impact on the observed warming in the climate record. His comment is puzzling given his knowledge of the datasets and work with them. -
Temperatures will again top out mainly in the lower to middle 50s tomorrow and then the upper 50s on Thursday. Lows will fall into the lower 40s in New York City and 30s outside the City where frost is likely. A warming trend will likely develop during the weekend. With a PNA-/AO+ pattern forecast to develop, the above normal temperature regime could last into the closing days of October. Precipitation in the northern Mid-Atlantic region will likely remain below to much below normal into at least the fourth week of October. The ECMWF ensembles, along with the experimental AIFS and FuXi AI versions continue to show very little precipitation into at least the fourth week of the month. As a result, D0 and D1 conditions will likely continue to expand in the region and the pocket of D2 conditions in southern New Jersey will likely grow. The NAO fell to a preliminary -2.751 on September 24th (all-time September record: -2.371, September 12, 1971). That was the 9th lowest value on record. La Niña winters following September cases where the NAO fell to -1.900 or below featured a predominantly positive NAO. The most recent such winters were 2016-2017 and 2022-2023. The mean temperatures for those winters in New York City were 39.3° and 41.0° respectively. The 1991-2020 normal value is 36.2°. A warmer outcome is favored by the October run of the C3S multi-model forecast for Winter 2024-2025. Weekly ENSO data remains unavailable due to the disruptive impact Hurricane Helene's floods had on NCEI in Asheville. The ENSO Region 1+2 anomaly was +0.2°C and the Region 3.4 anomaly was -0.5°C for the week centered around September 18. For the past six weeks, the ENSO Region 1+2 anomaly has averaged -0.20°C and the ENSO Region 3.4 anomaly has averaged -0.18°C. Neutral ENSO conditions will likely evolve into a La Niña event during the fall. The SOI was -3.42 today. The preliminary Arctic Oscillation (AO) was -0.045 today. Based on sensitivity analysis applied to the latest guidance, there is an implied 67% probability that New York City will have a warmer than normal October (1991-2020 normal). October will likely finish with a mean temperature near 59.0° (1.1° above normal).
-
Occasional Thoughts on Climate Change
donsutherland1 replied to donsutherland1's topic in Climate Change
The recent heat has created problems for some. Now, some are even trying to "disappear" what happened in Phoenix. The above post is misguided: 1. The climate record used for analyzing U.S. and global temperature records utilizes statistical homogenization that eliminates distortions created from Time of Observation Bias, the Urban Heat Island (UHI) Effect, etc. Yet, some who deny climate change e.g., Tony Heller, insist that only raw data should be used. 2. Because homogenization removes the distortions, removing urban sites would have, at best, a negligible impact on the climate record. 3. Warming has been occurring in rural and urban areas alike. Phoenix was not unique in experiencing the unprecedented autumn heatwave that stretched from through the last week of September and through the first week of October. Oceans and the Arctic have also been warming. UHI does not explain global temperature trends. P.S. Notice that despite mention of 'back of envelope calculation," no calculations were provided. The statement is nothing more than a reaction to the high-profile heat event while ignoring that distortions are removed from the climate record.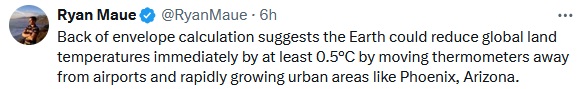
-
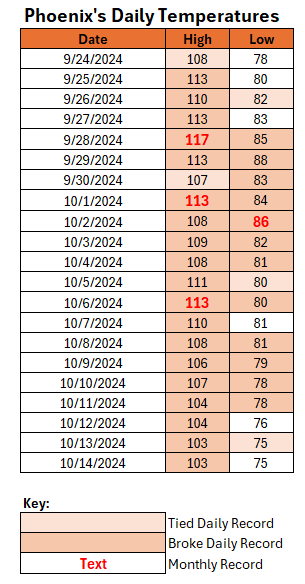
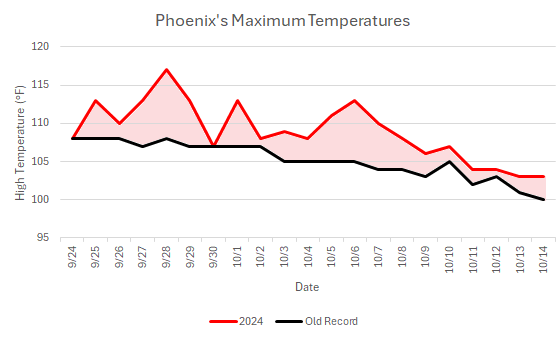
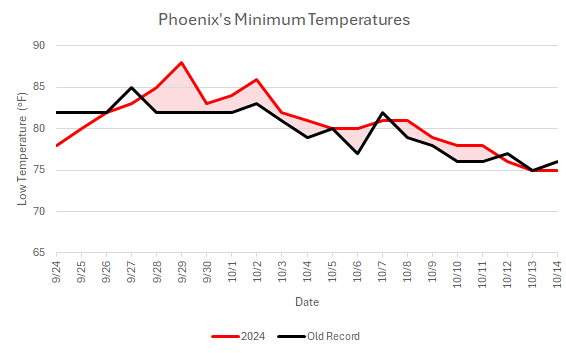
Phoenix saw the temperature soar to 103° on October 14th. That smashed the daily record of 100° that was set in 1973 and tied in 2010, 2015, and 2020. It also concluded a record-obliterating 21-day stretch during which Phoenix tied or broke its daily record high temperatures. The previous U.S. record was 14 consecutive days at Burlington, IA during July 4-17, 1936. That Phoenix has a climate record that goes back to August 1895 makes such a streak particularly mind-boggling. There has never been an autumn heatwave like the one that rewrote a significant portion of Phoenix's autumn record book. The average temperature during the streak was 94.8°. The average high was 109.0° and the average low was 80.7°. Phoenix's average low temperature and mean temperature during this period set new Arizona state records. Phoenix's mean temperature also set a national record for the period. The average daily high temperature broke the daily record by an average of 3.8°. On September 28th, the 117° high temperature set a new September monthly record, tied the August monthly record, and demolished the prior daily mark by 9°. Prior to 2024, the October monthly record was 107°. That record was surpassed on eight consecutive days (October 1-8), with four readings reaching or exceeding 110°.
-
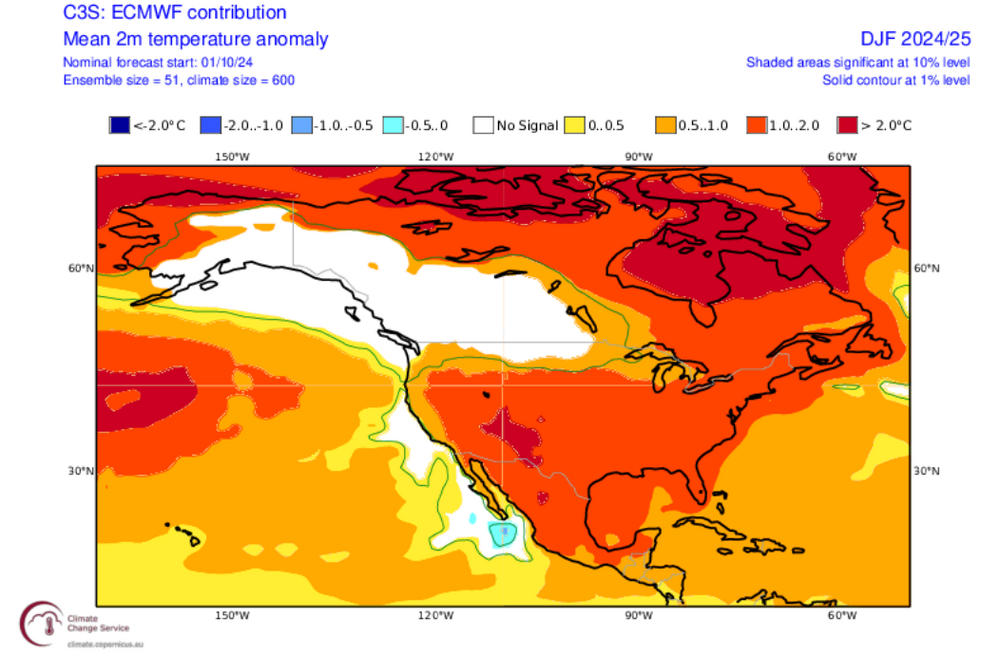
Fortunately, some sizable misses are still possible from this timeframe. For example, the October 2023 ECMWF forecast had most of western Canada 1°C-2°C above normal for February 2024, but the month actually wound up colder than normal in parts of that area. I suspect that there will be some BN anomalies in North America. The most likely areas are those areas shown with near normal readings right now. But that doesn't preclude some cold shots into the warmer areas on a periodic basis. I'm still reasonably optimistic that snowfall will be near normal to somewhat above normal from Chicago to Toronto. On a DJF basis, it was too cold with the Plains States.
-
The coolest air so far this season is now pouring into the region on a gusty breeze. Temperatures will top out mainly in the lower to middle 50s tomorrow and Wednesday and then the upper 50s on Thursday. Lows will fall into the lower 40s in New York City and 30s outside the City where frost is likely. A warming trend could develop during the weekend. Precipitation in the northern Mid-Atlantic region will likely remain below to much below normal into at least the fourth week of October. The ECMWF ensembles, along with the experimental AIFS and FuXi AI versions show very little precipitation into at least the fourth week of the month. As a result, D0 and D1 conditions will likely continue to expand in the region and the pocket of D2 conditions in southern New Jersey will likely grow. The NAO fell to a preliminary -2.751 on September 24th (all-time September record: -2.371, September 12, 1971). That was the 9th lowest value on record. La Niña winters following September cases where the NAO fell to -1.900 or below featured a predominantly positive NAO. The most recent such winters were 2016-2017 and 2022-2023. The mean temperatures for those winters in New York City were 39.3° and 41.0° respectively. The 1991-2020 normal value is 36.2°. A warmer outcome is favored by the October run of the C3S multi-model forecast for Winter 2024-2025. Weekly ENSO data remains unavailable due to the disruptive impact Hurricane Helene's floods had on NCEI in Asheville. The ENSO Region 1+2 anomaly was +0.2°C and the Region 3.4 anomaly was -0.5°C for the week centered around September 18. For the past six weeks, the ENSO Region 1+2 anomaly has averaged -0.20°C and the ENSO Region 3.4 anomaly has averaged -0.18°C. Neutral ENSO conditions will likely evolve into a La Niña event during the fall. The SOI was +3.35 today. The preliminary Arctic Oscillation (AO) was -0.559 today. Based on sensitivity analysis applied to the latest guidance, there is an implied 62% probability that New York City will have a warmer than normal October (1991-2020 normal). October will likely finish with a mean temperature near 58.8° (0.9° above normal).
-
I fixed it. I accidentally pasted the earlier map.
-
Below is a link to the Accuweather winter forecast: https://www.accuweather.com/en/winter-weather/winter-forecast-for-the-us-in-the-2024-25-season/1699821
-
Cooler air will arrive tonight and readings tomorrow will reach the lower and middle 60s in much of the region. Even cooler air will arrive for Tuesday through Thursday. Temperatures will top out mainly in the lower to middle 50s on Tuesday and Wednesday and then the upper 50s on Thursday. Lows will fall into the lower 40s in New York City and 30s outside the City where frost is likely. A potential warming trend could develop during the following weekend. Precipitation in the northern Mid-Atlantic region will likely remain below to much below normal into at least the fourth week of October. As a result, D0 and D1 conditions will likely continue to expand in the region and the pocket of D2 conditions in southern New Jersey will likely grow. The NAO fell to a preliminary -2.751 on September 24th (all-time September record: -2.371, September 12, 1971). That was the 9th lowest value on record. La Niña winters following September cases where the NAO fell to -1.900 or below featured a predominantly positive NAO. The most recent such winters were 2016-2017 and 2022-2023. The mean temperatures for those winters in New York City were 39.3° and 41.0° respectively. The 1991-2020 normal value is 36.2°. A warmer outcome is favored by the October run of the C3S multi-model forecast for Winter 2024-2025. Weekly ENSO data remains unavailable due to the disruptive impact Hurricane Helene's floods had on NCEI in Asheville. The ENSO Region 1+2 anomaly was +0.2°C and the Region 3.4 anomaly was -0.5°C for the week centered around September 18. For the past six weeks, the ENSO Region 1+2 anomaly has averaged -0.20°C and the ENSO Region 3.4 anomaly has averaged -0.18°C. Neutral ENSO conditions will likely evolve into a La Niña event during the fall. The SOI was +3.99 today. The preliminary Arctic Oscillation (AO) was -1.128 today. Based on sensitivity analysis applied to the latest guidance, there is an implied 59% probability that New York City will have a warmer than normal October (1991-2020 normal). October will likely finish with a mean temperature near 58.5° (0.6° above normal).
-
That’s a pretty dramatic cooling.
-
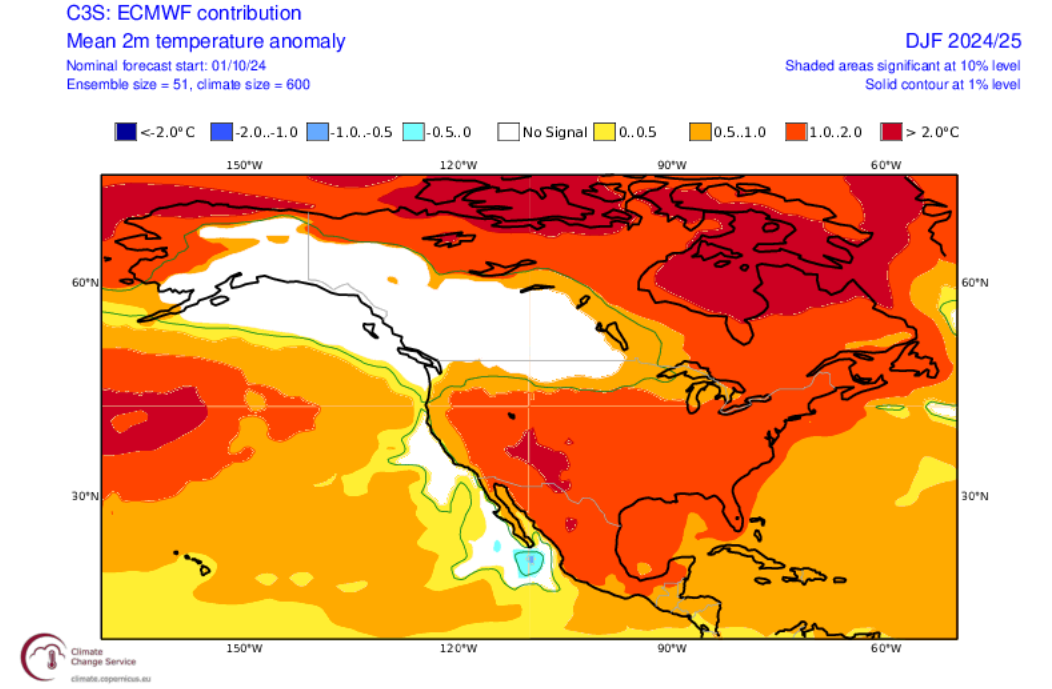
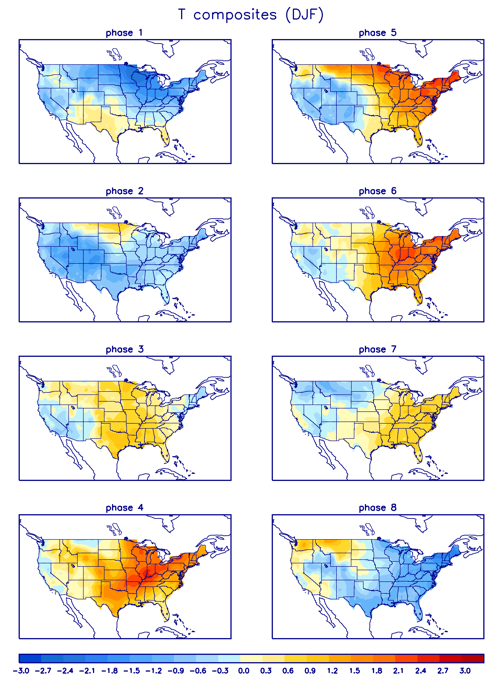
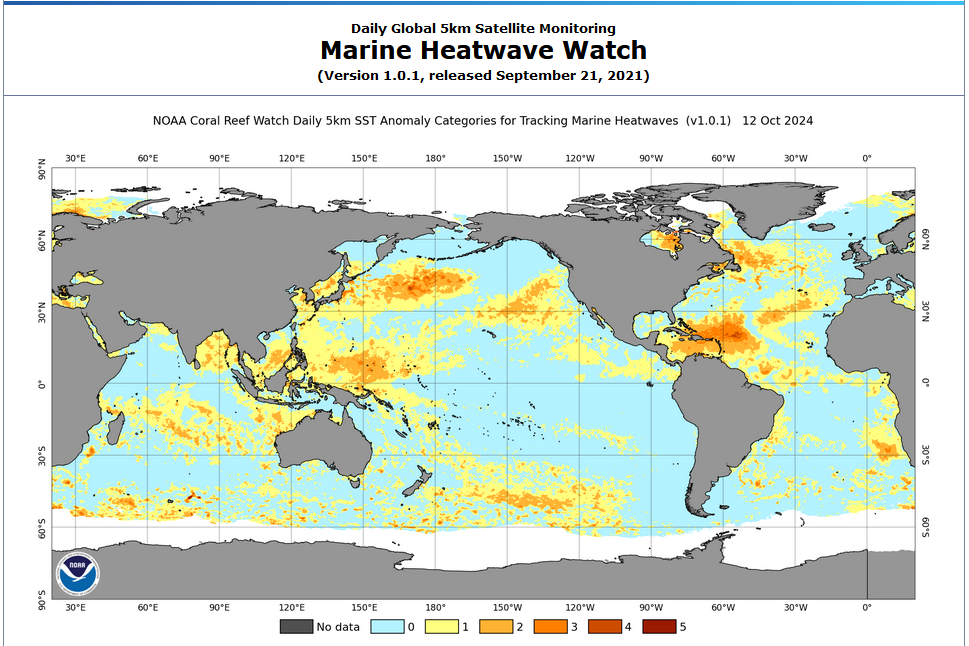
Currently, the ECMWF outlook continues to call for a warmer than normal winter across much of North America. Ongoing marine heatwaves north of Indonesia (with some Category 3 pockets) and in the North Pacific (pockets of Category 3 and 4 levels) are very likely contributing to the forecast. Those marine heatwaves, should they persist, could favor MJO Phases 4-6 during the winter and a negative to strongly negative PDO. Those outcomes are generally warm in the CONUS except for parts of the West.
-
That's remarkable.
-
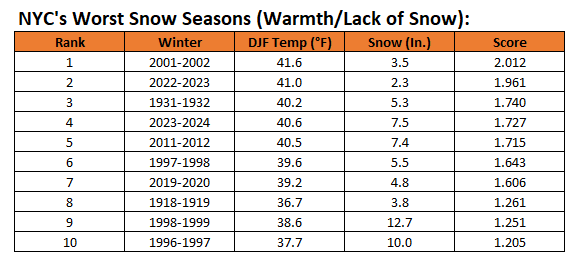
The last two winters were among the 10 worst in New York City when the combination of warmth and lack of snowfall was considered. It remains to be seen where Winter 2024-2025 will fall, but I suspect that it won't rank as badly as the last two winters.
-
Tomorrow will be another mild day with highs in the upper 60s and lower 70s. Monday will turn cooler and then Tuesday through Thursday will be noticeably cooler days. Temperatures will top out mainly in the lower to middle 50s on Tuesday and Wednesday and then the upper 50s on Thursday. Lows will fall into the lower 40s in New York City and 30s outside the City where frost is likely. A potential warming trend could develop during the following weekend. Precipitation in the northern Mid-Atlantic region will likely remain below to much below normal for at least the next 10-14 days. As a result, D0 and D1 conditions will likely continue to expand in the region and the pocket of D2 conditions in southern New Jersey will likely grow. The NAO fell to a preliminary -2.751 on September 24th (all-time September record: -2.371, September 12, 1971). That was the 9th lowest value on record. La Niña winters following September cases where the NAO fell to -1.900 or below featured a predominantly positive NAO. The most recent such winters were 2016-2017 and 2022-2023. The mean temperatures for those winters in New York City were 39.3° and 41.0° respectively. The 1991-2020 normal value is 36.2°. A warmer outcome is favored by the October run of the C3S multi-model forecast for Winter 2024-2025. Weekly ENSO data remains unavailable due to the disruptive impact Hurricane Helene's floods had on NCEI in Asheville. The ENSO Region 1+2 anomaly was +0.2°C and the Region 3.4 anomaly was -0.5°C for the week centered around September 18. For the past six weeks, the ENSO Region 1+2 anomaly has averaged -0.20°C and the ENSO Region 3.4 anomaly has averaged -0.18°C. Neutral ENSO conditions will likely evolve into a La Niña event during the fall. The SOI was +5.86 today. The preliminary Arctic Oscillation (AO) was -1.492 today. Based on sensitivity analysis applied to the latest guidance, there is an implied 56% probability that New York City will have a warmer than normal October (1991-2020 normal). October will likely finish with a mean temperature near 58.4° (0.5° above normal).
-
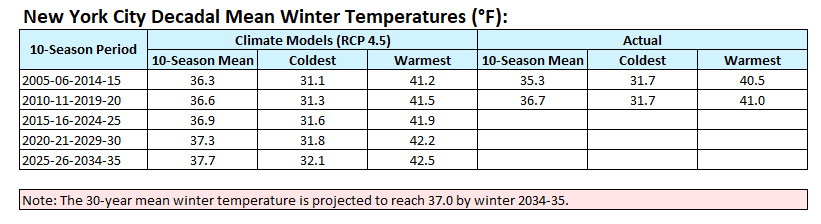
I suspect that the marine heatwaves have skewed things warmer than might otherwise have occurred in their absence. It will be interesting to see how the coming winter and future ones this decade fare relative to the climate model forecasts.
-
With the seasonal guidance currently suggesting yet another milder than normal winter, it's worth looking at how things have compared with climate model forecasts (RCP 4.5 scenario) for New York City: Since 1999-2000, just two winters had mean temperatures of 32.0° or below: 2002-03 (31.2°) and 2014-15 (31.7°). Winter 2014-15's average was largely the result of an extraordinarily cold February (23.9°, 3rd coldest on record). Overall, the return time for freezing or subfreezing winters during the 2000s has been once every 12.5 years. During the 1869-1999 period, the return time was once every 3.0 years. During the 1950-1999 period, the return time had increased to once every 5.6 years. The trend of lengthening return times for very cold winters (DJF mean temperature of 32° or below) is also seen in the base normal periods. During 1961-1990, such winters occurred once every 4.3 years. During the current base normal period (1991-2020), such winters occurred once every 10.0 years. So far, the 2016-16 through 2024-25 period is running notably warmer than had been suggested by the climate models (9-year mean: 38.5°). The warmest winters (41.0° mean) are reasonably in line with expectations. However, the coldest winters are much warmer (36.1°). Very cold winters are still likely to occur for some time, even if the 2015-16 through 2024-25 period has none, according to the climate model projections, but they will likely continue to grow less common.
-
Tomorrow will turn briefly milder with widespread readings in the lower 70s before cooler air returns Sunday or Monday. Another particularly strong cold shot is likely near mid-month before a potential warming trend develops. The NAO fell to a preliminary -2.751 on September 24th (all-time September record: -2.371, September 12, 1971). That was the 9th lowest value on record. La Niña winters following September cases where the NAO fell to -1.900 or below featured a predominantly positive NAO. The most recent such winters were 2016-2017 and 2022-2023. The mean temperatures for those winters in New York City were 39.3° and 41.0° respectively. The 1991-2020 normal value is 36.2°. A warmer outcome is favored by the September run of the C3S multi-model forecast for Winter 2024-2025. Weekly ENSO data remains unavailable due to the disruptive impact Hurricane Helene's floods had on NCEI in Asheville. The ENSO Region 1+2 anomaly was +0.2°C and the Region 3.4 anomaly was -0.5°C for the week centered around September 18. For the past six weeks, the ENSO Region 1+2 anomaly has averaged -0.20°C and the ENSO Region 3.4 anomaly has averaged -0.18°C. Neutral ENSO conditions will likely evolve into a La Niña event during the fall. The SOI was +8.06 today. The preliminary Arctic Oscillation (AO) was -1.567 today. Based on sensitivity analysis applied to the latest guidance, there is an implied 53% probability that New York City will have a warmer than normal October (1991-2020 normal). October will likely finish with a mean temperature near 58.2° (0.3° above normal).