

donsutherland1
-
Posts
24,192 -
Joined
Content Type
Profiles
Blogs
Forums
American Weather
Media Demo
Store
Gallery
Everything posted by donsutherland1
-
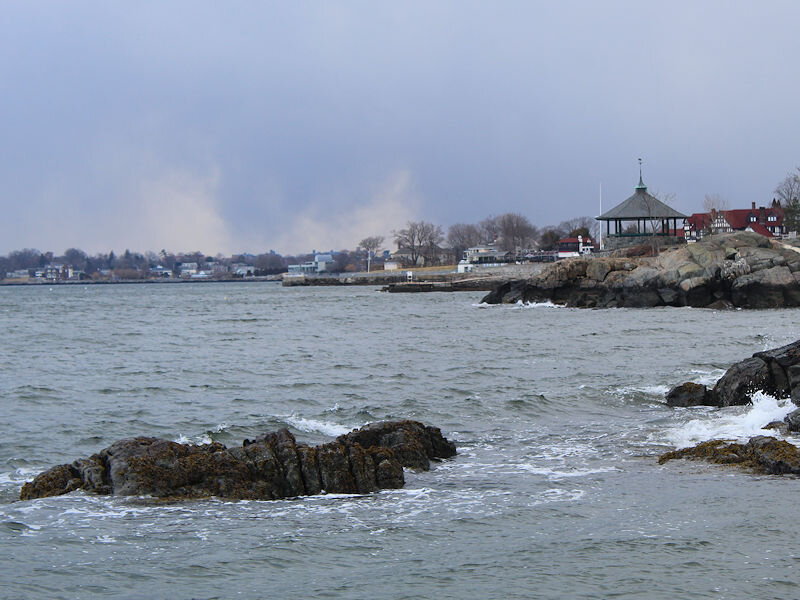
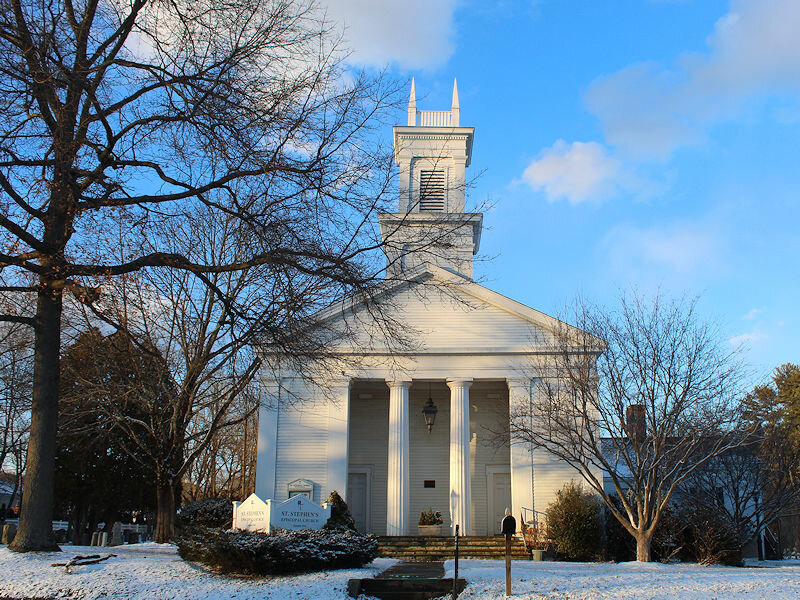
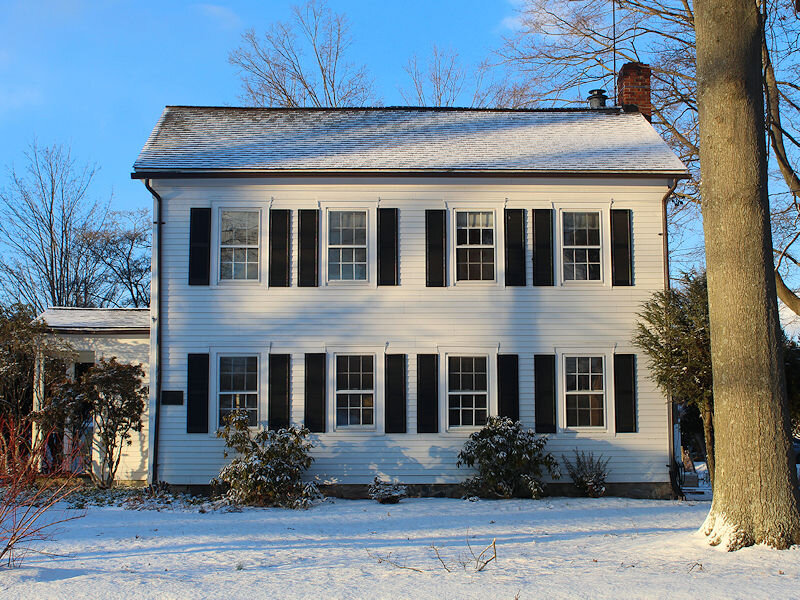
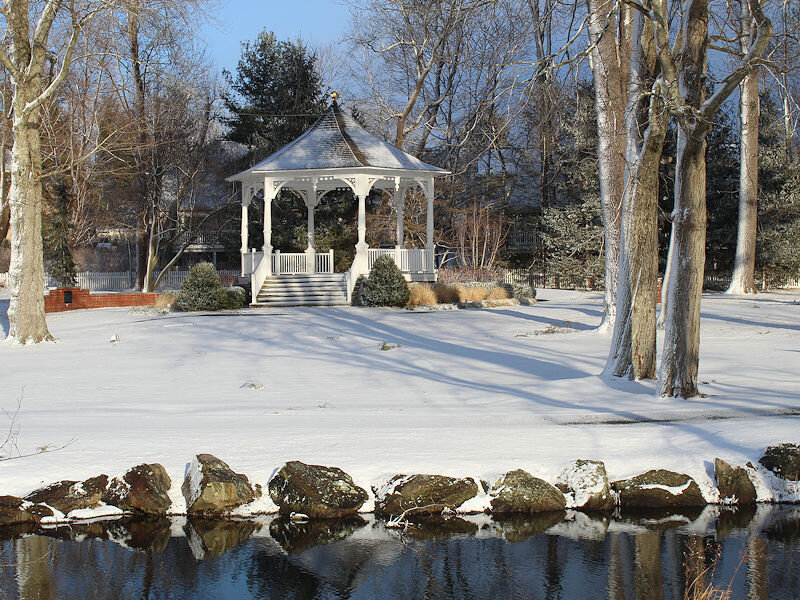
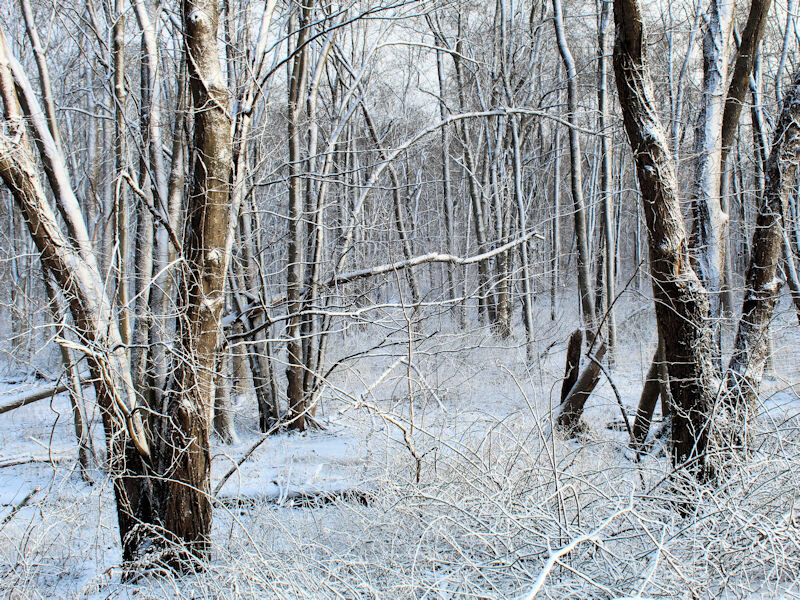
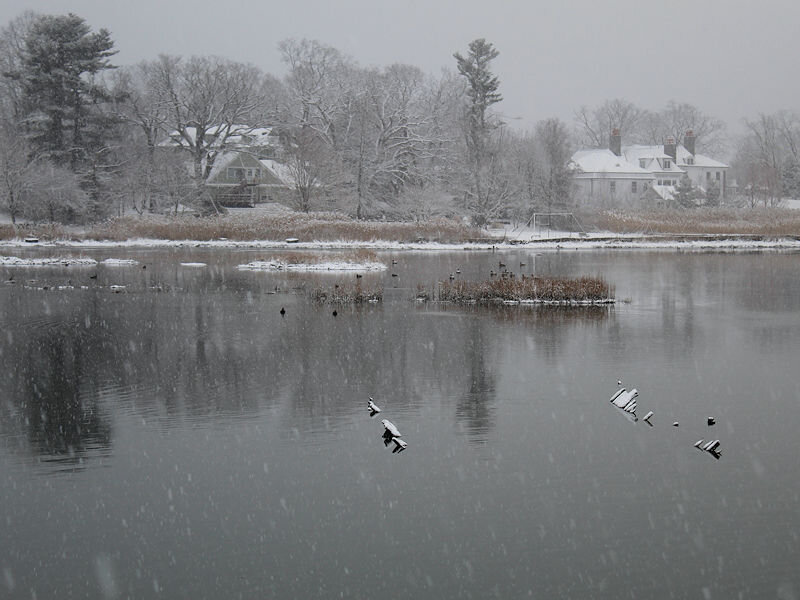
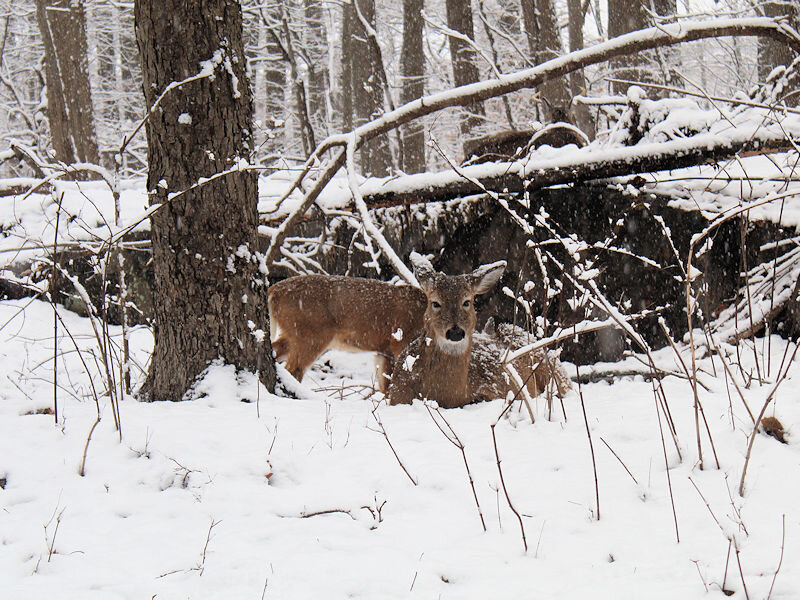
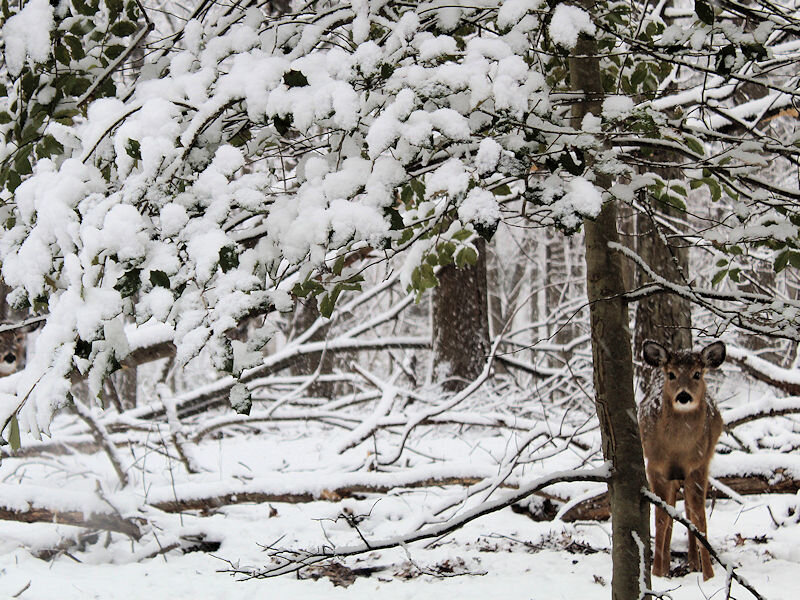
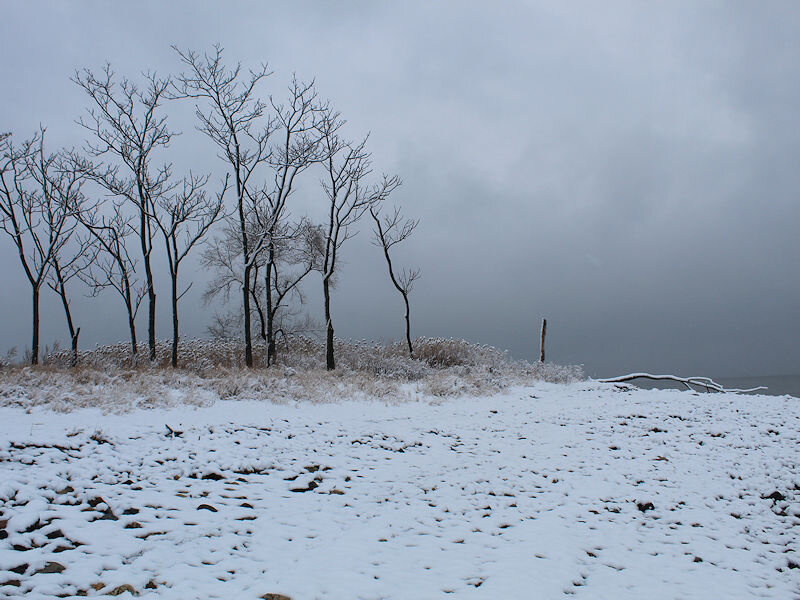
Some photos from today’s snow squall:
-
Morning thoughts… Bright sunshine will give way to afternoon clouds in parts of the region. Snow showers and a heavier snow squall are possible. High temperatures will likely reach the upper 30 and lower 40s in most of the region ahead of the arrival of the colder air. Likely high temperatures around the region include: New York City (Central Park): 42° Newark: 43° Philadelphia: 47° Tomorrow fair and cold. Normals: New York City: 30-Year: 43.0°; 15-Year: 43.0° Newark: 30-Year: 43.9°; 15-Year: 44.0° Philadelphia: 30-Year: 45.2°; 15-Year: 45.0°
-
There’s no way to tell at this point in the season. After the spring, there’s more skill with the ENSO forecasts.
-
A cool weekend lies ahead before much milder air returns next week for a time. Tomorrow will start with sunshine. However, the atmosphere will be highly unstable. As a result snow showers or a possible squall line could develop during the afternoon. The potential exists for parts of the region to pick up a quick coating of snow with some locally higher amounts. Sunday will be blustery and cold. Overall, things remain on course for a warmer than normal second half of February. The potential exists for several days to see much above normal temperatures during that time. The probability that the warm pattern could begin to break down during the closing days of February has increased. The ENSO Region 1+2 anomaly was -1.3°C and the Region 3.4 anomaly was -0.7°C for the week centered around February 9. For the past six weeks, the ENSO Region 1+2 anomaly has averaged -0.77°C and the ENSO Region 3.4 anomaly has averaged -0.78°C. La Niña conditions will likely persist into at least mid-March. The SOI was 0.00 today. The last time the SOI had a value of 0.00 was February 4, 2016. The preliminary Arctic Oscillation (AO) was +1.970. On February 16 the MJO was in Phase 3 at an amplitude of 1.708 (RMM). The February 15-adjusted amplitude was 1.387 (RMM). Based on sensitivity analysis applied to the latest guidance, there is an implied 84% probability that New York City will have a warmer than normal February (1991-2020 normal). February will likely finish with a mean temperature near 37.9° (2.0° above normal).
-
Morning thoughts… Clouds will break and it will become partly sunny and windy. Temperatures will begin to fall from currently mild levels. High temperatures will likely reach the upper 50s and lower 60s in most of the region ahead of the arrival of the colder air. Likely high temperatures around the region include: New York City (Central Park): 59° Newark: 59° Philadelphia: 60° Tomorrow will be variably cloudy and colder. Some snow showers are possible. Normals: New York City: 30-Year: 42.8°; 15-Year: 42.8° Newark: 30-Year: 43.6°; 15-Year: 43.8° Philadelphia: 30-Year: 44.9°; 15-Year: 44.7°
-
Under partly sunny skies, the temperature soared to record high levels in parts of the region. Daily records included: Boston: 61° (tied record set in 1981) Concord: 59° (old record: 58°, 1880 and 1883) New York City: 68° (old record: 67°, 1976) Newark: 69° (old record: 66°, 1976 and 2011) Philadelphia: 69° (old record: 68°, 1976) Wilmington, DE: 71° (old record: 70°, 1976) Worcester: 59° (old record: 56°, 1981) Tomorrow will start very warm, but the temperature will fall during the day. A cool weekend lies ahead before milder air returns next week. Overall, things remain on course for a warmer than normal second half of February. The potential exists for several days to see much above normal temperatures during that time. The warmer pattern will likely prevail into the opening week of March. However, uncertainty concerning a return of colder weather for the closing days of February or the first week of March has increased. The ENSO Region 1+2 anomaly was -1.3°C and the Region 3.4 anomaly was -0.7°C for the week centered around February 9. For the past six weeks, the ENSO Region 1+2 anomaly has averaged -0.77°C and the ENSO Region 3.4 anomaly has averaged -0.78°C. La Niña conditions will likely persist into at least mid-March. The SOI was +1.73 today. The preliminary Arctic Oscillation (AO) was +2.222. On February 15 the MJO was in Phase 3 at an amplitude of 1.389 (RMM). The February 14-adjusted amplitude was 1.385 (RMM). Based on sensitivity analysis applied to the latest guidance, there is an implied 83% probability that New York City will have a warmer than normal February (1991-2020 normal). February will likely finish with a mean temperature near 38.0° (2.1° above normal).
-
Morning thoughts… Today will be mostly cloudy and unseasonably warm. Showers are possible late in the day or overnight. It will become increasingly windy late in the day. High temperatures will likely reach the upper 50s and lower 60s in most of the region. Likely high temperatures around the region include: New York City (Central Park): 60° Newark: 60° Philadelphia: 65° Tomorrow will be very windy. Temperatures will fall during the day. A cool weekend lies ahead before temperatures again rebound. Normals: New York City: 30-Year: 42.6°; 15-Year: 42.6° Newark: 30-Year: 43.4°; 15-Year: 43.5° Philadelphia: 30-Year: 44.7°; 15-Year: 44.5°
-
Milder air returned to the region. As a result, temperatures rose into the 40s in most of the region and 50s in parts of southeastern Pennsylvania today. Tomorrow will be even warmer with the mercury reaching the upper 50s and lower 60s in much of the region. Overall, the stage is now set for a warmer than normal second half of February. The potential exists for several days to see much above normal temperatures during that time. The warmer pattern will likely prevail into the opening week of March. However, uncertainty concerning a return of colder weather for the closing days of February or the first week of March has increased. The ENSO Region 1+2 anomaly was -1.3°C and the Region 3.4 anomaly was -0.7°C for the week centered around February 9. For the past six weeks, the ENSO Region 1+2 anomaly has averaged -0.77°C and the ENSO Region 3.4 anomaly has averaged -0.78°C. La Niña conditions will likely persist into at least mid-March. The SOI was -1.68 today. The preliminary Arctic Oscillation (AO) was +2.044. On February 14 the MJO was in Phase 3 at an amplitude of 1.385 (RMM). The February 13-adjusted amplitude was 1.428 (RMM). Based on sensitivity analysis applied to the latest guidance, there is an implied 82% probability that New York City will have a warmer than normal February (1991-2020 normal). February will likely finish with a mean temperature near 38.0° (2.1° above normal).
-
Morning thoughts… Today will be variably cloudy and milder. High temperatures will likely reach the middle and upper 40s in most of the region. Likely high temperatures around the region include: New York City (Central Park): 45° Newark: 46° Philadelphia: 51° Tomorrow and Friday will be vary warm days. It will also turn very windy later tomorrow into Friday. Normals: New York City: 30-Year: 42.3°; 15-Year: 42.4° Newark: 30-Year: 43.2°; 15-Year: 43.3° Philadelphia: 30-Year: 44.5°; 15-Year: 44.3°
-
Today saw the temperature bottom out at 16° in Central Park. New York City has now gone 1,111 consecutive days without a temperature below 10°. That is the second longest such streak on record. The record of 1,410 days was set from February 18, 1930 through December 28, 1933. That record could be surpassed on December 12th. As no single-digit readings are likely through the remainder of February and the last such occurrence during the March 1-December 12 period was December 12, 1988, it is likely that the record will fall. In addition, 4 of the 5 1,000-day streaks have occurred since 1990, with 3 occurring since 2000. Records go back to 1869. Milder air will pour into the region starting tomorrow. This will set the stage for a warmer than normal second half of February. The potential exists for several days to see much above normal temperatures. Thursday and Friday are two such potential days. Strong winds are also possible later Thursday into Friday. That warmer pattern will likely prevail into the opening week of March. Cooler weather could develop afterward, but uncertainty concerning the timing of such a shift exists. The ENSO Region 1+2 anomaly was -1.3°C and the Region 3.4 anomaly was -0.7°C for the week centered around February 9. For the past six weeks, the ENSO Region 1+2 anomaly has averaged -0.77°C and the ENSO Region 3.4 anomaly has averaged -0.78°C. La Niña conditions will likely persist into at least mid-March. The SOI was -16.33 today. The preliminary Arctic Oscillation (AO) was +1.452. On February 13 the MJO was in Phase 3 at an amplitude of 1.429 (RMM). The February 12-adjusted amplitude was 1.247 (RMM). Based on sensitivity analysis applied to the latest guidance, there is an implied 86% probability that New York City will have a warmer than normal February (1991-2020 normal). February will likely finish with a mean temperature near 38.2° (2.3° above normal).
-
Morning thoughts… Today will be mostly sunny and cold. High temperatures will likely reach the lower and middle 30s in most of the region. Likely high temperatures around the region include: New York City (Central Park): 32° Newark: 33° Philadelphia: 36° Noticeably warmer weather will return to the region, as a sustained warmer than normal pattern develops tomorrow. Normals: New York City: 30-Year: 42.1°; 15-Year: 42.2° Newark: 30-Year: 43.0°; 15-Year: 43.1° Philadelphia: 30-Year: 44.2°; 15-Year: 44.0
-
Despite bright sunshine, temperatures remained in the middle and upper 20s across much of the region today. A stiff breeze added to the icy feel. Tomorrow will be another fair but unseasonably cold day. Afterward, milder air will pour into the region setting the stage for a warmer than normal second half of February. The potential exists for several days to see much above normal temperatures. Thursday and Friday are two such potential days. That warmer pattern will likely prevail into the opening week of March. The ENSO Region 1+2 anomaly was -1.3°C and the Region 3.4 anomaly was -0.7°C for the week centered around February 9. For the past six weeks, the ENSO Region 1+2 anomaly has averaged -0.77°C and the ENSO Region 3.4 anomaly has averaged -0.78°C. La Niña conditions will likely persist into at least mid-March. The SOI was -12.20 today. The preliminary Arctic Oscillation (AO) was +1.246. On February 12 the MJO was in Phase 3 at an amplitude of 1.253 (RMM). The February 11-adjusted amplitude was 1.203 (RMM). Based on sensitivity analysis applied to the latest guidance, there is an implied 86% probability that New York City will have a warmer than normal February (1991-2020 normal). February will likely finish with a mean temperature near 38.1° (2.2° above normal).
-
Morning thoughts… Today will be partly sunny and unseasonably cold. High temperatures will likely reach the middle and upper 20s in most of the region. Likely high temperatures around the region include: New York City (Central Park): 26° Newark: 27° Philadelphia: 31° After another cold day tomorrow, much warmer weather will return to the region, as a sustained warmer than normal pattern develops. Normals: New York City: 30-Year: 42.0°; 15-Year: 41.8° Newark: 30-Year: 42.7°; 15-Year: 42.8° Philadelphia: 30-Year: 44.0°; 15-Year: 43.8°
-
On the heels of near record and record warmth, a storm brought a light to moderate snowfall to the northern Middle Atlantic and southern New England regions today. Accumulations included: Allentown: 5.1" Boston: 3.1" Bridgeport: 2.8" Hartford: 1.9" Islip: 2.0" New York City-Central Park: 1.6" New York City-JFK: 2.2" New York City-LGA: 2.3" Newark: 1.9" Philadelphia: 0.4" Providence: 2.8" In the wake of the snowfall, tomorrow and Tuesday will be fair but unseasonably cold. Afterward, milder air will pour into the region setting the stage for a warmer than normal second half of February. The potential exists for several days to see much above normal temperatures. Thursday and Friday are two such potential days. That warmer pattern will likely prevail into the opening week of March. Out west, Los Angeles recorded its 5th consecutive 80° day. That broke the February record of 4 consecutive days, which was set during February 22-25, 1954 and tied during February 11-15, 2015 and February 7-10, 2016. The ENSO Region 1+2 anomaly was -1.0°C and the Region 3.4 anomaly was -0.6°C for the week centered around February 2. For the past six weeks, the ENSO Region 1+2 anomaly has averaged -0.80°C and the ENSO Region 3.4 anomaly has averaged -0.83°C. La Niña conditions will likely persist through meteorological winter. The SOI was -0.19 today. The preliminary Arctic Oscillation (AO) was +1.609. On February 11 the MJO was in Phase 2 at an amplitude of 1.208 (RMM). The February 10-adjusted amplitude was 1.159 (RMM). Based on sensitivity analysis applied to the latest guidance, there is an implied 78% probability that New York City will have a warmer than normal February (1991-2020 normal). February will likely finish with a mean temperature near 37.9° (2.0° above normal).
-
2/13 Light/Moderate Snowfall Nowcasting & Observations
donsutherland1 replied to Northof78's topic in New York City Metro
JFK’s normal snowfall through 2/13 is 16.7”. -
2/13 Light/Moderate Snowfall Nowcasting & Observations
donsutherland1 replied to Northof78's topic in New York City Metro
JFK is up to 20.3” for winter 2021-22. JFK’s normal seasonal snowfall is 25.9” (1991-2020 baseline). -
2/13 Light/Moderate Snowfall Nowcasting & Observations
donsutherland1 replied to Northof78's topic in New York City Metro
Snowfall totals so far: Islip: 2.0" New York City-JFK: 2.2" New York City-LGA: 2.3" New York City-NYC: 1.6" Newark: 1.9" -
2/13 Light/Moderate Snowfall Nowcasting & Observations
donsutherland1 replied to Northof78's topic in New York City Metro
Short video from this morning. -
2/13 Light/Moderate Snowfall Nowcasting & Observations
donsutherland1 replied to Northof78's topic in New York City Metro
Some photos from today’s snowfall: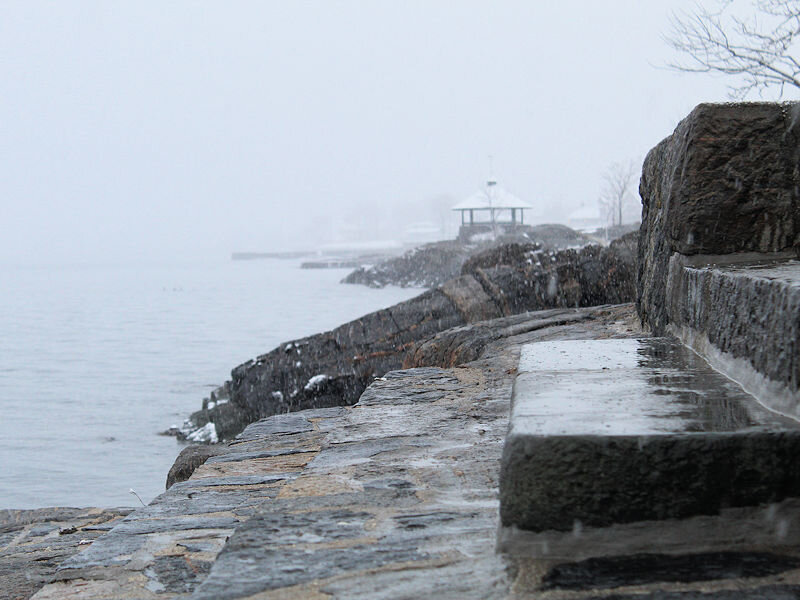
- 622 replies
-
- 11
-

-
Morning thoughts… It will be mostly cloudy with light to perhaps moderate snow. A general 1”-3” with some locally higher amounts is likely. High temperatures will likely reach the lower and middle 30s in most of the region. Likely high temperatures around the region include: New York City (Central Park): 34° Newark: 35° Philadelphia: 37° Tomorrow and Tuesday will be cold days. Warmer weather will develop afterward. Normals: New York City: 30-Year: 41.8°; 15-Year: 41.8° Newark: 30-Year: 42.5°; 15-Year: 42.6° Philadelphia: 30-Year: 43.8°; 15-Year: 43.6°
-
2/13 Light/Moderate Snowfall Nowcasting & Observations
donsutherland1 replied to Northof78's topic in New York City Metro
2/13 0z HREF: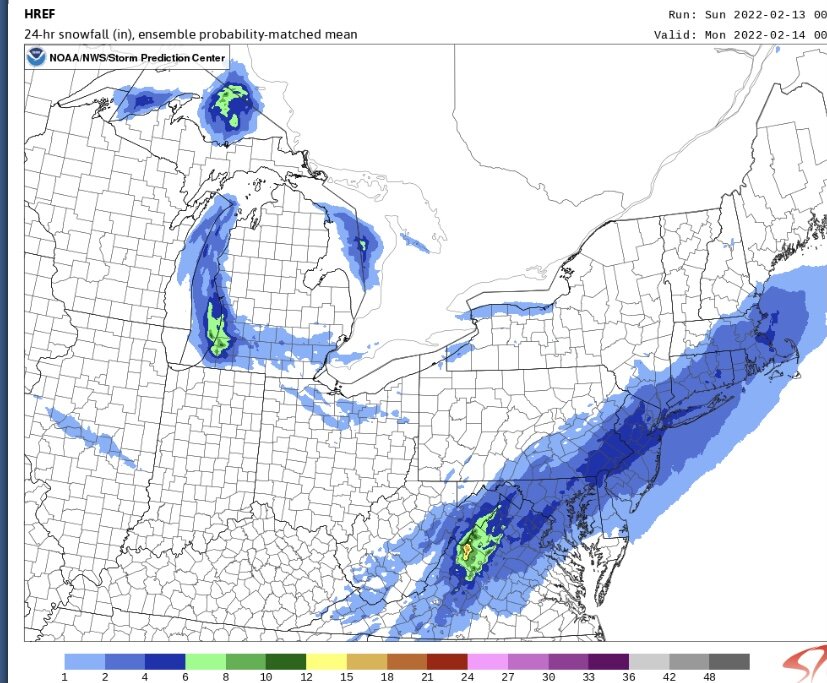
-
Yes. 2018 saw the historic warmth on 2/21. There was also an early April snowstorm.
-
61 at JFK.
-
Ahead of a coming light snow event, temperatures soared to near record and record highs in parts of the region. Daily records included: Atlantic City: 64° (tied record set in 2018) Boston: 60° (old record: 58°, 1984 and 1999) Bridgeport: 60° (old record: 54°, 2009 and 2018) Hartford: 59° (old record: 54°, 1984 and 1999) Islip: 62° (old record: 55°, 1984) New Haven: 58° (old record: 55°, 2018) New York City-JFK: 61° (old record: 58°, 1966 and 2018) Portland, ME: 54° (old record: 51°, 1984) Providence: 63° (old record: 61°, 1999) Out west, Los Angeles recorded its 4th consecutive 80° day. That ties the February record, which was set during February 22-25, 1954 and tied during February 11-15, 2015 and February 7-10, 2016. In the wake of the passage of a strong cold front, tomorrow will be mostly cloudy and sharply colder. A period of light snow is likely in parts of the region tomorrow into tomorrow night. A general 1"-3" of snow is likely across the region with some locally higher amounts. The second half of February will see a significant pattern change. Ridging will develop in the East. That pattern change will produce sustained above normal to occasionally much above normal readings after mid-month. That warmer pattern will likely prevail into the opening week of March. The ENSO Region 1+2 anomaly was -1.0°C and the Region 3.4 anomaly was -0.6°C for the week centered around February 2. For the past six weeks, the ENSO Region 1+2 anomaly has averaged -0.80°C and the ENSO Region 3.4 anomaly has averaged -0.83°C. La Niña conditions will likely persist through meteorological winter. The SOI was +4.95 today. The preliminary Arctic Oscillation (AO) was +1.381. On February 10 the MJO was in Phase 2 at an amplitude of 1.157 (RMM). The February 9-adjusted amplitude was 1.126 (RMM). Based on sensitivity analysis applied to the latest guidance, there is an implied 75% probability that New York City will have a warmer than normal February (1991-2020 normal). February will likely finish with a mean temperature near 37.9° (2.0° above normal).
-
No. New Haven did not reach 60.
