donsutherland1
-
Posts
24,194 -
Joined
Content Type
Profiles
Blogs
Forums
American Weather
Media Demo
Store
Gallery
Everything posted by donsutherland1
-
The storm responsible for today's mainly light snowfall will rapidly intensify as it heads toward eastern Canada. In its wake, temperatures will plunge into the teens outside Newark and New York City and the lower 20s elsewhere. Tomorrow will be blustery and cold. Afterward, the potential exists for the development of a sustained warmer than normal pattern. The ENSO Region 1+2 anomaly was -1.3°C and the Region 3.4 anomaly was -1.1°C for the week centered around March 2. For the past six weeks, the ENSO Region 1+2 anomaly has averaged -1.22°C and the ENSO Region 3.4 anomaly has averaged -0.75°C. La Niña conditions will likely persist through March. The SOI was +16.23 today. The preliminary Arctic Oscillation (AO) was +0.737 today. On March 10 the MJO was in Phase 1 at an amplitude of 1.366 (RMM). The March 9-adjusted amplitude was 1.054 (RMM). Based on sensitivity analysis applied to the latest guidance, there is an implied 83% probability that New York City will have a warmer than normal March (1991-2020 normal). March will likely finish with a mean temperature near 45.6° (2.8° above normal).
-
Just a trace at both of them.
-
LGA had 0.4” and EWR had 0.3”
-
Unfortunately, dry air wrapped into the developing storm’s circulation.
-
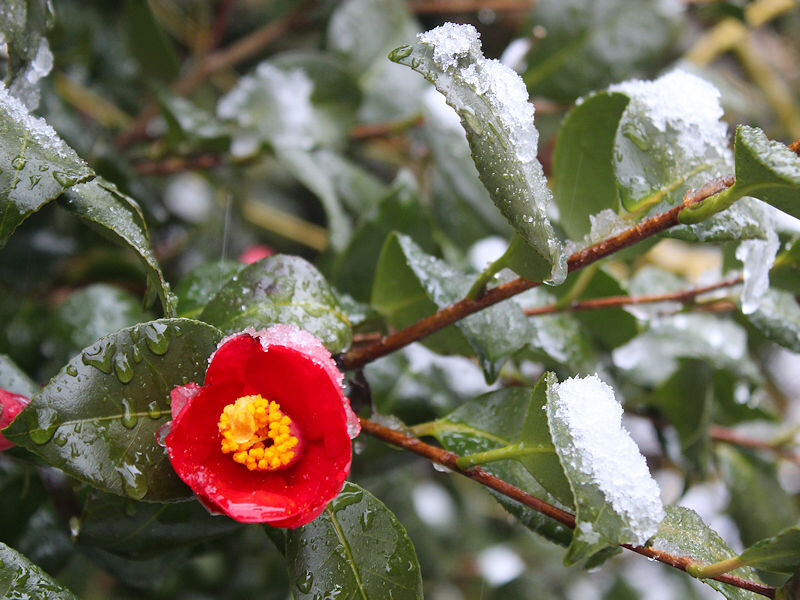
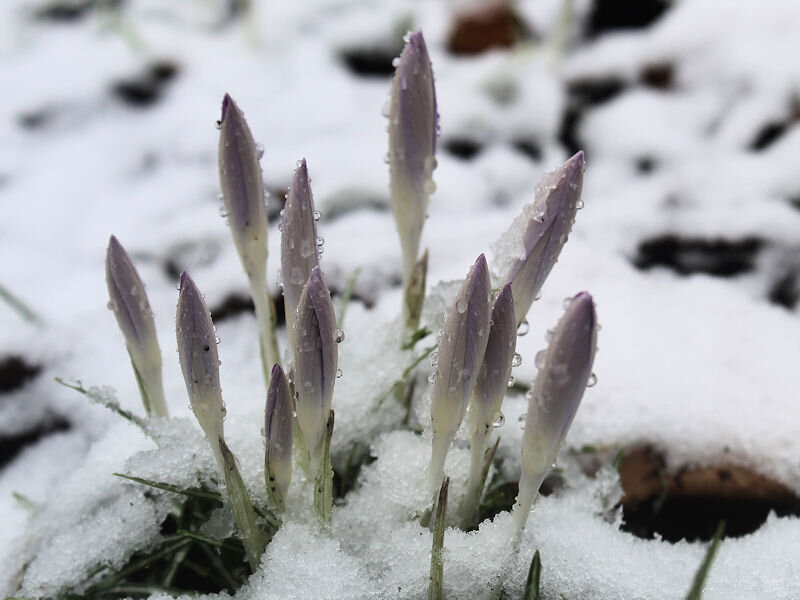
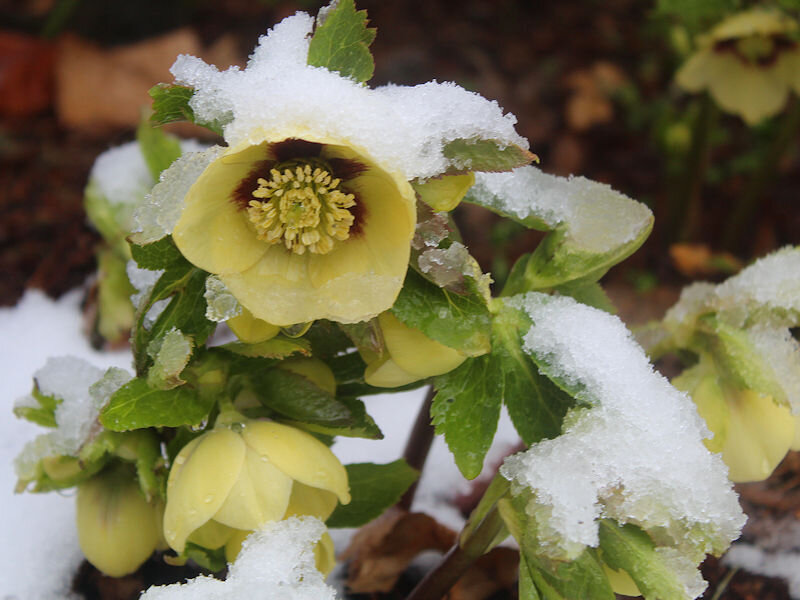
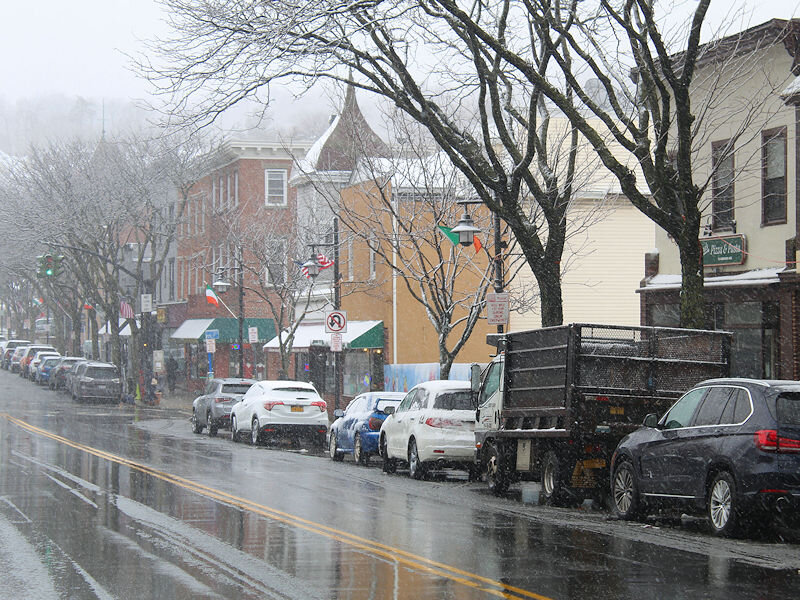
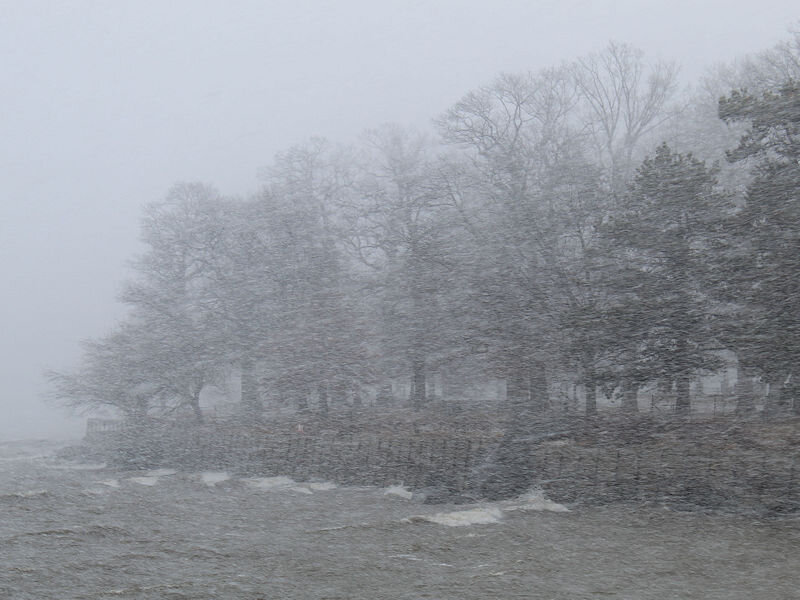
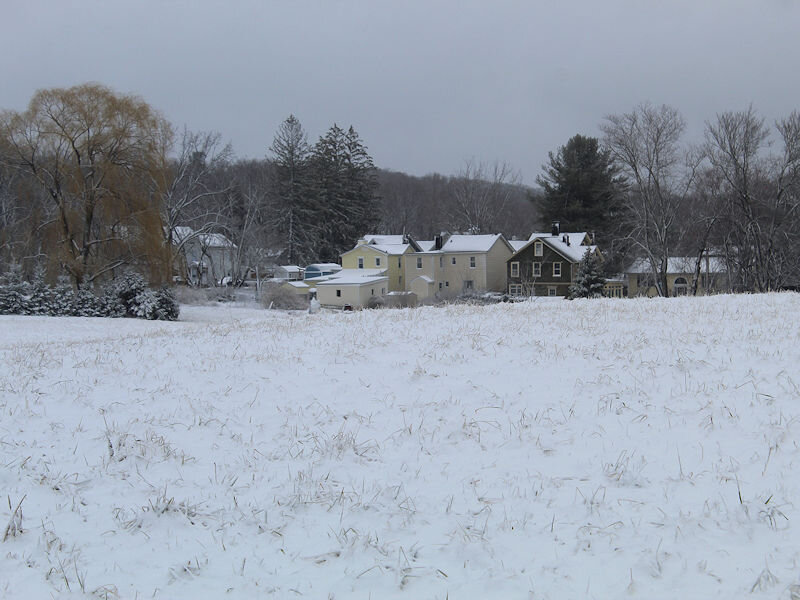
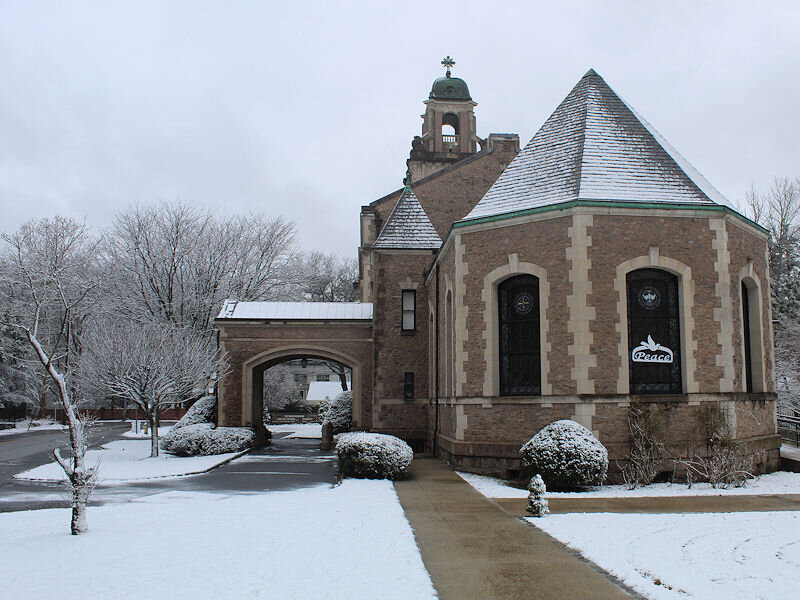
Some photos from earlier today:
-
We’ll probably fall just short unless the changeover occurs between 10 am and 11 am.
-
Morning thoughts… It will become rainy and very windy. The temperature will fall from morning highs. Rain will change to a period of potentially heavy snow, particularly to the west of New York City and Newark. There could be near blizzard conditions along with some thunder in some of the distant northern and western suburbs. High temperatures will likely reach the middle and upper 40s in most of the region. Likely high temperatures around the region include: New York City (Central Park): 46° Newark: 45° Philadelphia: 48° Tomorrow will be blustery and cold. Milder air will return on Monday. Normals: New York City: 30-Year: 48.4°; 15-Year: 49.0° Newark: 30-Year: 49.4°; 15-Year: 50.3° Philadelphia: 30-Year: 51.2°; 15-Year: 51.7°
-
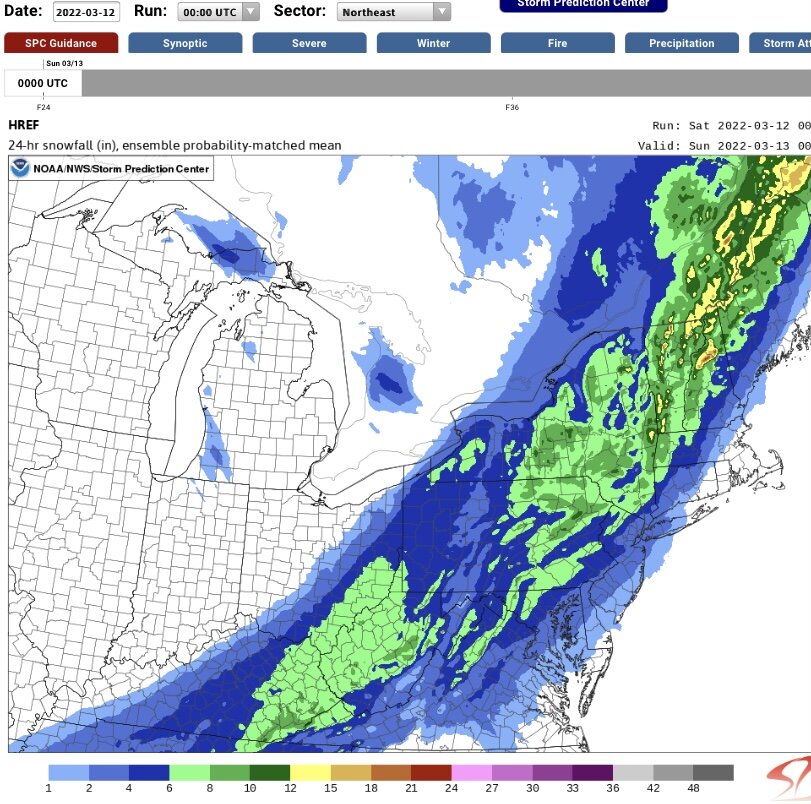
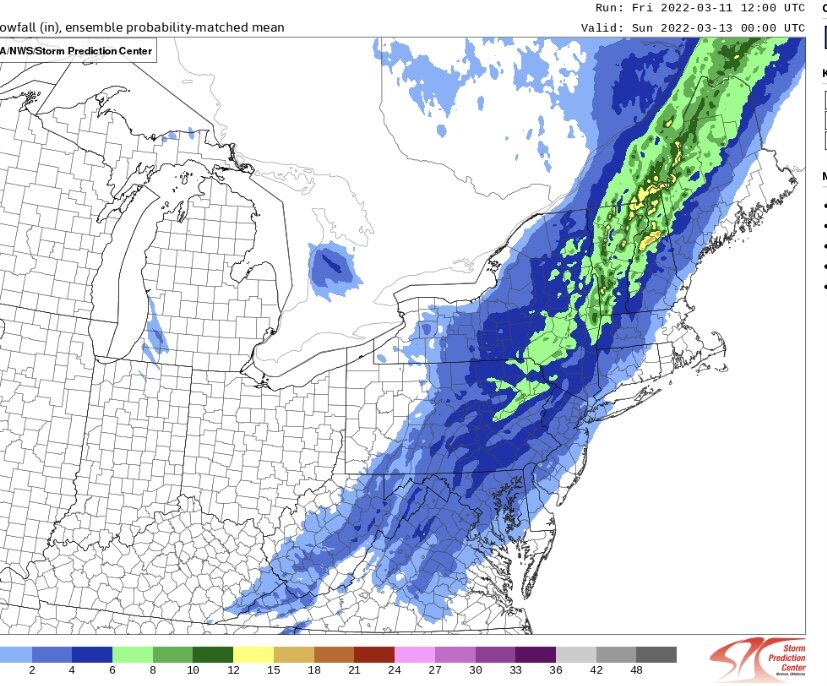
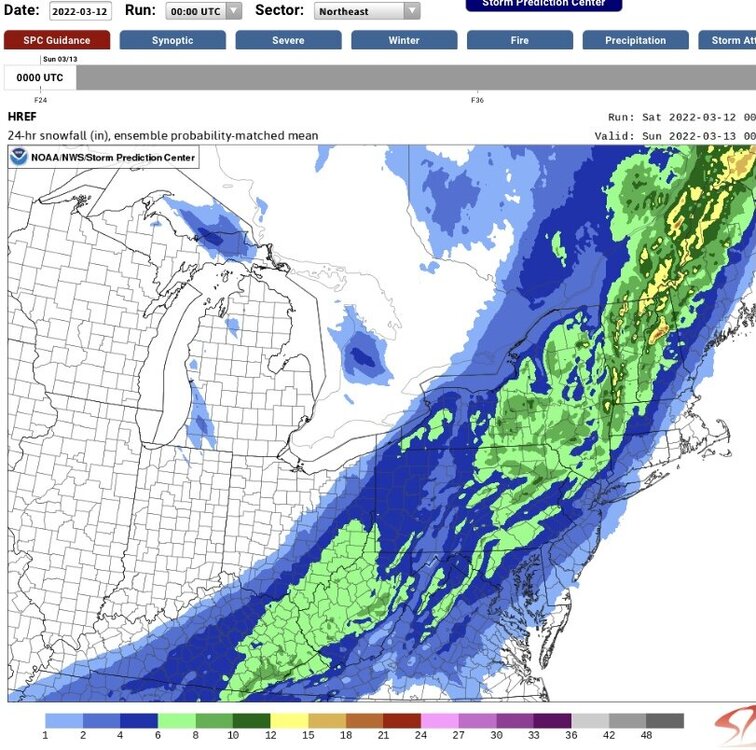
HREF at 3/11 12z and 3/12 0z:

-
I suspect we’ll see more NAO+ winters, but am more uncertain about ENSO. The world remains on course to badly miss its 2030 goal. The ongoing war could accelerate the transition in Europe and the U.S., especially if fossil fuel prices remain high.
-
No blocking and a really fast jet stream.
-
Tomorrow will start mild. Rain, some of which could be heavy, and high winds are likely. Temperatures will fall sharply during the morning. Rain will change to a period of accumulating snow, with the highest amounts north and west of Newark and New York City. The snow could be briefly heavy. Snowfall estimates: Allentown: 3"-6" Baltimore: 1"-3" Boston: 1" or less Bridgeport: 1" or less Islip: 1" or less New York City: 1"-3" Newark: 1"-3" Philadelphia: 1"-3" Poughkeepsie: 4"-8" Washington, DC: 1"-3" White Plains: 2"-4" Sunday will be blustery and cold. Afterward, the potential exists for the development of a sustained warmer than normal pattern. The ENSO Region 1+2 anomaly was -1.3°C and the Region 3.4 anomaly was -1.1°C for the week centered around March 2. For the past six weeks, the ENSO Region 1+2 anomaly has averaged -1.22°C and the ENSO Region 3.4 anomaly has averaged -0.75°C. La Niña conditions will likely persist through March. The SOI was +8.04 today. The preliminary Arctic Oscillation (AO) was +0.439 today. On March 9 the MJO was in Phase 1 at an amplitude of 1.061 (RMM). The March 8-adjusted amplitude was 0.741 (RMM). Based on sensitivity analysis applied to the latest guidance, there is an implied 83% probability that New York City will have a warmer than normal March (1991-2020 normal). March will likely finish with a mean temperature near 45.6° (2.8° above normal).
-
Morning thoughts… It will be partly sunny and mild. High temperatures will likely reach the lower and middle 50s in most of the region. Likely high temperatures around the region include: New York City (Central Park): 53° Newark: 55° Philadelphia: 59° A strong storm will be followed by a brief but sharp cold shot during the weekend. A period of accumulating snow is likely north and west of New York City and Newark. A minor accumulation is possible in both cities. Normals: New York City: 30-Year: 48.1°; 15-Year: 48.7° Newark: 30-Year: 49.1°; 15-Year: 49.9° Philadelphia: 30-Year: 50.9°; 15-Year: 51.3°
-
2 consecutive monthly record low temperatures is impressive.
-
Milder air returned to the region following yesterday's snowfall in the northern Mid-Atlantic region. Tomorrow will be another mild day. Temperatures will likely rise into the upper 40s and lower 50s tomorrow. Saturday will also be mild with the potential for rain and high winds. Temperatures could fall sharply later in the day with rain changing to a period of accumulating snow in northern and western sections of the region. There remains some possibility that minor accumulations could reach the coastline. Sunday will be blustery and cold. Afterward, the potential exists for the development of a sustained warmer than normal pattern. The ENSO Region 1+2 anomaly was -1.3°C and the Region 3.4 anomaly was -1.1°C for the week centered around March 2. For the past six weeks, the ENSO Region 1+2 anomaly has averaged -1.22°C and the ENSO Region 3.4 anomaly has averaged -0.75°C. La Niña conditions will likely persist through March. The SOI was +7.90 today. The preliminary Arctic Oscillation (AO) was +0.085 today. On March 8 the MJO was in Phase 1 at an amplitude of 0.743 (RMM). The March 7-adjusted amplitude was 0.471 (RMM). Based on sensitivity analysis applied to the latest guidance, there is an implied 78% probability that New York City will have a warmer than normal March (1991-2020 normal). March will likely finish with a mean temperature near 45.4° (2.6° above normal).
-
Morning thoughts… It will be partly sunny and milder. High temperatures will likely reach the upper 40s and lower 50s in most of the region. Likely high temperatures around the region include: New York City (Central Park): 50° Newark: 50° Philadelphia: 54° A strong storm will be followed by a brief but sharp cold shot during the weekend. Normals: New York City: 30-Year: 47.8°; 15-Year: 48.4° Newark: 30-Year: 48.8°; 15-Year: 49.6° Philadelphia: 30-Year: 50.6°; 15-Year: 51.0°
-
Very creative. It’s amazing how much burst into bloom in recent days.
-
Milder conditions will follow in the wake of a storm that brought snow to parts of the northern Middle Atlantic region today. Temperatures will likely rise into the upper 40s and lower 50s tomorrow and Friday. Saturday will also be mild with the potential for rain and high winds. Temperatures could fall sharply later in the day with rain changing to a period of accumulating snow in northern and western sections of the region. Sunday will be blustery and cold. Afterward, the potential exists for the development of a sustained warmer than normal pattern. Overall, March will likely be warmer than normal. There may also be one or two opportunities for at least some measurable snow in the northern Middle Atlantic and southern New England areas. The ENSO Region 1+2 anomaly was -1.3°C and the Region 3.4 anomaly was -1.1°C for the week centered around March 2. For the past six weeks, the ENSO Region 1+2 anomaly has averaged -1.22°C and the ENSO Region 3.4 anomaly has averaged -0.75°C. La Niña conditions will likely persist through March. The SOI was +12.68 today. The preliminary Arctic Oscillation (AO) was +0.002 today. On March 7 the MJO was in Phase 1 at an amplitude of 0.468 (RMM). The March 6-adjusted amplitude was 0.333 (RMM). Based on sensitivity analysis applied to the latest guidance, there is an implied 80% probability that New York City will have a warmer than normal March (1991-2020 normal). March will likely finish with a mean temperature near 45.4° (2.6° above normal).
-
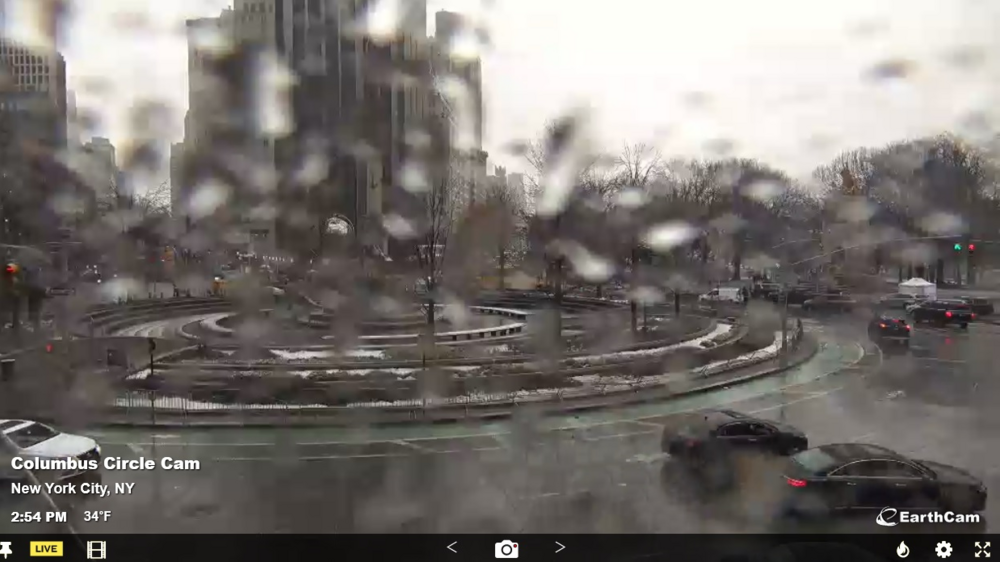
In the latest PNS, Central Park reported a trace of snow. Yet, the ground is actually whitened as per the camera at Columbus Circle. Were a proper measurement taken on a snow board, one would be dealing with a few tenths of an inch of snow, not a trace. Here's a very recent image from Columbus Circle:
-
The persistence in the tropical Atlantic sea surface temperature anomalies is likely an important factor.
-
No. The NAO will likely stay positive.
-
Morning thoughts… It will be cloudy. A cold rain and/or wet snow is likely in much of the region. Well north and west of New York City, there could be a 1”-3” snowfall. Elsewhere, 1” or less is likely in the vicinity of New York City and Newark. High temperatures will likely reach the upper 30s and lower 40s in most of the region. Likely high temperatures around the region include: New York City (Central Park): 39° Newark: 39° Philadelphia: 43° Following the storm, tomorrow and Friday will be milder days. Normals: New York City: 30-Year: 47.5°; 15-Year: 48.1° Newark: 30-Year: 48.5°; 15-Year: 49.3° Philadelphia: 30-Year: 50.3°; 15-Year: 50.6°