

donsutherland1
-
Posts
24,186 -
Joined
Content Type
Profiles
Blogs
Forums
American Weather
Media Demo
Store
Gallery
Everything posted by donsutherland1
-
The final low temperature at Bismarck was 0F (-17.8C). That was the coldest temperature so late in the season. The previous latest such temperature occurred on April 5, 1996 with a low temperature -1F (-18.3C).
-
Morning thoughts… Clouds will increase this afternoon. Showers and thunderstorms are likely late this afternoon or this evening. High temperatures will likely reach the upper 60s and lower 70s in much of the region. Likely high temperatures around the region include: New York City (Central Park): 68° Newark: 71° Philadelphia: 73° It will be noticeably cooler tomorrow despite ample sunshine. Normals: New York City: 30-Year: 62.2°; 15-Year: 62.5° Newark: 30-Year: 62.9°; 15-Year: 63.3° Philadelphia: 30-Year: 65.1°; 15-Year: 65.5° Through 6 am CDT, the low temperature at Bismarck is 1°. That smashes the daily record low of 10°, which was set in 1953. It is also the coldest temperature so late in the season. The previous latest such temperature occurred on April 9, 1997 when the temperature also fell to 1°.
-
Under bright sunshine temperatures rose into the upper 60s and lower 70s across the region. Tomorrow will be another warm day. However, a strong cold front will slice across the region bringing showers and perhaps gusty thunderstorms. Noticeably cooler air will then pour into the region and persist through at least the middle of next week. The duration and magnitude of the upcoming cool spell could determine whether April finishes with a cool or warm anomaly. The ENSO Region 1+2 anomaly was -1.1°C and the Region 3.4 anomaly was -0.9°C for the week centered around April 6. For the past six weeks, the ENSO Region 1+2 anomaly has averaged -0.73°C and the ENSO Region 3.4 anomaly has averaged -0.92°C. La Niña conditions will likely persist into the start of May. The SOI was +19.54 today. That ended the 10-day stretch during which the SOI was +20.00 or above. The last time a streak of 7 or more such days occurred in April was March 28-April 5, 2011 when the SOI reached at least +20.00 on 9 consecutive days. Then, there was a brief period of much warmer than normal temperatures following the end of that stretch and a longer period of much warmer than normal temperatures starting about 2 1/2 weeks later. The preliminary Arctic Oscillation (AO) was -0.178 today. On April 13 the MJO was in Phase 7 at an amplitude of 0.630 (RMM). The April 12-adjusted amplitude was 0.750 (RMM). Based on sensitivity analysis applied to the latest guidance, there is an implied 50% probability that New York City will have a warmer than normal April (1991-2020 normal). April will likely finish with a mean temperature near 53.7° (normal).
-
Morning thoughts… It will be partly to mostly sunny and warm today. High temperatures will likely reach the upper 60s and lower 70s in much of the region. Likely high temperatures around the region include: New York City (Central Park): 67° Newark: 69° Philadelphia: 70° The unseasonable warmth will continue into the start of the weekend. Normals: New York City: 30-Year: 61.8°; 15-Year: 62.1° Newark: 30-Year: 62.5°; 15-Year: 62.9° Philadelphia: 30-Year: 64.7°; 15-Year: 65.1°
-
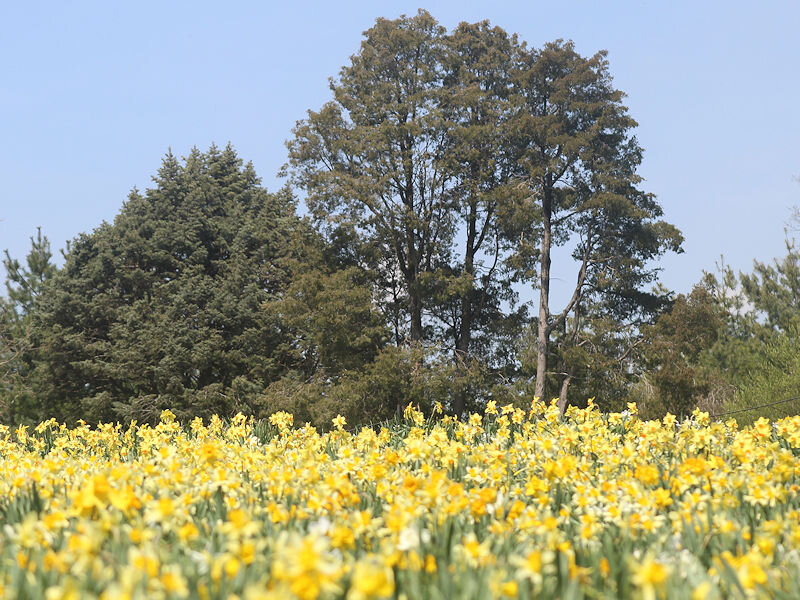
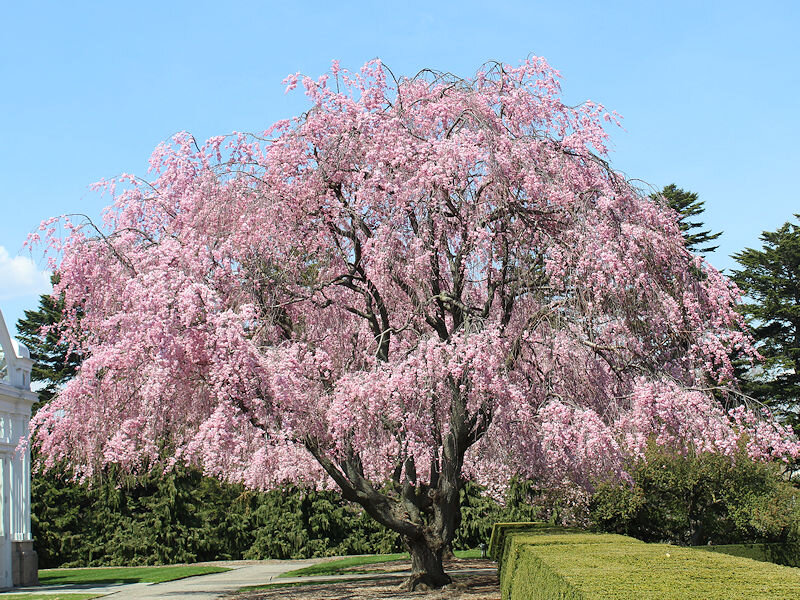
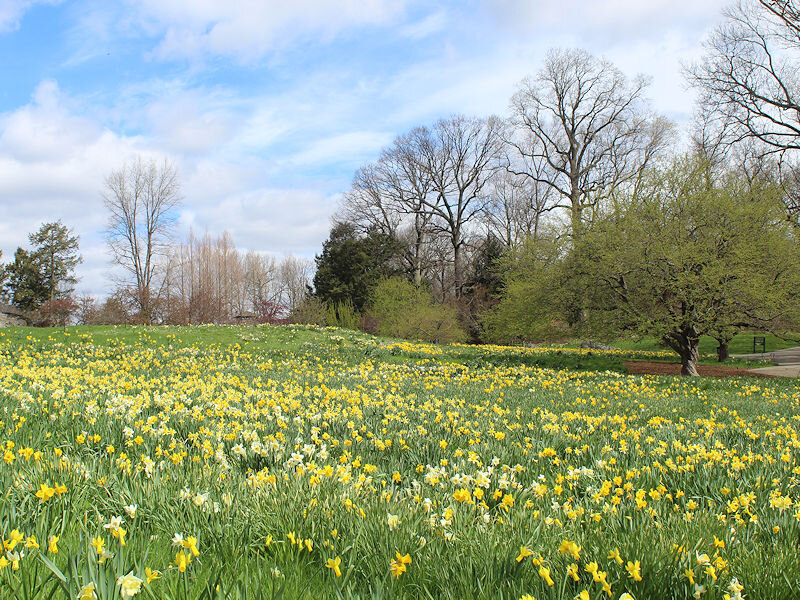
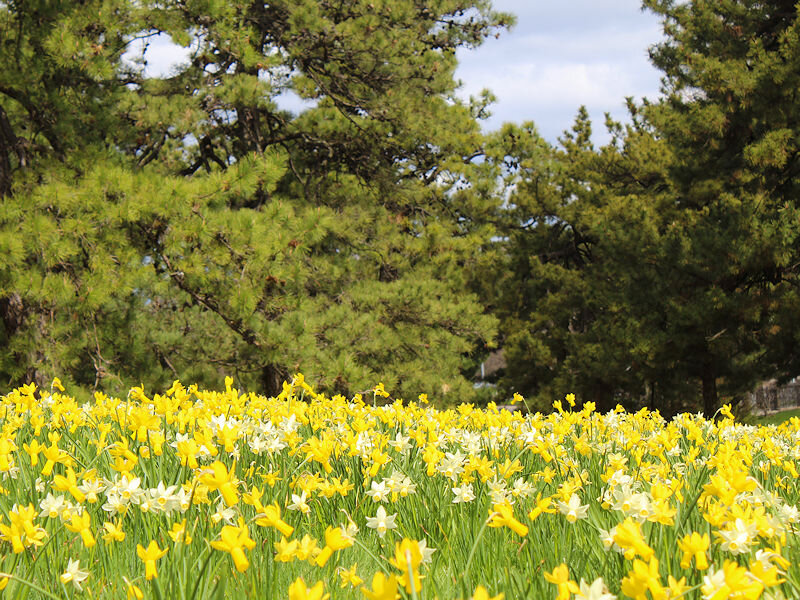
From the New York Botanical Garden early this afternoon:
-
Under partly sunny skies, temperatures soared into the upper 70s and lower 80s away from the coastline. Newark reached 88°, which tied the daily record set in 1941. Thunderstorms moved through the region during the late afternoon and early evening as a front came eastward. Following the frontal passage, tomorrow and Saturday will remain on the warm side of normal. However, a strong cold front will slice across the region on Saturday bringing showers and perhaps gusty thunderstorms. Noticeably cooler air will then pour into the region and persist through at least the middle of next week. The duration and magnitude of the upcoming cool spell could determine whether April finishes with a cool or warm anomaly. The ENSO Region 1+2 anomaly was -1.1°C and the Region 3.4 anomaly was -0.9°C for the week centered around April 6. For the past six weeks, the ENSO Region 1+2 anomaly has averaged -0.73°C and the ENSO Region 3.4 anomaly has averaged -0.92°C. La Niña conditions will likely persist into the start of May. The SOI was +21.63 today. Today was the 10th consecutive day that the SOI was +20.00 or above. The last time that happened was January 8-17, 2011 when the SOI reached +20.00 or above on 10 consecutive days. This is only the 7th time on record that the SOI has been at or above +20.00 for at least 10 consecutive days. Daily figures go back to 1991. The last time a streak of 7 or more such days occurred in April was March 28-April 5, 2011 when the SOI reached at least +20.00 on 9 consecutive days. Then, there was a brief period of much warmer than normal temperatures following the end of that stretch and a longer period of much warmer than normal temperatures starting about 2 1/2 weeks later. The preliminary Arctic Oscillation (AO) was -0.459 today. On April 12 the MJO was in Phase 7 at an amplitude of 0.750 (RMM). The April 11-adjusted amplitude was 0.712 (RMM). Based on sensitivity analysis applied to the latest guidance, there is an implied 45% probability that New York City will have a warmer than normal April (1991-2020 normal). April will likely finish with a mean temperature near 53.5° (0.2° below normal).
-
It's good to see some of the Minot area numbers starting to come in. That was where the heaviest snow was expected to fall.
-
Some snowfall amounts from North Dakota: GLENBURN ND 30.5 3 NNW MINOT ND 30.0 NORWICH ND 28.0 3 ENE VELVA ND 28.0 LANSFORD ND 27.5 4 W RED LODGE MT 27.0 1 NW HEBRON ND 26.5 1 W DUNN CENTER ND 26.0 BURLINGTON ND 26.0 UNDERWOOD ND 24.3 3 S NYE MT 24.0 GLENBURN ND 24.0 10 NE RICHARDTON ND 24.0 10 NE SENTINEL BUTTE ND 24.0 LANSFORD ND 24.0 CARPIO ND 24.0
-
At Billings, the temperature had fallen to 8 degrees. That surpassed the old daily mark of 9 set in 1986 and is the coldest on record so late in the season. Records go back to 1934.
-
Morning thoughts… It will be partly cloudy and very warm today. There could be an afternoon or evening shower or thundershower. High temperatures will likely reach the upper 70s and lower 80s in much of the region. Likely high temperatures around the region include: New York City (Central Park): 80° Newark: 81° Philadelphia: 82° The unseasonable warmth will continue into the start of the weekend. Normals: New York City: 30-Year: 61.3°; 15-Year: 61.7° Newark: 30-Year: 62.1°; 15-Year: 62.5° Philadelphia: 30-Year: 64.3°; 15-Year: 64.7° In the Northern Plains, following a blizzard, the temperature fell into the single digits at Billings for the second consecutive day. The previous latest two consecutive days with such readings occurred on April 11-12, 1997.
-
The warmth will crest tomorrow. Under partly sunny skies, thermometers will soar into the upper 70s and even lower 80s in much of the region. The south shore of Long Island and the Connecticut shore could be exceptions where it is cooler. A shower or thundershower is possible. Overall, tomorrow through Friday will generally be warmer to much warmer than normal. There could be brief interruptions of the warmth from backdoor cold fronts. A blizzard continues to impact the Northern Plains. Parts of North Dakota could see 1-2 feet of snow with locally higher amounts near 3 feet by the time the storm ends tonight or tomorrow. Drifts in excess of 6 feet are likely. The ENSO Region 1+2 anomaly was -1.1°C and the Region 3.4 anomaly was -0.9°C for the week centered around April 6. For the past six weeks, the ENSO Region 1+2 anomaly has averaged -0.73°C and the ENSO Region 3.4 anomaly has averaged -0.92°C. La Niña conditions will likely persist into the start of May. The SOI was +25.74 today. Today was the 9th consecutive day that the SOI was +20.00 or above. The last time that happened was December 20-28, 2011 when the SOI reached +20.00 or above on 9 consecutive days. The last time a streak of 7 or more such days occurred in April was March 28-April 5, 2011 when the SOI reached at least +20.00 on 9 consecutive days. Then, there was a brief period of much warmer than normal temperatures following the end of that stretch and a longer period of much warmer than normal temperatures starting about 2 1/2 weeks later. The preliminary Arctic Oscillation (AO) was -0.968 today. On April 11 the MJO was in Phase 7 at an amplitude of 0.712 (RMM). The April 10-adjusted amplitude was 0.570 (RMM). Based on sensitivity analysis applied to the latest guidance, there is an implied 46% probability that New York City will have a warmer than normal April (1991-2020 normal). April will likely finish with a mean temperature near 53.5° (0.2° below normal).
-
Morning thoughts… It will be variably cloudy and warm today. High temperatures will likely reach the upper 60s and lower 70s in much of the region. Southeast Pennsylvania could see the mercury reach 80°. Likely high temperatures around the region include: New York City (Central Park): 70° Newark: 71° Philadelphia: 80° Much of the week will see above to much above normal temperatures. Back door cold fronts could briefly interrupt the warmth in some areas. Normals: New York City: 30-Year: 60.9°; 15-Year: 61.2° Newark: 30-Year: 61.7°; 15-Year: 62.1° Philadelphia: 30-Year: 63.9°; 15-Year: 64.3° In the Northern Plains, a blizzard is raging. Bismarck picked up 10.0” snowfall yesterday. That is only the 3rd daily snowfall on record of 10” or more on or after April 12. Records go back to 1874.
-
At least 1.3” for the month. That’s still not official, as the 1” total from April 11 hasn’t been put into the books just yet.
-
0.3” of snow in Portland, OR today. https://twitter.com/NWSPortland/status/1514025720170745856?s=20&t=kr4UZ5Sa9F5wj6oDe7i2lw
-
Clouds and light rain gave way to warm sunshine. In response, the temperature soared into the lower 70s in much of the region. Overall, tomorrow through Friday will generally be warmer to much warmer than normal. There could be brief interruptions of the warmth from backdoor cold fronts. A blizzard is currently raging in the Northern Plains. Parts of North Dakota could see 1-2 feet of snow with locally higher amounts near 3 feet. Drifts in excess of 6 feet are likely. The ENSO Region 1+2 anomaly was -1.1°C and the Region 3.4 anomaly was -0.9°C for the week centered around April 6. For the past six weeks, the ENSO Region 1+2 anomaly has averaged -0.73°C and the ENSO Region 3.4 anomaly has averaged -0.92°C. La Niña conditions will likely persist into the start of May. The SOI was +24.44 today. Today was the 8th consecutive day that the SOI was +20.00 or above. The last time that happened was January 20-27, 2012 when the SOI reached +20.00 or above on 8 consecutive days. The last time that happened in April was March 28-April 5, 2011 when the SOI reached at least +20.00 on 9 consecutive days. Then, there was a brief period of much warmer than normal temperatures following the end of that stretch and a longer period of much warmer than normal temperatures starting about 2 1/2 weeks later. The preliminary Arctic Oscillation (AO) was -1.519 today. On April 10 the MJO was in Phase 6 at an amplitude of 0.573 (RMM). The April 9-adjusted amplitude was 0.497 (RMM). Based on sensitivity analysis applied to the latest guidance, there is an implied 48% probability that New York City will have a warmer than normal April (1991-2020 normal). April will likely finish with a mean temperature near 53.6° (0.1° below normal).
-
Morning thoughts… It will be variably cloudy during the morning and partly sunny and unseasonably warm during the afternoon. High temperatures will likely reach the upper 60s and lower 70s in much of the region. Likely high temperatures around the region include: New York City (Central Park): 70° Newark: 72° Philadelphia: 74° Much of the week will see above to much above normal temperatures. Back door cold fronts could briefly interrupt the warmth in some areas. Normals: New York City: 30-Year: 60.5°; 15-Year: 61.2° Newark: 30-Year: 61.3°; 15-Year: 61.7° Philadelphia: 30-Year: 63.4°; 15-Year: 63.9 In the Northern Plains, a blizzard will develop in North Dakota.
-
Noticeably warmer air began moving into the region. Under partly to mostly sunny skies, the temperature reached 61° at New York City's Central Park, 62° at Newark, and 61° at Philadelphia. Meanwhile, Portland, OR saw its latest measurable snowfall on record. At least 1.0" of snow accumulated today. Prior to today, the latest measurable snowfall on record occurred on March 25, 1965 when 0.3" was recorded. The latest 1" or above snowfall occurred on March 8, 1951 when a storm dumped 7.6" of snow. Records go back to 1940. It will be much warmer tomorrow with widespread readings in the 70s. Overall, tomorrow through Friday will generally be warmer to much warmer than normal. There could be brief interruptions of the warmth from backdoor cold fronts. The Northern Plains will witness the development of a major spring blizzard tonight and tomorrow. Parts of North Dakota could see 1-2 feet of snow with drifts in excess of 4 feet. The ENSO Region 1+2 anomaly was -1.1°C and the Region 3.4 anomaly was -0.9°C for the week centered around April 6. For the past six weeks, the ENSO Region 1+2 anomaly has averaged -0.73°C and the ENSO Region 3.4 anomaly has averaged -0.92°C. La Niña conditions will likely persist into the start of May. The SOI was +23.00 today. Today was the 7th consecutive day that the SOI was +20.00 or above. The last time that happened was January 13-19, 2021 when the SOI reached +20.00 or above on 7 consecutive days. The last time that happened in April was March 28-April 5, 2011 when the SOI reached at least +20.00 on 9 consecutive days. Then, there was a brief period of much warmer than normal temperatures following the end of that stretch and a longer period of much warmer than normal temperatures starting about 2 1/2 weeks later. The preliminary Arctic Oscillation (AO) was -1.642 today. On April 9 the MJO was in Phase 6 at an amplitude of 0.499 (RMM). The April 8-adjusted amplitude was 0.366 (RMM). Based on sensitivity analysis applied to the latest guidance, there is an implied 51% probability that New York City will have a warmer than normal April (1991-2020 normal). April will likely finish with a mean temperature near 53.8° (0.1° above normal).
-
Morning thoughts… Warmer air will begin to move into the region. It will be partly sunny and milder today. High temperatures will likely reach the upper 50s and lower 60s in much of the region. Likely high temperatures around the region include: New York City (Central Park): 57° Newark: 59° Philadelphia: 63° Much of the week will see above to much above normal temperatures. Back door cold fronts could briefly interrupt the warmth in some areas. Normals: New York City: 30-Year: 60.1°; 15-Year: 60.4° Newark: 30-Year: 60.9°; 15-Year: 61.3° Philadelphia: 30-Year: 63.0°; 15-Year: 63.6
-
Noticeably warmer air will begin to move into the region starting tomorrow. Tuesday through Friday will generally be warmer to much warmer than normal. There could be brief interruptions of the warmth from backdoor cold fronts. The Northern Plains could witness the development of a major spring snowstorm or blizzard tomorrow night or Tuesday. Parts of North Dakota could see 1-2 feet of snow with drifts in excess of 4 feet. The ENSO Region 1+2 anomaly was -1.0°C and the Region 3.4 anomaly was -0.7°C for the week centered around March 30. For the past six weeks, the ENSO Region 1+2 anomaly has averaged -0.80°C and the ENSO Region 3.4 anomaly has averaged -0.90°C. La Niña conditions will likely persist into at least mid-April. The SOI was +21.41 today. Today was the 6th consecutive day that the SOI was +20.00 or above. The last time that happened was January 13-19, 2021 when the SOI reached +20.00 or above on 7 consecutive days. The last time that happened in April was March 28-April 5, 2011 when the SOI reached at least +20.00 on 9 consecutive days. Then, there was a brief period of much warmer than normal temperatures following the end of that stretch and a longer period of much warmer than normal temperatures starting about 2 1/2 weeks later. The preliminary Arctic Oscillation (AO) was -0.977 today. On April 8 the MJO was in Phase 5 at an amplitude of 0.355 (RMM). The April 7-adjusted amplitude was 0.423 (RMM). Based on sensitivity analysis applied to the latest guidance, there is an implied 54% probability that New York City will have a warmer than normal April (1991-2020 normal). April will likely finish with a mean temperature near 54.0° (0.3° above normal).
-
It is quite springlike here in terms of flowers. Some were damaged by the late March cold.
-
Despite considerable clouds, sprinkles, and a temperature in the upper 40s, spring scenes are widespread throughout the New York Botanical Garden.


-
Morning thoughts… It will be partly sunny and cool today. High temperatures will likely reach the lower 50s in much of the region. Likely high temperatures around the region include: New York City (Central Park): 52° Newark: 53° Philadelphia: 53° It will turn warmer starting tomorrow and much of the week will see above to much above normal temperatures. Back door cold fronts could briefly interrupt the warmth in some areas. Normals: New York City: 30-Year: 59.6°; 15-Year: 60.0° Newark: 30-Year: 60.9°; 15-Year: 61.3° Philadelphia: 30-Year: 62.6°; 15-Year: 63.2°
-
Tomorrow will be partly to mostly sunny and cooler. Noticeably warmer air will likely move into the region early next week. The warmth will likely continue through much of the week before cooler air returns. There could be brief interruptions of the warmth from backdoor cold fronts. The ENSO Region 1+2 anomaly was -1.0°C and the Region 3.4 anomaly was -0.7°C for the week centered around March 30. For the past six weeks, the ENSO Region 1+2 anomaly has averaged -0.80°C and the ENSO Region 3.4 anomaly has averaged -0.90°C. La Niña conditions will likely persist into at least mid-April. The SOI was +24.30 today. The preliminary Arctic Oscillation (AO) was -0.208 today. On April 7 the MJO was in Phase 3 at an amplitude of 0.420 (RMM). The April 6-adjusted amplitude was 0.520 (RMM). Based on sensitivity analysis applied to the latest guidance, there is an implied 52% probability that New York City will have a warmer than normal April (1991-2020 normal). April will likely finish with a mean temperature near 53.9° (0.2° above normal).
-
Morning thoughts… It will be variably cloudy with some showers. High temperatures will likely reach the middle and upper 50s in much of the region. Likely high temperatures around the region include: New York City (Central Park): 57° Newark: 58° Philadelphia: 59° Temperatures will be near or somewhat below normal through the weekend. Normals: New York City: 30-Year: 59.2°; 15-Year: 59.6° Newark: 30-Year: 60.0°; 15-Year: 60.5° Philadelphia: 30-Year: 62.2°; 15-Year: 62.8°
-
Rain will return tomorrow. Showers and periods of rain are likely. Readings will be confined to the 50s tomorrow and Sunday, even Sunday is partly to mostly sunny. Noticeably warmer air will likely move into the region early next week. The warmth will likely continue through much of the week before cooler air returns. The ENSO Region 1+2 anomaly was -1.0°C and the Region 3.4 anomaly was -0.7°C for the week centered around March 30. For the past six weeks, the ENSO Region 1+2 anomaly has averaged -0.80°C and the ENSO Region 3.4 anomaly has averaged -0.90°C. La Niña conditions will likely persist into at least mid-April. The SOI was +22.13 today. The preliminary Arctic Oscillation (AO) was -0.038 today. On April 5 the MJO was in Phase 3 at an amplitude of 0.516 (RMM). The April 4-adjusted amplitude was 0.530 (RMM). Based on sensitivity analysis applied to the latest guidance, there is an implied 51% probability that New York City will have a warmer than normal April (1991-2020 normal). April will likely finish with a mean temperature near 53.9° (0.2° above normal).

