

donsutherland1
-
Posts
24,117 -
Joined
Content Type
Profiles
Blogs
Forums
American Weather
Media Demo
Store
Gallery
Everything posted by donsutherland1
-
Texas/Oklahoma Discussion & Obs Thread 2022
donsutherland1 replied to It's Always Sunny's topic in Central/Western States
Yesterday’s low temperature of 86 at Galveston was that city’s earliest such minimum temperature on record. The previous mark was set on August 8, 2019. -
Galveston’s Record Warm Late Spring and Early Summer
donsutherland1 replied to donsutherland1's topic in Climate Change
Yesterday’s low temperature of 86 at Galveston was that city’s earliest such minimum temperature on record. The previous mark was set on August 8, 2019. -
Morning thoughts… Today will be mostly cloudy and very cool for the season. There will be showers and periods of rain. High temperatures will reach the upper 60s and lower 70s in most of the region except upper 70s in southern New Jersey and southeastern Pennsylvania. Likely high temperatures around the region include: New York City (Central Park): 69° Newark: 72° Philadelphia: 79° The cool temperatures will persist through tomorrow. Normals: New York City: 30-Year: 81.7°; 15-Year: 81.6° Newark: 30-Year: 84.0°; 15-Year: 84.0° Philadelphia: 30-Year: 85.2°; 15-Year: 85.4°
-
Occasional Thoughts on Climate Change
donsutherland1 replied to donsutherland1's topic in Climate Change
Interesting paper. It provides yet more evidence of the anthropogenic role that is driving an increase in marine heatwaves. -
Tomorrow will be mainly cloudy with showers and periods of rain. It will be unseasonably cool. The unseasonably cool weather will continue through Thursday before warmer air returns. During June 16-20, the MJO has been in Phase 1 at an amplitude of 1.500 or above. Of the six cases that saw such an outcome during June 15-25 (1988, 2003, 2010, 2012, 2017 and 2020), four had a warmer than normal July, one was somewhat cooler than normal and one was cooler than normal. The ECMWF seasonal forecast indicates that the summer will be warmer than normal throughout the region and across much of North America. Based on how the pattern has been evolving during the spring transition to summer, it is more likely than not that the warmest anomalies of the summer will likely occur in July and August with June being the coolest of the three months in the Northeast. The latest ECMWF monthly forecast indicates that July will be warmer than June relative to normal and that August will be the warmest summer month relative to normal. The ENSO Region 1+2 anomaly was -1.6°C and the Region 3.4 anomaly was -0.6°C for the week centered around June 8. For the past six weeks, the ENSO Region 1+2 anomaly has averaged -1.30°C and the ENSO Region 3.4 anomaly has averaged -0.90°C. La Niña conditions will likely persist through the summer. The SOI was +18.06 today. The preliminary Arctic Oscillation (AO) was +1.404 today. On June 19 the MJO was in Phase 1 at an amplitude of 1.717 (RMM). The June 18-adjusted amplitude was 1.868 (RMM). Based on sensitivity analysis applied to the latest guidance, there is an implied 71% probability that New York City will have a cooler than normal June (1991-2020 normal). June will likely finish with a mean temperature near 71.3° (0.7° below normal).
-
Morning thoughts… Today will be increasingly cloudy somewhat cooler than normal. High temperatures will reach the lower and middle 70s in most of the region. Likely high temperatures around the region include: New York City (Central Park): 77° Newark: 82° Philadelphia: 82° Tomorrow will be mostly cloudy with showers and periods of rain. It will be unreasonably cool. Normals: New York City: 30-Year: 81.4°; 15-Year: 81.3° Newark: 30-Year: 83.7°; 15-Year: 83.7° Philadelphia: 30-Year: 85.0°; 15-Year: 85.2°
-
Cooler air will again push into the region. The unseasonably cool weather will continue until after midweek before warmer air returns. Meanwhile, parts of the North Central United States and South saw record heat. Records included: Duluth: 93° (old record: 88°, 1995) Galveston: 97° (old record: 94°, 1875 and 1933) Houston: 102° (old record: 101°, 1902) Minneapolis-St. Paul: 100° (old record: 98°, 1933) During June 16-20, the MJO has been in Phase 1 at an amplitude of 1.500 or above. Of the six cases that saw such an outcome during June 15-25 (1988, 2003, 2010, 2012, 2017 and 2020), four had a warmer than normal July, one was somewhat cooler than normal and one was cooler than normal. The ECMWF seasonal forecast indicates that the summer will be warmer than normal throughout the region and across much of North America. Based on how the pattern has been evolving during the spring transition to summer, it is more likely than not that the warmest anomalies of the summer will likely occur in July and August with June being the coolest of the three months in the Northeast. The latest ECMWF monthly forecast indicates that July will be warmer than June relative to normal and that August will be the warmest summer month relative to normal. The ENSO Region 1+2 anomaly was -1.6°C and the Region 3.4 anomaly was -0.6°C for the week centered around June 8. For the past six weeks, the ENSO Region 1+2 anomaly has averaged -1.30°C and the ENSO Region 3.4 anomaly has averaged -0.90°C. La Niña conditions will likely persist through the summer. The SOI was +22.63 today. The preliminary Arctic Oscillation (AO) was +0.998 today. On June 18 the MJO was in Phase 1 at an amplitude of 1.870 (RMM). The June 17-adjusted amplitude was 1.980 (RMM). Based on sensitivity analysis applied to the latest guidance, there is an implied 65% probability that New York City will have a cooler than normal June (1991-2020 normal). June will likely finish with a mean temperature near 71.5° (0.5° below normal).
-
Morning thoughts… Today will be mostly sunny and somewhat warmer. High temperatures will reach the upper 70s and lower 80s in most of the region. Likely high temperatures around the region include: New York City (Central Park): 78° Newark: 83° Philadelphia: 81° Tomorrow will see a return of cooler air. Normals: New York City: 30-Year: 81.1°; 15-Year: 81.0° Newark: 30-Year: 83.4°; 15-Year: 83.4° Philadelphia: 30-Year: 84.7°; 15-Year: 84.9°
-
Despite deep blue skies and brilliant sunshine, temperatures only reached the lower and middle 70s in much of the area. Tomorrow will be another very cool day before temperatures briefly warm up on Tuesday. The unseasonably cool weather will continue through midweek before warmer air returns. Meanwhile, record heat continued to affect parts of the Plains States and the South. Records included: Bismarck: 100° (old record: 97°, 1933, 1988 and 1989) Fargo: 101° (tied record set in 1933) Galveston: 97° (old record: 95°, 1875) Grand Forks, ND: 100° (old record: 95°, 1933) In Europe, the historic early-season heat shifted eastward toppling records. High temperatures included: Beaucouze, France: 101° Beznau, Switzerland: 98° Berlin: 100° Bordeaux, France: 101° Cognac, France: 101° Cottbus, Germany: 103° Doksany, Czech Republic: 102° Dresden: 100° Geneva: 96° Husinec, Czech Republic: 102° Le Mans, France: 100° Leipzig, Germany: 99° Lindenberg, Germany: 100° Pila, Poland: 99° Potsdam, Germany: 99° Slubice, Poland: 101° Strasbourg, France: 100° During June 16-18, the MJO has been in Phase 1 at an amplitude of 1.500 or above. Of the six cases that saw such an outcome during June 15-25 (1988, 2003, 2010, 2012, 2017 and 2020), four had a warmer than normal July, one was somewhat cooler than normal and one was cooler than normal. The ECMWF seasonal forecast indicates that the summer will be warmer than normal throughout the region and across much of North America. Based on how the pattern has been evolving during the spring transition to summer, it is more likely than not that the warmest anomalies of the summer will likely occur in July and August with June being the coolest of the three months in the Northeast. The latest ECMWF monthly forecast indicates that July will be warmer than June relative to normal and that August will be the warmest summer month relative to normal. The ENSO Region 1+2 anomaly was -1.6°C and the Region 3.4 anomaly was -0.7°C for the week centered around June 8. For the past six weeks, the ENSO Region 1+2 anomaly has averaged -1.28°C and the ENSO Region 3.4 anomaly has averaged -1.00°C. La Niña conditions will likely persist through the summer. The SOI was +20.31 today. The preliminary Arctic Oscillation (AO) was +0.903 today. On June 17 the MJO was in Phase 1 at an amplitude of 1.979 (RMM). The June 16-adjusted amplitude was 2.065 (RMM). Based on sensitivity analysis applied to the latest guidance, there is an implied 55% probability that New York City will have a cooler than normal June (1991-2020 normal). June will likely finish with a mean temperature near 71.7° (0.3° below normal).
-
Morning thoughts… Today started out with near record and record cold. At Binghamton, the temperature fell to 43°, which set a new record low for the date. The old record of 44° was set in 1956. It will be mostly sunny and cool. High temperatures will reach the lower and middle 70s in most of the region. Likely high temperatures around the region include: New York City (Central Park): 72° Newark: 77° Philadelphia: 76° Tomorrow will see a continuation of the cool weather. Normals: New York City: 30-Year: 80.8°; 15-Year: 80.7° Newark: 30-Year: 83.1°; 15-Year: 83.1° Philadelphia: 30-Year: 84.4°; 15-Year: 84.6°
-
Under a partly cloudy to mainly clear skies, temperatures will fall into the lower to middle 50s across much of the region. Some locations could see the mercury dip below 50°. Tomorrow will be fair but unseasonably cool. The unseasonably cool weather will continue until midweek next week before warmer air returns. Meanwhile, near record and record heat prevailed in parts of the Gulf Coast Region. High temperatures included: Jackson: 97° Mobile: 101° (old record: 100°, 1913, 1944 and 1953) Montgomery, AL: 98° New Orleans: 96° (tied record set in 1990 and tied in 2011) Pensacola: 100° (tied record set in 1953) Tallahassee: 99° Tampa: 98° (old record: 96°, 1975, 1998, and 2009) Across the Atlantic Ocean, a record early-season heatwave continued to scorch parts of western Europe. High temperatures included: Basel, Switzerland: 96° Biarritz, France: 109° Biscarosse, France: 107° Cap Ferret, France: 107° Cognac, France: 104° Lyon, France: 101° Offenbach-Wetterpark, Germany: 97° Paris: 98° Tours, France: 102° During June 16-18, the MJO has been in Phase 1 at an amplitude of 1.500 or above. Of the six cases that saw such an outcome during June 15-25 (1988, 2003, 2010, 2012, 2017 and 2020), four had a warmer than normal July, one was somewhat cooler than normal and one was cooler than normal. The ECMWF seasonal forecast indicates that the summer will be warmer than normal throughout the region and across much of North America. Based on how the pattern has been evolving during the spring transition to summer, it is more likely than not that the warmest anomalies of the summer will likely occur in July and August with June being the coolest of the three months in the Northeast. The latest ECMWF monthly forecast indicates that July will be warmer than June relative to normal and that August will be the warmest summer month relative to normal. The ENSO Region 1+2 anomaly was -1.6°C and the Region 3.4 anomaly was -0.7°C for the week centered around June 8. For the past six weeks, the ENSO Region 1+2 anomaly has averaged -1.28°C and the ENSO Region 3.4 anomaly has averaged -1.00°C. La Niña conditions will likely persist through the summer. The SOI was +28.05 today. The preliminary Arctic Oscillation (AO) was +0.883 today. On June 16 the MJO was in Phase 1 at an amplitude of 2.071 (RMM). The June 15-adjusted amplitude was 1.888 (RMM). Based on sensitivity analysis applied to the latest guidance, there is an implied 50% probability that New York City will have a warmer than normal June (1991-2020 normal). June will likely finish with a mean temperature near 72.0° (normal).
-
Morning thoughts… Today will be mostly sunny and cool. High temperatures will reach the lower and middle 70s in most of the region. Likely high temperatures around the region include: New York City (Central Park): 70° Newark: 73° Philadelphia: 74° Tomorrow and Monday will see a continuation of the cool weather. Normals: New York City: 30-Year: 80.6°; 15-Year: 80.4° Newark: 30-Year: 82.8°; 15-Year: 82.8° Philadelphia: 30-Year: 84.1°; 15-Year: 84.3°
-
A piece of the air mass responsible for record-breaking heat in the Plains States and Great Lakes Region moved across the Middle Atlantic region today. Near record and record high temperatures in the Southeast and Middle Atlantic Region included: Atlantic City: 93° Baltimore: 96° (tied record set in 1939) Bridgeport: 90° Charlotte: 98° Columbia, SC: 100° Islip: 90° (old record: 88°, 2000) Lynchburg: 96° (tied record set in 1944) New York City-JFK: 94° New York City-LGA: 92° Newark: 95° Norfolk: 97° (tied record set in 1891 and tied in 1945) Philadelphia: 96° Raleigh: 98° Richmond: 97° Sterling, VA: 96° (old record: 92°, 1994) Washington, DC: 99° (old record: 97°, 2014) Wilmington, DE: 95° Wilmington, NC: 96° Following today's brief burst of heat, much cooler air will return for the weekend. The unseasonably cool weather will continue until midweek next week before warmer air returns. Across the Atlantic Ocean, a record early-season heatwave scorched parts of western Europe. High temperatures included: Andujar, Spain: 112° Carcassonne, France: 105° Cognac, France: 102° London: 91° Nimes, France: 105° Paris: 95° The ECMWF seasonal forecast indicates that the summer will be warmer than normal throughout the region and across much of North America. Based on how the pattern has been evolving during the spring transition to summer, it is more likely than not that the warmest anomalies of the summer will likely occur in July and August with June being the coolest of the three months in the Northeast. The latest ECMWF monthly forecast indicates that July will be warmer than June relative to normal and that August will be the warmest summer month relative to normal. The ENSO Region 1+2 anomaly was -1.6°C and the Region 3.4 anomaly was -0.7°C for the week centered around June 8. For the past six weeks, the ENSO Region 1+2 anomaly has averaged -1.28°C and the ENSO Region 3.4 anomaly has averaged -1.00°C. La Niña conditions will likely persist through the summer. The SOI was +23.55 today. The preliminary Arctic Oscillation (AO) was +0.342 today. On June 15 the MJO was in Phase 1 at an amplitude of 1.893 (RMM). The June 14-adjusted amplitude was 1.594 (RMM). Based on sensitivity analysis applied to the latest guidance, there is an implied 52% probability that New York City will have a warmer than normal June (1991-2020 normal). June will likely finish with a mean temperature near 72.2° (0.2° above normal).
-
99 so far.
-
Morning thoughts… Today will be mostly sunny and very warm. High temperatures will reach the upper 80s and lower 90s in most of the region. Likely high temperatures around the region include: New York City (Central Park): 89° Newark: 94° Philadelphia: 95° Much cooler air will arrive for the weekend. Normals: New York City: 30-Year: 80.3°; 15-Year: 80.1° Newark: 30-Year: 82.5°; 15-Year: 82.5° Philadelphia: 30-Year: 83.8°; 15-Year: 84.0°
-
Tomorrow will be a very warm day with readings reaching the upper 80s in New York City and perhaps lower 90s in Newark and Philadelphia. Much cooler air will return for the weekend. The ECMWF seasonal forecast indicates that the summer will be warmer than normal throughout the region and across much of North America. Based on how the pattern has been evolving during the spring transition to summer, it is more likely than not that the warmest anomalies of the summer will likely occur in July and August with June being the coolest of the three months in the Northeast. The latest ECMWF monthly forecast indicates that July will be warmer than June relative to normal and that August will be the warmest summer month relative to normal. The ENSO Region 1+2 anomaly was -1.6°C and the Region 3.4 anomaly was -0.7°C for the week centered around June 8. For the past six weeks, the ENSO Region 1+2 anomaly has averaged -1.28°C and the ENSO Region 3.4 anomaly has averaged -1.00°C. La Niña conditions will likely persist through the summer. The SOI was +16.52 today. The SOI was unchanged from yesterday. The last time that happened was December 24-25, 2020. The preliminary Arctic Oscillation (AO) was -0.056 today. On June 14 the MJO was in Phase 1 at an amplitude of 1.587 (RMM). The June 13-adjusted amplitude was 1.338 (RMM). Based on sensitivity analysis applied to the latest guidance, there is an implied 52% probability that New York City will have a warmer than normal June (1991-2020 normal). June will likely finish with a mean temperature near 72.2° (0.2° above normal).
-
Morning thoughts… At 6:10, a line of showers and thunderstorms stretched from just west of Wilmington, DE to just south of Albany. After some early showers and thundershowers, it will be variably cloudy and cooler. Additional showers and thunderstorms are likely as a warm front moves slowly across the region. High temperatures will reach the middle and upper 70s in most of the region. Likely high temperatures around the region include: New York City (Central Park): 73° Newark: 77° Philadelphia: 81° Tomorrow will be very warm, but much cooler air will arrive for the weekend. Normals: New York City: 30-Year: 80.0°; 15-Year: 79.8° Newark: 30-Year: 82.1°; 15-Year: 82.2° Philadelphia: 30-Year: 83.5°; 15-Year: 83.7°
-
Galveston’s Record Warm Late Spring and Early Summer
donsutherland1 replied to donsutherland1's topic in Climate Change
At Galveston, which has seen two consecutive warm monthly records, June 1-15 was, by far, the warmest first half of June on record. The mean temperature was 87.1°. The old record was 85.3°, which was set in 2018. Galveston has already seen 9 days with low temperatures of 83° or above. The previous record for the entire month was 7 days. That record was set in 1994. Records go back to June 1874. -
The passage of a warm front could bring some showers or thundershowers tomorrow. Friday will be a very warm day with readings reaching the upper 80s in New York City and perhaps lower 90s in Newark and Philadelphia. Much cooler air will return for the weekend. Intense heat scorched the Great Lakes Region and Southeast today. Record high temperatures included: Athens, GA: 99° (tied record set in 1918) Atlanta: 99° (old record: 96°, 143 and 1952) Chicago: 96° (old record: 95°, 1952, 1954 and 1994) Flint, MI: 93° (tied record set in 1954 and tied in 1988) Lansing, MI: 95° (92°, 1894, 1954, 1967, 1988, and 1994) Macon, GA: 104° (old record: 100°, 2010 and 2011) Rockford, IL: 97° (old record: 95°, 1994) Toledo: 98° (old record: 96°, 1994) Youngstown, OH: 93° (tied record set in 1994) At Galveston, which has seen two consecutive warm monthly records, June 1-15 was, by far, the warmest first half of June on record. The mean temperature was 87.1°. The old record was 85.3°, which was set in 2018. Galveston has already seen 9 days with low temperatures of 83° or above. The previous record for the entire month was 7 days. That record was set in 1994. Records go back to June 1874. In the desert Southwest, today marked the beginning of monsoon season. Phoenix could receive measurable rainfall on Saturday and perhaps Sunday as the first monsoonal moisture flows northward. The wettest monsoon season brought 9.56" of rain to Phoenix during 1984. The driest season was 1924 when just 0.35" of rain was measured. Phoenix receives an average of 2.42" of rain during the monsoon season (1991-2020). In 1961-90, the average was 2.78". Ongoing aridification is reducing precipitation to the Southwest. The ECMWF seasonal forecast indicates that the summer will be warmer than normal throughout the region and across much of North America. Based on how the pattern has been evolving during the spring transition to summer, it is more likely than not that the warmest anomalies of the summer will likely occur in July and August with June being the coolest of the three months in the Northeast. The latest ECMWF monthly forecast indicates that July will be warmer than June relative to normal and that August will be the warmest summer month relative to normal. The ENSO Region 1+2 anomaly was -1.6°C and the Region 3.4 anomaly was -0.7°C for the week centered around June 8. For the past six weeks, the ENSO Region 1+2 anomaly has averaged -1.28°C and the ENSO Region 3.4 anomaly has averaged -1.00°C. La Niña conditions will likely persist through the summer. The SOI was +16.52 today. The preliminary Arctic Oscillation (AO) was +0.413 today. On June 13 the MJO was in Phase 1 at an amplitude of 1.340 (RMM). The June 12-adjusted amplitude was 1.251 (RMM). Based on sensitivity analysis applied to the latest guidance, there is an implied 54% probability that New York City will have a warmer than normal June (1991-2020 normal). June will likely finish with a mean temperature near 72.3° (0.4° above normal).
-
Morning thoughts… It will be partly cloudy and warm. High temperatures will reach the lower and middle 80s in most of the region. Likely high temperatures around the region include: New York City (Central Park): 81° Newark: 86° Philadelphia: 88° Much cooler air will arrive for the weekend.
-
Hottest Weather So Far Lies Ahead for Phoenix
donsutherland1 replied to donsutherland1's topic in Central/Western States
Tomorrow will mark the start of monsoon season in the Southwest. Phoenix could see some early monsoonal rains this weekend. Below are Phoenix’s monsoon season highlights: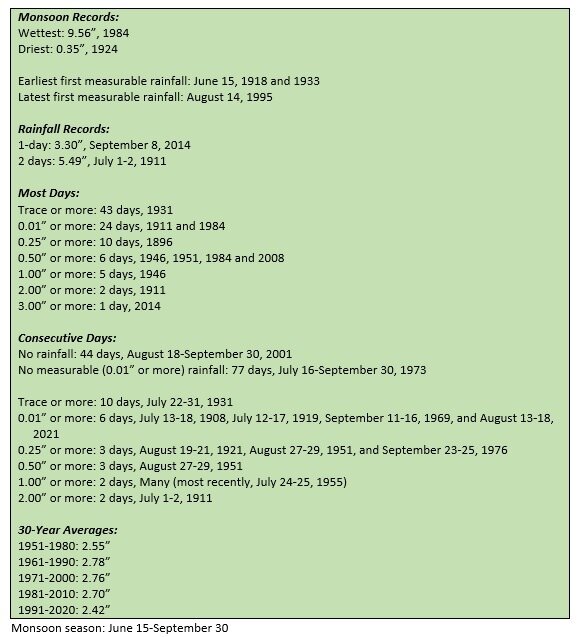
-
Tomorrow will be another partly sunny and warm day. The passage of a warm front could bring some showers or thundershowers on Thursday. Overall, the remainder of the week will generally see somewhat above normal to above normal temperatures. Intense heat moved into the Great Lakes Region today. High temperatures included: Atlanta: 95° Charleston, SC: 98° Chicago: 98° Fayetteville, NC: 100° (tied record set in 1940) Indianapolis: 93° Lexington, KY: 95° (old record: 94°, 1943 and 1988) Rockford, IL: 98° (tied record set in 1987) Savannah: 98° St. Louis: 99° (old record: 97°, 1987) Tomorrow will be another very hot day in parts of the Great Lakes Region before cooler air returns. The core of the heat will not likely move into the Northeast. As a result, New York City will likely see temperatures peak in the middle and upper 80s on Friday. Newark could reach 90°. The ECMWF seasonal forecast indicates that the summer will be warmer than normal throughout the region and across much of North America. Based on how the pattern has been evolving during the spring transition to summer, it is more likely than not that the warmest anomalies of the summer will likely occur in July and August with June being the coolest of the three months in the Northeast. The latest ECMWF monthly forecast indicates that July will be warmer than June relative to normal and that August will be the warmest summer month relative to normal. The ENSO Region 1+2 anomaly was -1.6°C and the Region 3.4 anomaly was -0.7°C for the week centered around June 8. For the past six weeks, the ENSO Region 1+2 anomaly has averaged -1.28°C and the ENSO Region 3.4 anomaly has averaged -1.00°C. La Niña conditions will likely persist through the summer. The SOI was +20.03 today. The preliminary Arctic Oscillation (AO) was +1.360 today. On June 12 the MJO was in Phase 1 at an amplitude of 1.251 (RMM). The June 11-adjusted amplitude was 1.141 (RMM). Based on sensitivity analysis applied to the latest guidance, there is an implied 55% probability that New York City will have a warmer than normal June (1991-2020 normal). June will likely finish with a mean temperature near 72.4° (0.4° above normal).
-
NCEI has also been having issues with its sites. Not all current data is available.
-
Morning thoughts… It will be partly cloudy and warm. High temperatures will reach the lower and middle 80s in most of the region. Likely high temperatures around the region include: New York City (Central Park): 82° Newark: 87° Philadelphia: 82° Through Friday, temperatures will be generally above normal.

