donsutherland1
-
Posts
24,197 -
Joined
Content Type
Profiles
Blogs
Forums
American Weather
Media Demo
Store
Gallery
Everything posted by donsutherland1
-
“Cory’s in NYC! Let’s HECS!” Feb. 22-24 Disco
donsutherland1 replied to TheSnowman's topic in New England
I'm not sure which model or models are responsible for the snowy Maine NBM figures. -
“Cory’s in NYC! Let’s HECS!” Feb. 22-24 Disco
donsutherland1 replied to TheSnowman's topic in New England
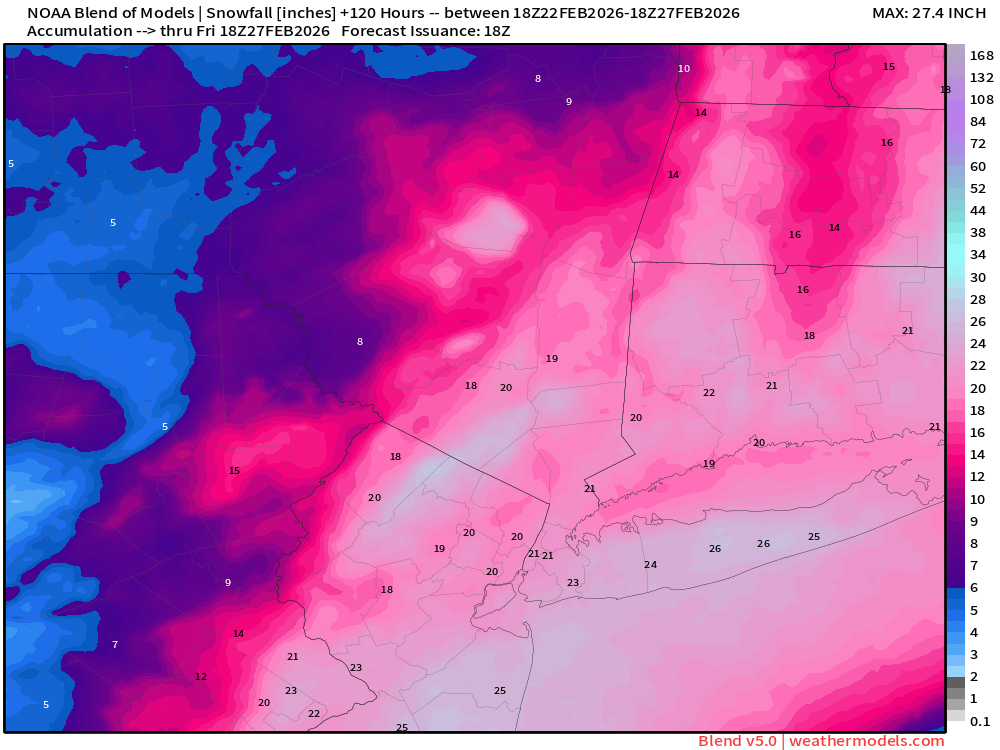
The 21z NBM (v.5.0):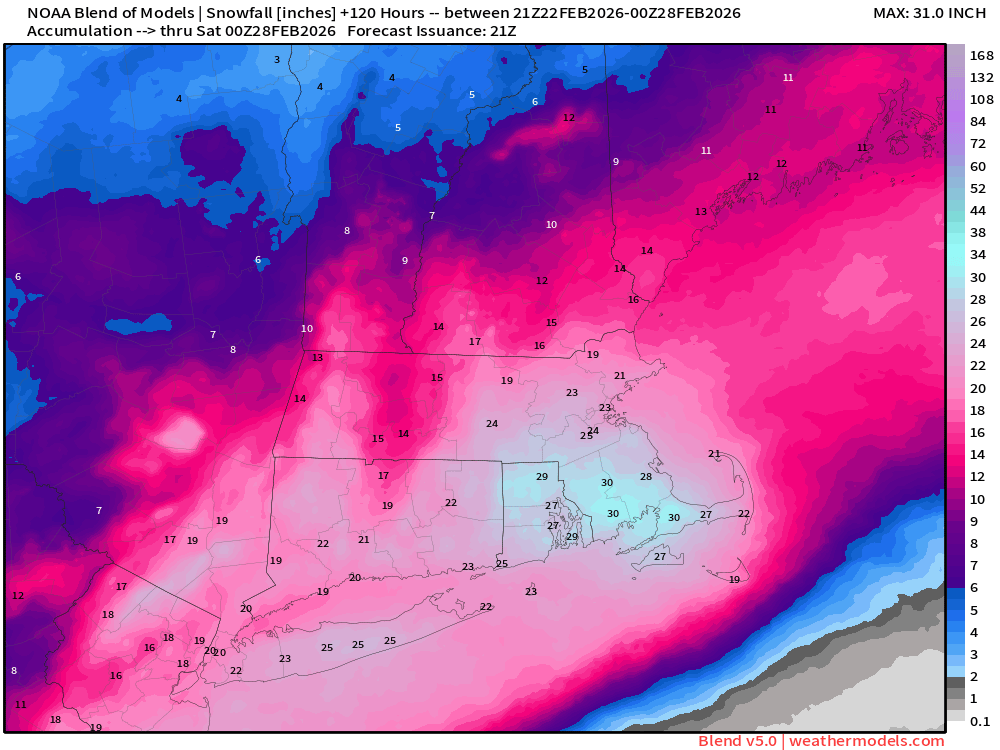
-
Canon EOS
-
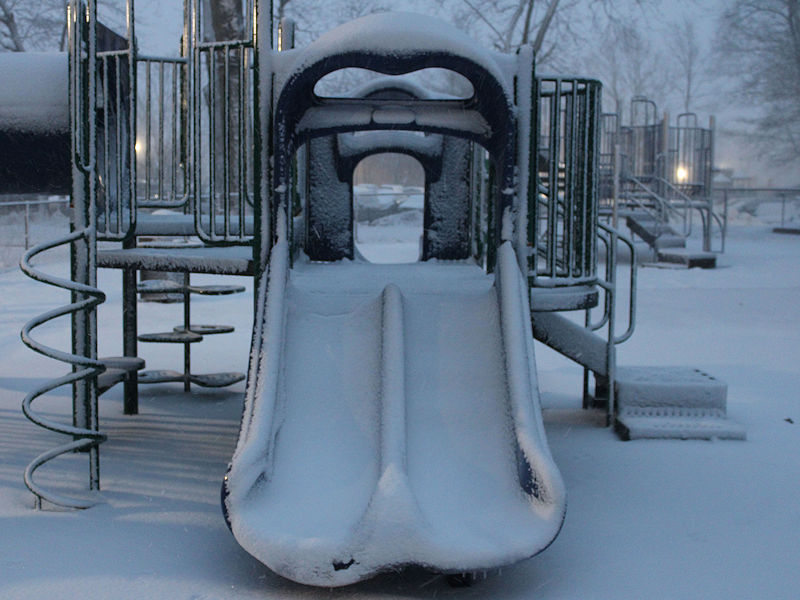
Moderate snow is now falling in Larchmont. There is a solid coating on all surfaces.
-
February 2026 OBS & Discussion
donsutherland1 replied to Stormlover74's topic in New York City Metro
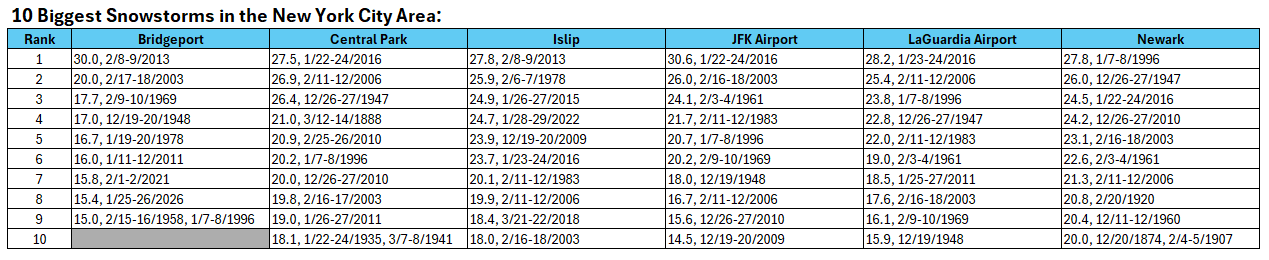
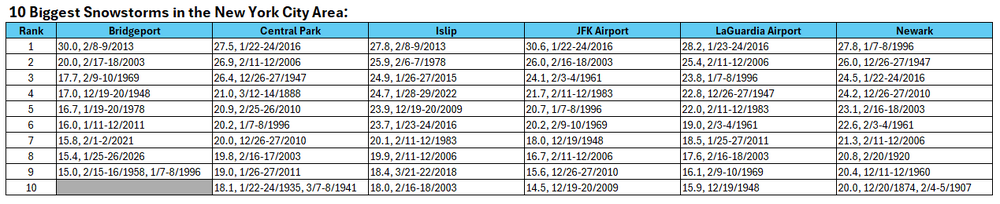
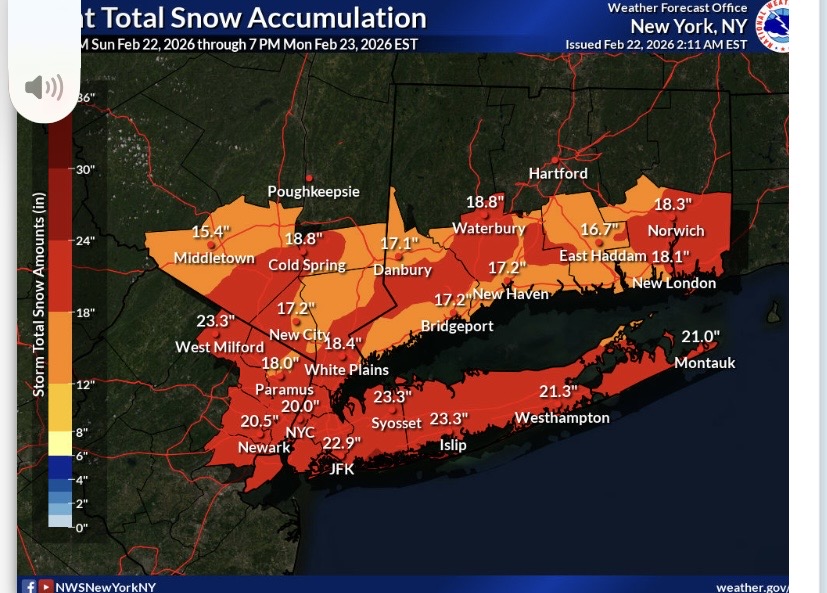
A major blizzard is getting underway. A rapidly developing storm will bring heavy snow and high winds to the region into tomorrow afternoon. At present, a 16"-22" snowfall appears likely in New York City and its nearby suburbs. Somewhat lesser amounts are likely north and west of New York City. A 18"-24" snowfall is likely across central New Jersey and part of Long Island. Blizzard conditions are likely at the height of the storm late Sunday night into Monday morning across much of the region. Winds will likely gust near 60 mph creating extremely low visibilities and large drifts. Final estimates: Allentown: 8"-12" Atlantic City: 8"-16" Baltimore: 4"-8" Binghamton: 2"-4" Boston: 18"-24" Bridgeport: 14"-20" Harrisburg: 4"-8" Hartford: 8"-12" Islip: 18"-24" New York City: 16"-22" Newark: 16"-22" Philadelphia: 12"-18" Providence: 18"-24" Scranton: 3"-6" Washington, DC: 3"-6" Wilmington: 12"-18" New York City's 10 Biggest Snowstorms: 1 27.5", January 22-24, 2016 2 26.9", February 11-12, 2006 3 26.4", December 26-27, 1947 4 21.0", March 12-14, 1888 5 20.9", February 25-26, 2010 6 20.2", January 7-8, 1996 7 20.0", December 26-27, 2010 8 19.8", February 16-17, 2003 9 19.0", January 26-27, 2011 10 18.1", January 22-24, 1935 and March 7-8, 1941 As a result, Winter 2025-2026 will become just the 10th winter with two 10" or above snowstorms in New York City. The others are 1895-1996, 1925-1926, 1960-1961, 1977-1978, 1995-1996, 2003-2004, 2009-2010 (3 such storms), 2010-2011, and 2013-2014. Even more impressive, Winter 2025-2026 will be on track to join Winters 1960-1961 and 1977-1978 as the only winters with two or more 10" snowstorms, a seasonal mean temperature of 32° or below and seasonal snowfall of 30.0" or above. The ENSO Region 1+2 anomaly was +0.7°C and the Region 3.4 anomaly was -0.2°C for the week centered around February 11. For the past six weeks, the ENSO Region 1+2 anomaly has averaged -0.03°C and the ENSO Region 3.4 anomaly has averaged -0.47°C. Neutral ENSO conditions are now developing. Neutral ENSO conditions will develop during the close of winter. The SOI was +6.48 today. The preliminary Arctic Oscillation (AO) was -0.211 today. Based on sensitivity analysis applied to the latest guidance, there is an implied near 100% probability that New York City will have a cooler than normal February (1991-2020 normal). February will likely finish with a mean temperature near 31.6° (4.3° below normal). Supplemental Information: The projected mean would be 3.7° below the 1981-2010 normal monthly value. Overall, Winter 2025-2026 is on track for a seasonal mean temperature of 32.0°. If a 32.0° or below seasonal mean temperature occurs, that would be the lowest winter mean temperature since Winter 2014-2015 when the mean temperature was 31.7°. Winter 2025-2026 would only become the fourth winter of the 21st century with a mean temperature of 32.0° or below. -
Blizzard of 2026 Storm Thread/OBS
donsutherland1 replied to Mikeymac5306's topic in Philadelphia Region
The Pennsylvania map for the NBM:
-
I will post the PA map. Unfortunately, there is no map that zooms in on SE PA, which is surprising given that Philadelphia is a major city.
-
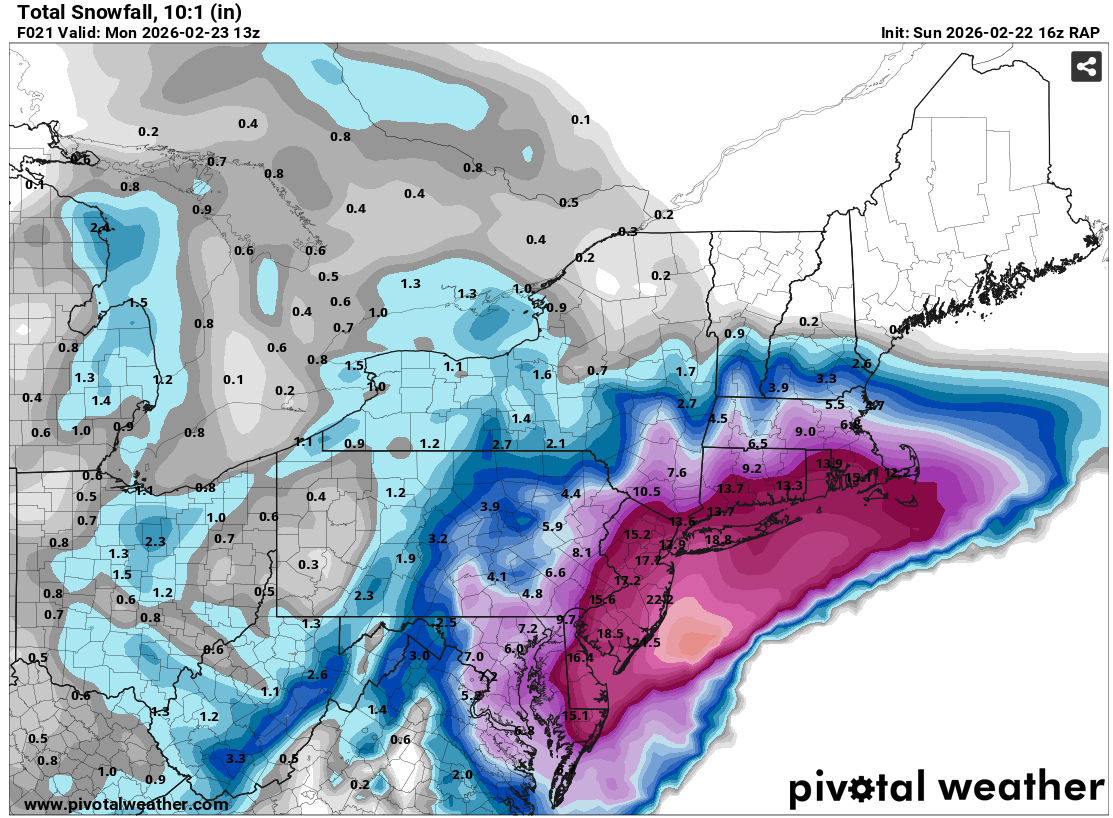
18z NBM (v.5.0): Note: V.4.3, which will be replaced this spring, shows 25” for Central Park. The newer version with the more realistic snow-liquid ratios has been very steady.
-
We'll know tomorrow.
-
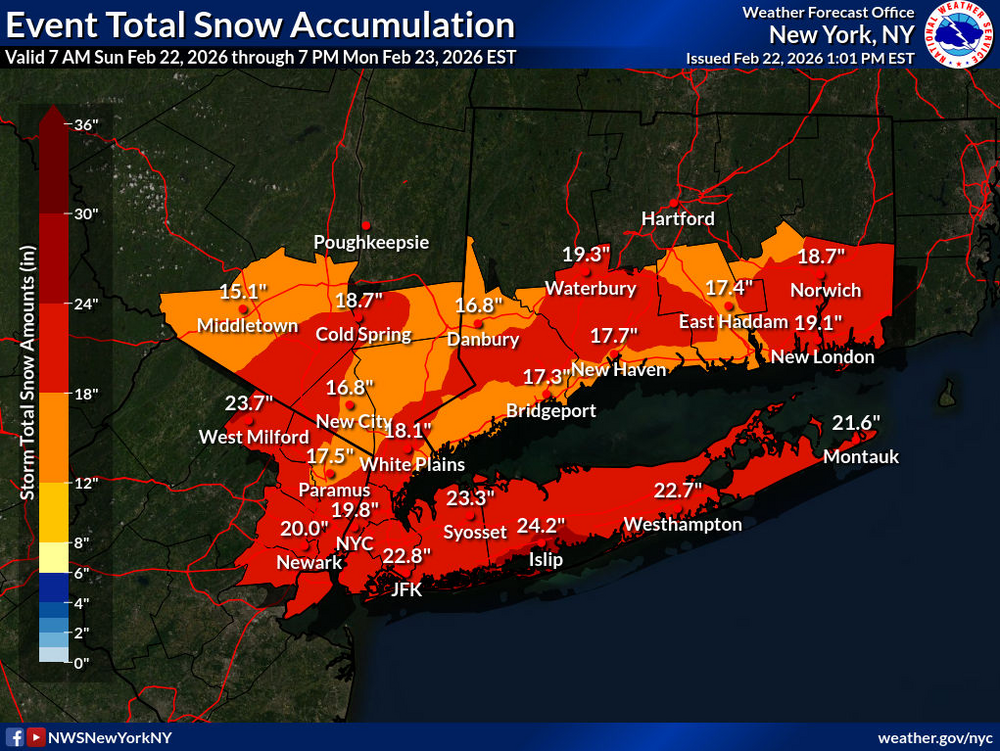
Updated forecast from Upton:
-
We'll know tomorrow how this fared. But something to keep in mind: A new study led by scientists from the University of Chicago, in collaboration with New York University and the University of California Santa Cruz, is testing the limits of AI-powered weather prediction. In research published May 21 in Proceedings of the National Academy of Sciences, they found that neural networks cannot forecast weather events beyond the scope of existing training data—which might leave out events like 200-year floods, unprecedented heat waves or massive hurricanes. https://news.uchicago.edu/story/ai-good-weather-forecasting-can-it-predict-freak-weather-events
-
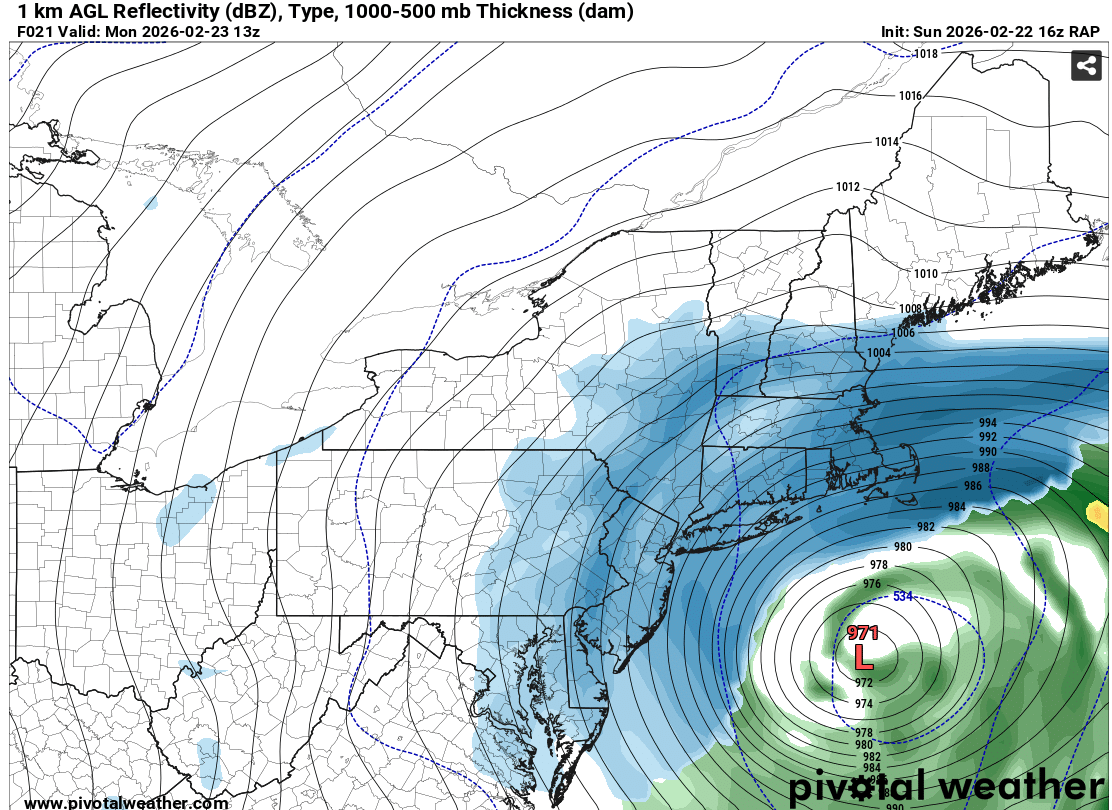
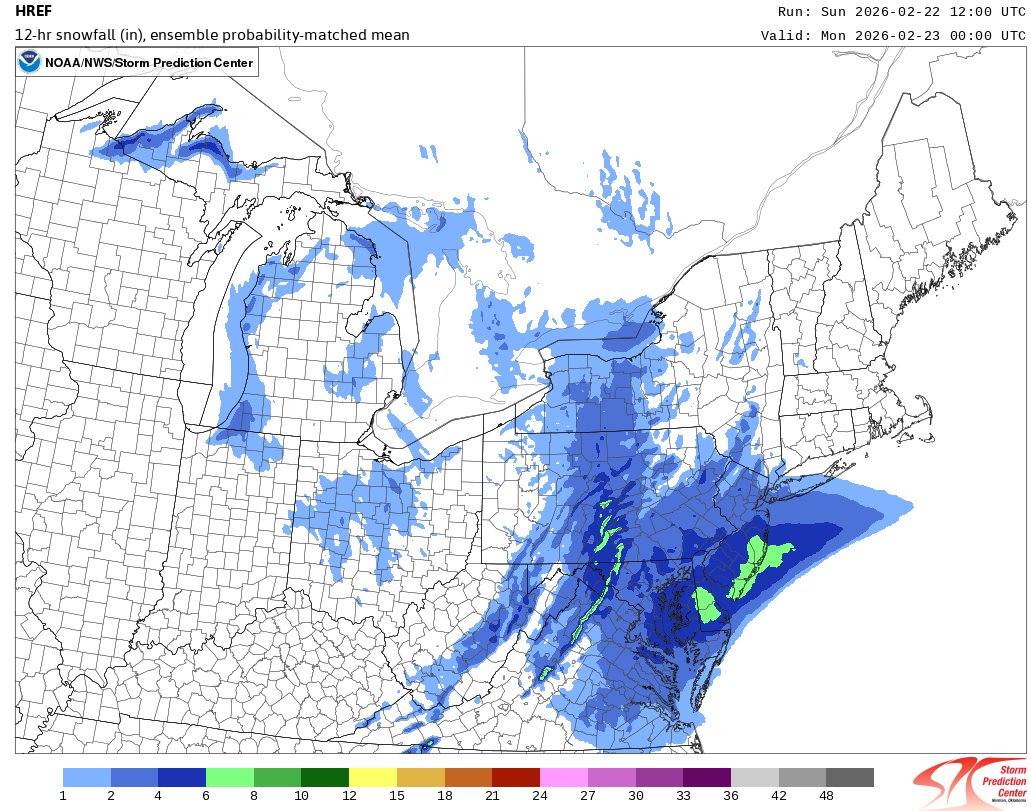
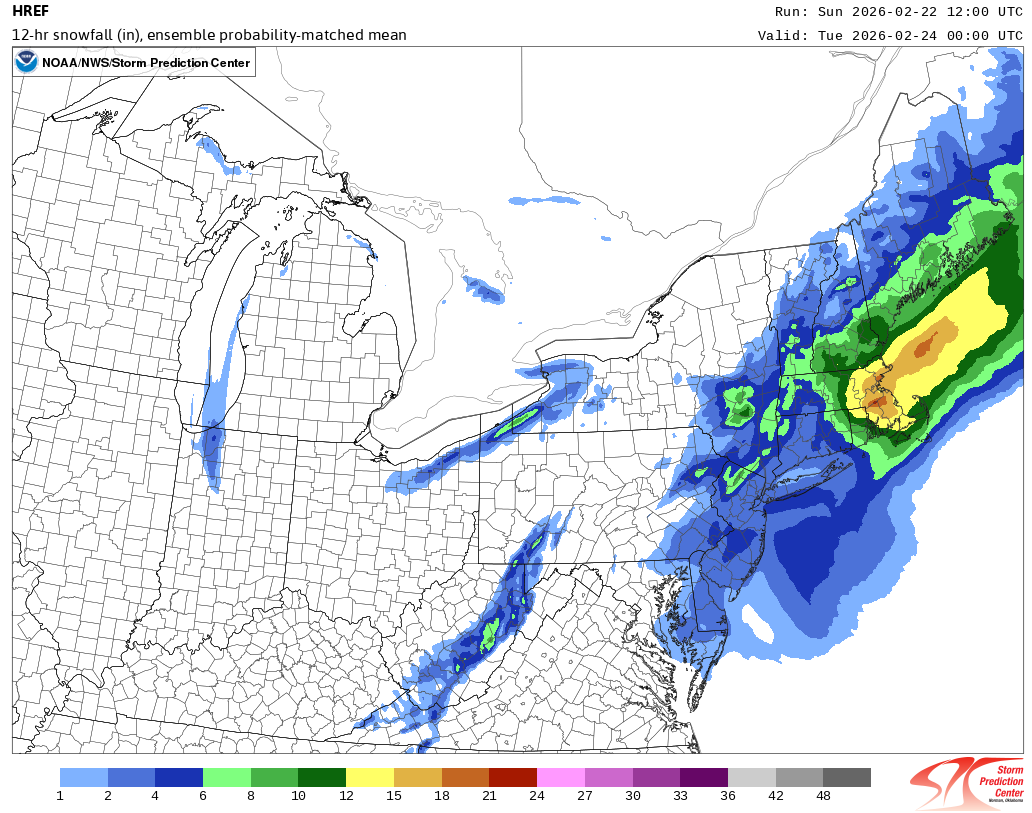
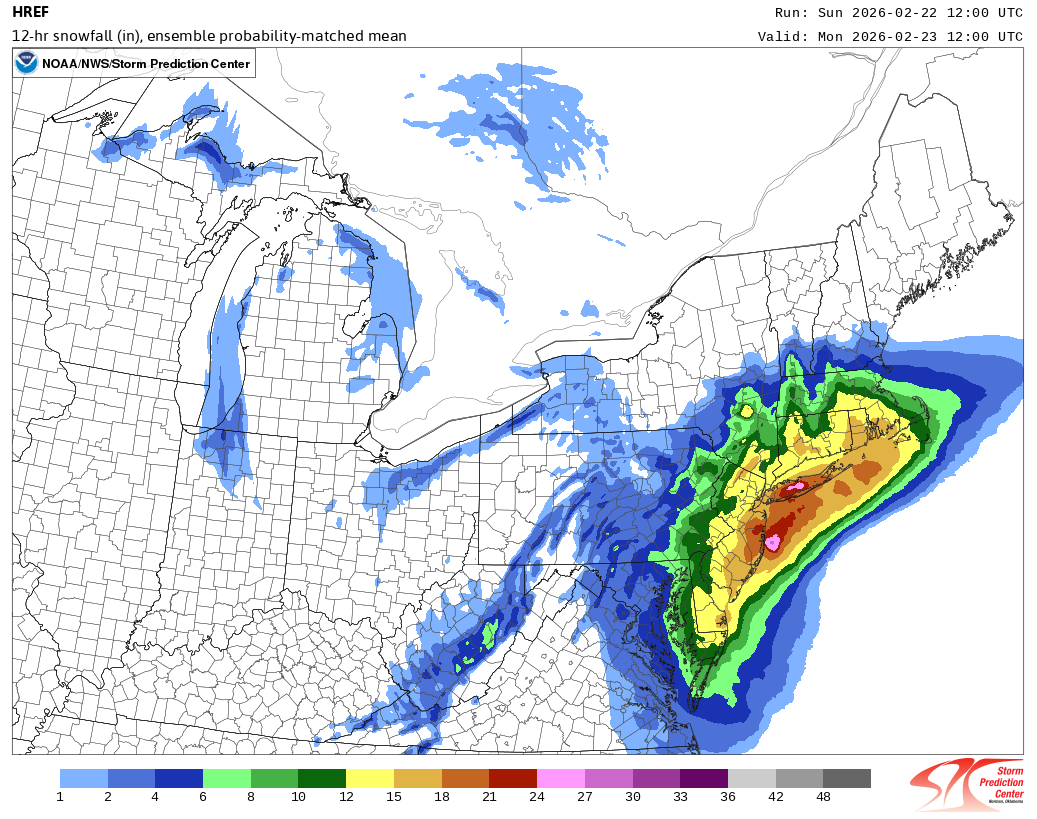
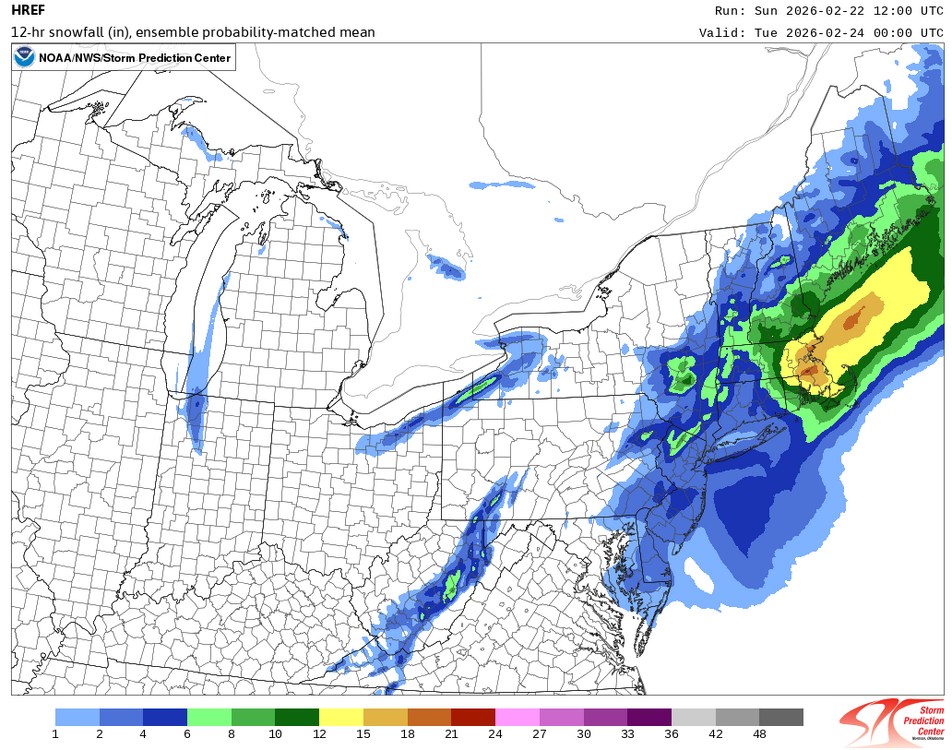
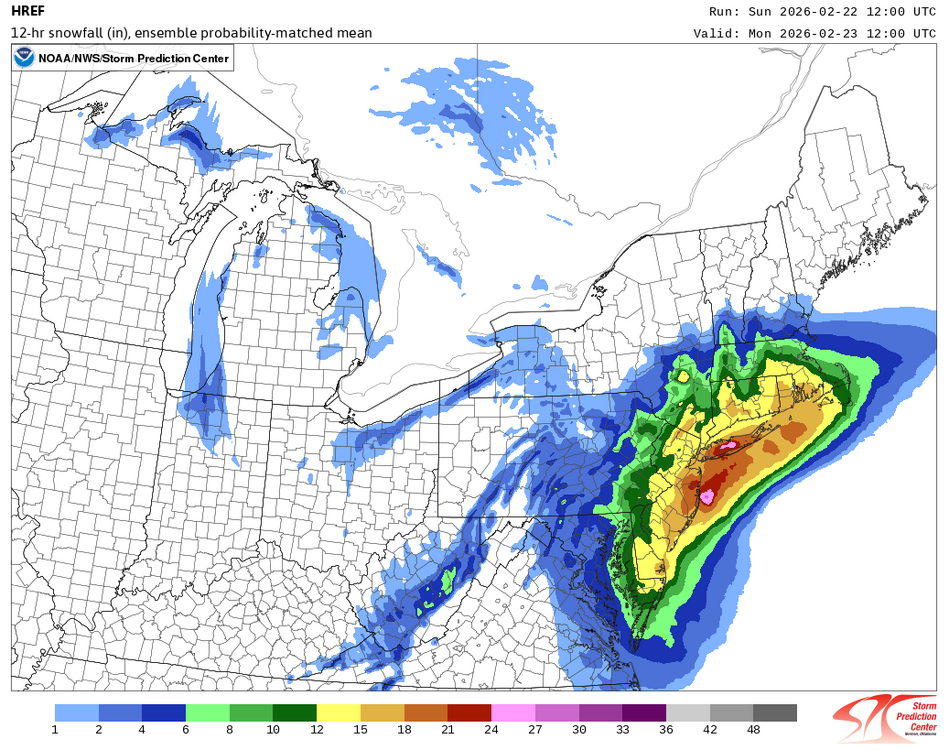
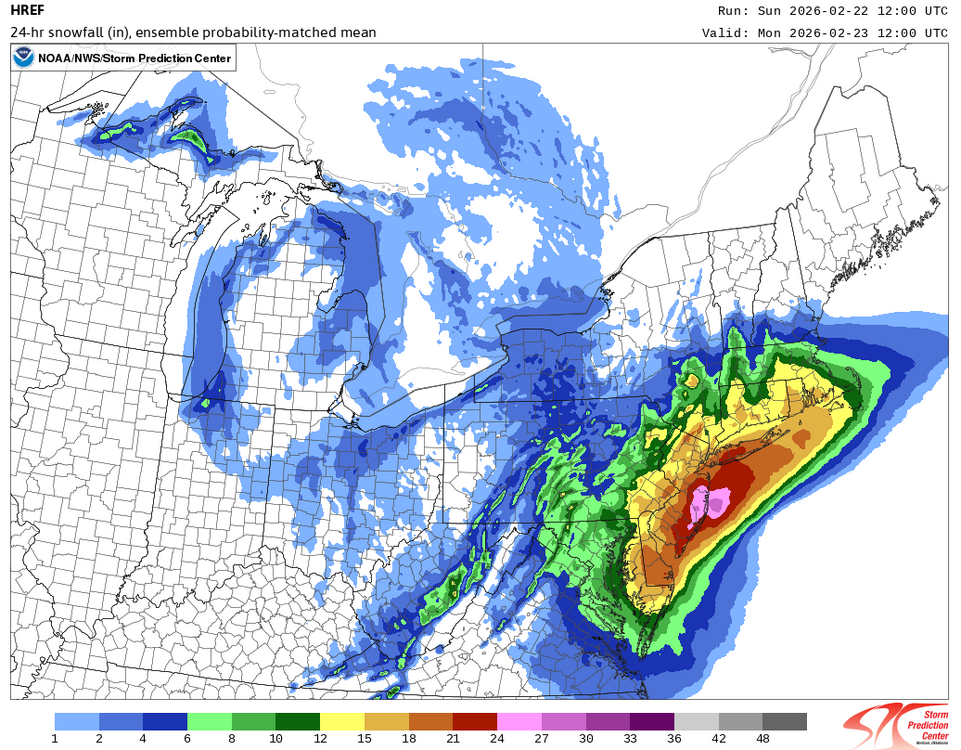
While we wait for the Board psychiatrist to arrive to address the gloom, the 12z UKMET held serve. Moreover, the 16z RAP at 21 hours showed: The 12 hour intervals for the 12z HREF were: 2/22 12z-2/23 0z: 2/23 0z-12z: 2/23 12z-2/24 0z:


-
I'm still thinking 18"-24" with some locally higher amounts.
-
Once it drops another degree, JFK should flip. The above freezing layer from the surface extends to around 975 mb. That's a bit too thick.
-
This will have to be watched. I suspect things will level off and we'll wind up with around 1.50" QPF in much of the area. I still think 14"-20" is plausible for BDR at this time, unless the shift continues through the 18z cycle. Let's see where things are at 18z. If the storm develops explosively, one will see higher than 12:1 ratios even with the wind, especially where the banding sets up. The mesoscale models will provide insight into banding, frontogenic forcing, etc.
-
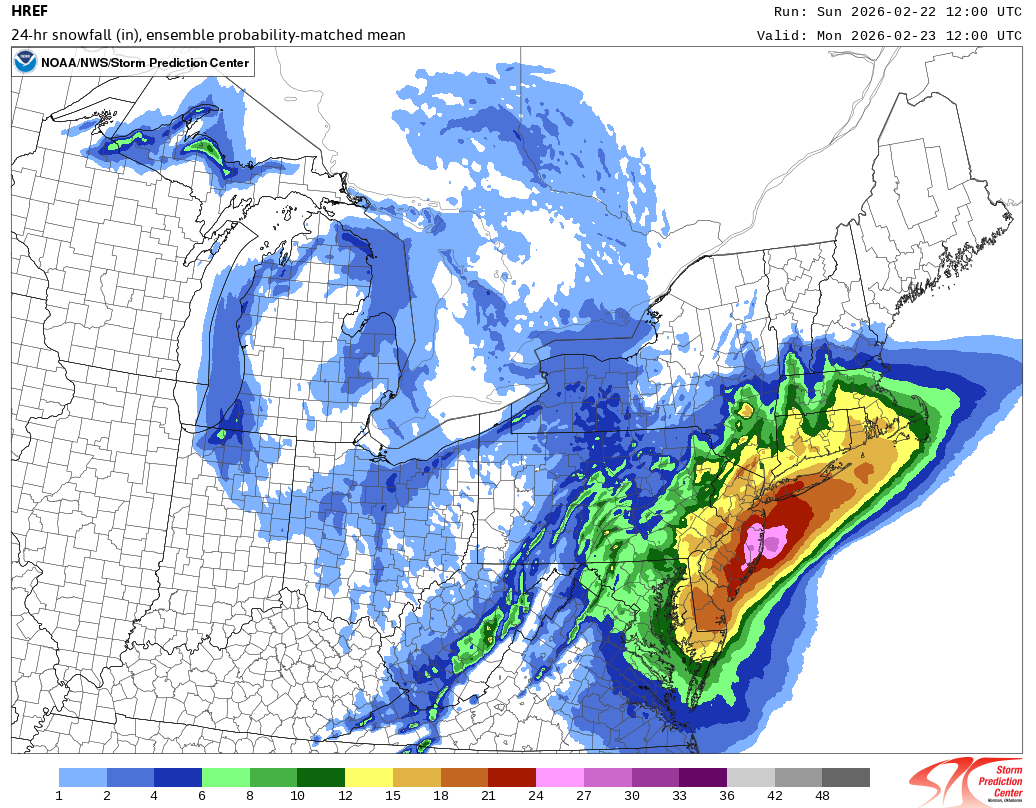
12z HREF through tomorrow 12z: Even if on deducts one category, NYC has 12"-15" of snow by 12z tomorrow on the HREF.
-
IMO, the major blizzard remains on track. My thinking of 16"-22" in the City and nearby areas and 18"-24" in parts of Long Island and central NJ with locally higher amounts is unchanged. That the NAM has come to Earth doesn't change things. Were the storm not expect to develop as explosively as expected and were it not to approach or surpass 970 mb, I'd be thinking 12"-18" based on a preponderance of the guidance. However, explosively deepening and super intense storms have very efficient and powerful dynamics that maximize snowfall. Thus, it makes sense to add about a third to the figures one would normally expect. One saw such a case during February 11-12, 2006. The blizzard's dynamics outran the models and the forecasts. What had been expected to be about a foot of snow in NYC wound up being 26.9". Forecast amounts were increased several times when the blizzard was underway. So, at least for now, I'm quite comfortable with my amounts listed above.
-
For reference:
-
The ground is coated from the light snow in Larchmont.
-
Seems reasonable.
-
-
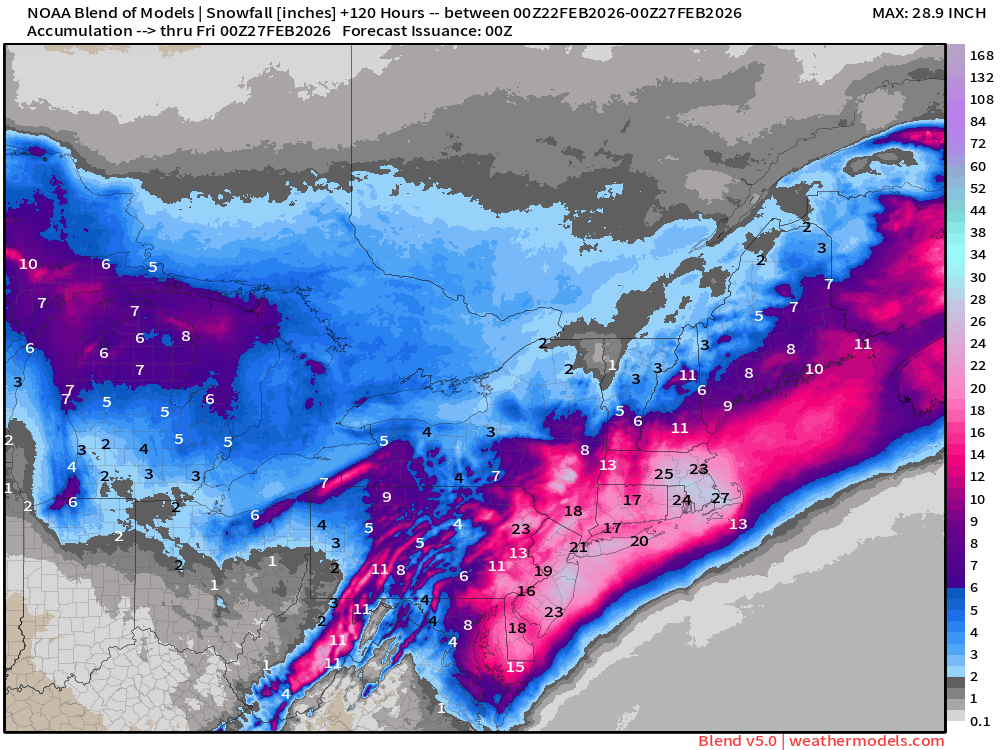
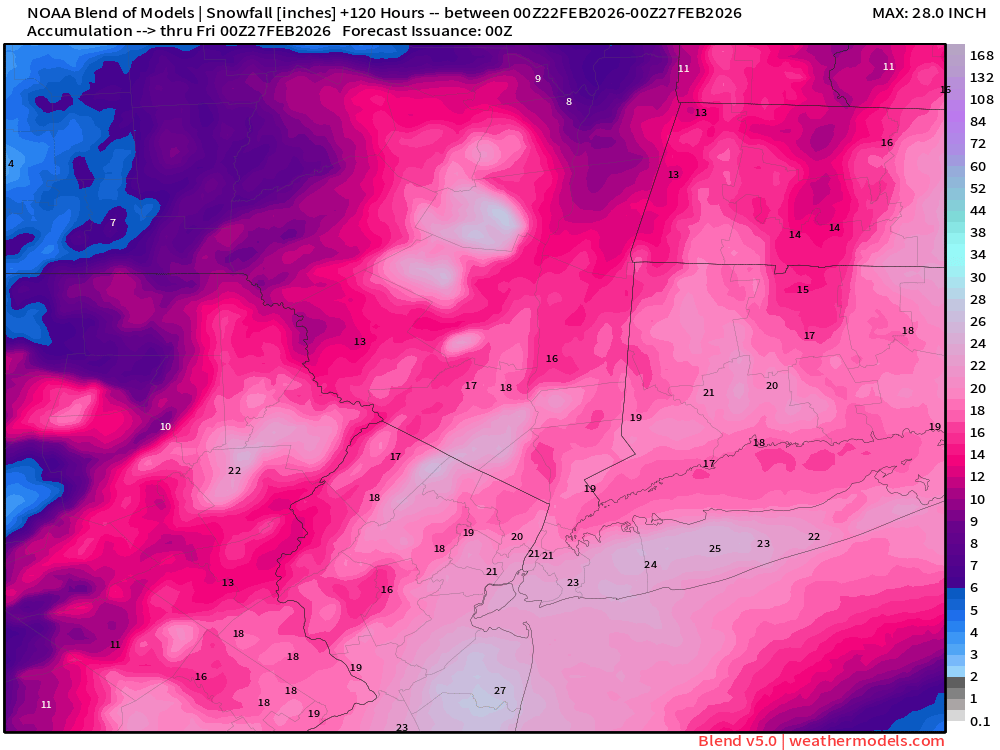
Here’s the 0z NBM (v.5.0):
-
Yes. The latest was the Blizzard of 1983 (2/11-12/1983).
-
September 1963.
-
For reference, Islip's all-time record is 27.8" from February 8-9, 2013.