donsutherland1
-
Posts
21,073 -
Joined
Content Type
Profiles
Blogs
Forums
American Weather
Media Demo
Store
Gallery
Everything posted by donsutherland1
-
AO+ greatly limits the risk of NYC January snowstorms. There are a few exceptions. AO values of -3 or below are typically too suppressive.
-
Snowfall NYC subforum Jan 6 and OBS if needed
donsutherland1 replied to wdrag's topic in New York City Metro
I enjoy every day with measurable snowfall. Such days are, in fact, not very common (30-year average for NYC has fluctuated from 10.7 to 11.7 since 2000). Such days are precious.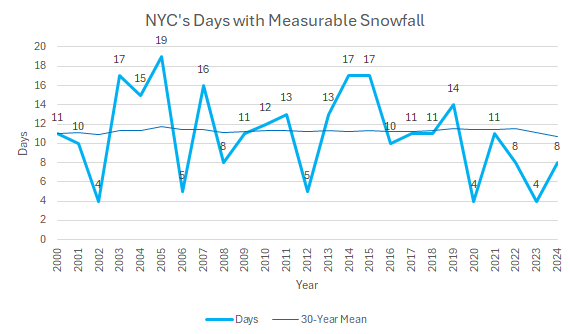
-
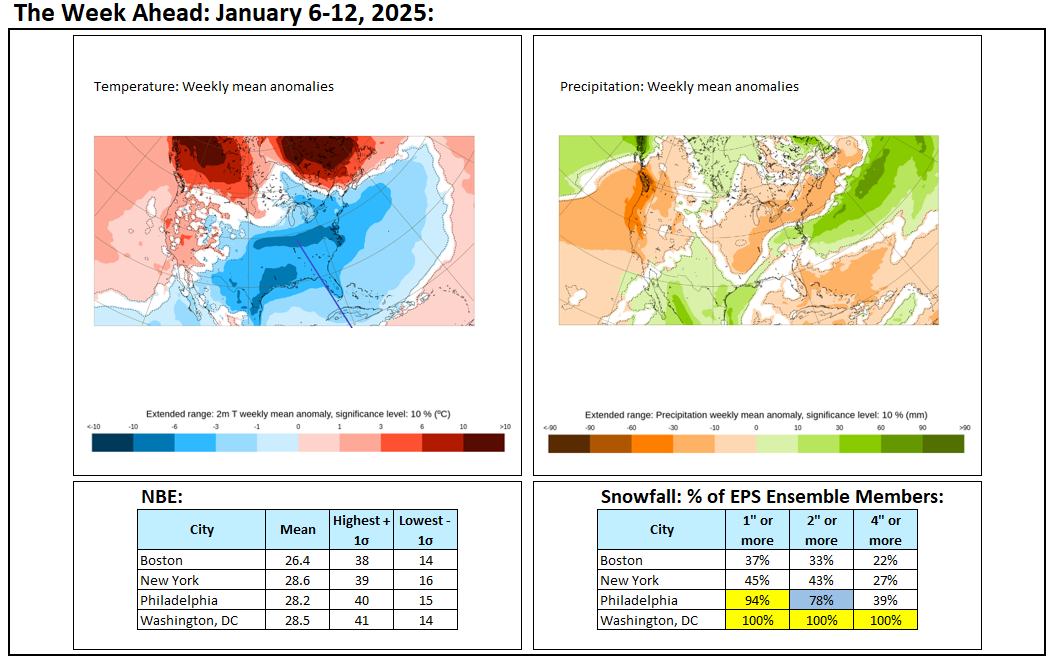
Week ahead idea:

-
Some mixing would be plausible for sure.
-
I disagree. A reasonable worst-case would entail a rain/freezing rain/sleet and snow event. Since 1950, New York City saw five measurable precipitation cases in January under the following criteria (which would apply for January 11th based on the latest guidance and today's AO value): - Negative AO (-2.000 to -0.001) - PNA > 0 - NAO -0.25 or below - Minimum AO value 7 or fewer days prior to the event: -3.000 or below Four of the five (80%) measurable precipitation events also had measurable snow. Two (40%) were all snow events. Four (80%) had temperatures that spent time in the 20s or teens. Only a single event with 0.05" precipitation saw no snow.
-
Snowfall NYC subforum Jan 6 and OBS if needed
donsutherland1 replied to wdrag's topic in New York City Metro
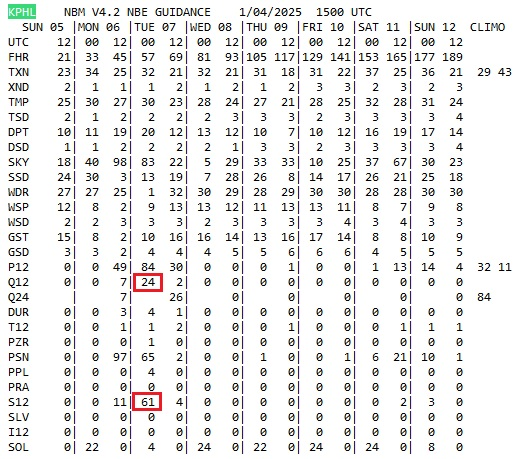
The head of the NBM development team has replied. Several points: 1. The team is aware of the issue 2. NBM inputs for QPF and snow differ. It is implied that this may be resulting in the observed issue 3. The team will seek to align the QPF and snow inputs in v5.0, which will be released sometime next year The exact reply is below: "We are aware of this issue and are attempting to align the NBM qpf inputs with those used for snow for NBM v5.0 which is scheduled to come out sometime next year. It is likely we will cut down on some of the qpf inputs in order to make this happen." For those looking for a preview of v5.0, the last paragraph of this press release offers a short description: https://vlab.noaa.gov/web/mdl/-/nbm-upgraded-to-version-4-2?redirect=%2Fweb%2Fmdl%2Fevents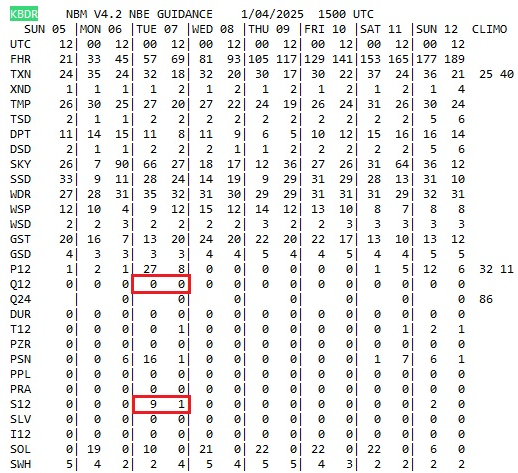
-
An extended period of generally below normal temperatures has now commenced in the New York City area. Although the general below normal temperature regime will likely extend through at least mid-month, it appears increasingly likely that there won't be the kind of severe cold that sees minimum temperatures fall below 10° in the Philadelphia to New York City areas during that period. The cold could still peak with readings dropping into the teens and several subfreezing highs. A storm will bring parts of the Middle Atlantic region a moderate to locally significant snowfall tomorrow night into Monday. Parts of the region will see 4"-8" of snow with locally higher amounts. Initial snowfall estimates: Atlantic City: 3"-6" Baltimore: 4"-8" Islip: 0.5" or less (possibly no measurable snow) New York City: 0.5" or less (possibly no measurable snow) Newark: 1" or less (possibly no measurable snow) Philadelphia: 3"-5" Richmond: 1"-3" Washington, DC: 4"-8" Small changes in the models may still occur in coming cycles. The 12z UKMET that limits the northern extent of the heavy snowfall to central Virginia and 18z NAM that centers it just south of the Mason-Dixon Line are outliers. Those models probably offer worst-case scenarios. Big model changes remain unlikely as the AO block that will influence the storm's track and confluence to its north is well-modeled. The focus of the heaviest snows still appears to favor the Washington-Baltimore-Annapolis areas. The second and third weeks of January will likely feature widespread cold anomalies in much of the eastern half of the CONUS and Canada south of the Hudson and James Bays. The potential exists for widespread cold anomalies of 6°-10° below normal during that week in parts of that region, particularly the Southeast. Those anomalies will likely result more from the prolonged nature of the cold than its severity. However, notable exceptions could be areas with fresh snow cover that experience strong radiational cooling. The ENSO Region 1+2 anomaly was -0.2°C and the Region 3.4 anomaly was -1.1°C for the week centered around December 25. For the past six weeks, the ENSO Region 1+2 anomaly has averaged +0.10°C and the ENSO Region 3.4 anomaly has averaged -0.53°C. Neutral ENSO conditions may still evolve into a La Niña event during the winter. Uncertainty as to whether a La Niña will actually develop persists. On the December 19 outlook, 56% of dynamical models but 0% of the statistical models forecast the development of a La Niña. The SOI was -0.23 today. The preliminary Arctic Oscillation (AO) was -3.075 today.
-
Snowfall NYC subforum Jan 6 and OBS if needed
donsutherland1 replied to wdrag's topic in New York City Metro
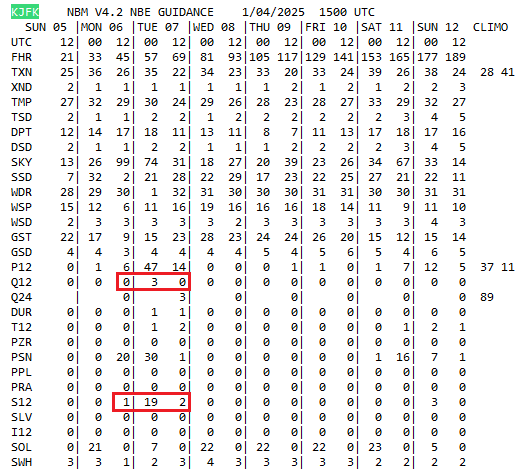
As previously noted in this thread, I had pointed out that there were cases where NBE was showing snowfall amounts with 0 qpf and unrealistic snow-liquid ratios e.g., 95:1 for NYC, issues that did not occur with the prior version (4.1). I also saw that there were areas where qpf was present, but ratios were still unrealistic. That raises questions about not just the periphery of the storm where a degree of smoothing might have been involved, but all the storm totals. On account of concluding that all storm totals could be compromised, I decided to contact the development team. I suspect that the issue is common to your discussion, Drag's discussion, and my discussion. -
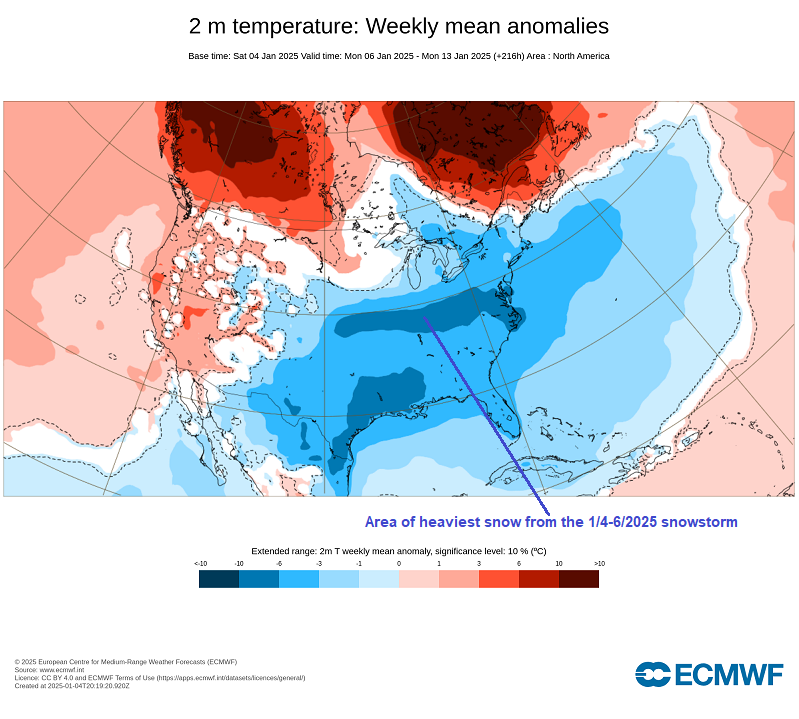
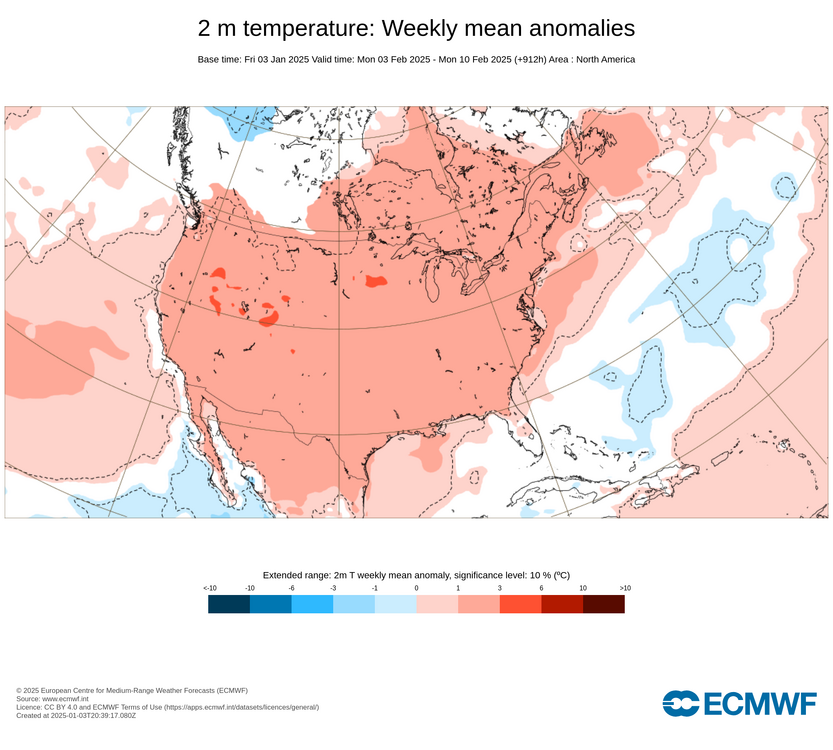
The impact of the upcoming snowstorm on weekly temperature anomalies (1/4/2025 ECMWF weeklies):
-
I believe the -16 occurred in 1780, not 1783.
-
Early January 1835 saw an extremely cold air mass invade the eastern U.S. The air mass was largely unmodified Arctic air. On January 4th, the temperature bottomed out at -23° in New Haven. The January 6, 1835 issue of the New York Mercantile Advertiser wrote: We have never known ice [to] accumulate in our harbor more rapidly than it has done since Saturday evening [evening of January 3]. The North River [Hudson River] was covered yesterday nearly down to the Battery, and there being but little wind, the ice remained stationary, and requires but a short time more of severe weather to give us a solid bridge to Jersey City and Hoboken. In the East riverr, the ice was moved by the tide, and left occasional openings for the ferry boats. At one o’clock the river was completely blocked with ice for a short time, above the Fulton St. ferry, so that several persons crossed upon it to and from Brooklyn. Large fields of ice in the upper and lower bays drifting with the tide, occasionally block up the Narrows, and render it difficult for vessels to get into port without the aid of steamboats. The January 9, 1835 edition of Charleston, SC's The Southern Patriot described conditions in Savannah as follows: The cold which visited us on Sunday has not left us, and icicles are still pendant from trees and roofs, aided by the unusual appearance of snow on the ground. On Monday morning one might have thought that he was in Canada, not Georgia, as everything wore one uniform white Livery. At the time we are writing, snow is still lying in those places secluded from the sun.
-
Snowfall NYC subforum Jan 6 and OBS if needed
donsutherland1 replied to wdrag's topic in New York City Metro
FYI, regarding the National Blend of Models issue: I emailed the development team this morning with screen shots. I used the text from the guidance rather than vendor maps to illustrate that the issue exists with the product itself. The three screenshots I included are below. I will post any updates I receive from the development team.
-
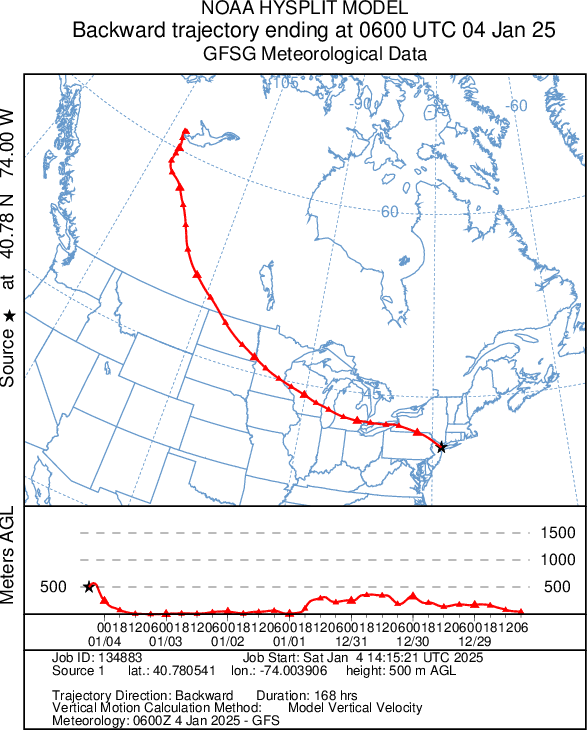
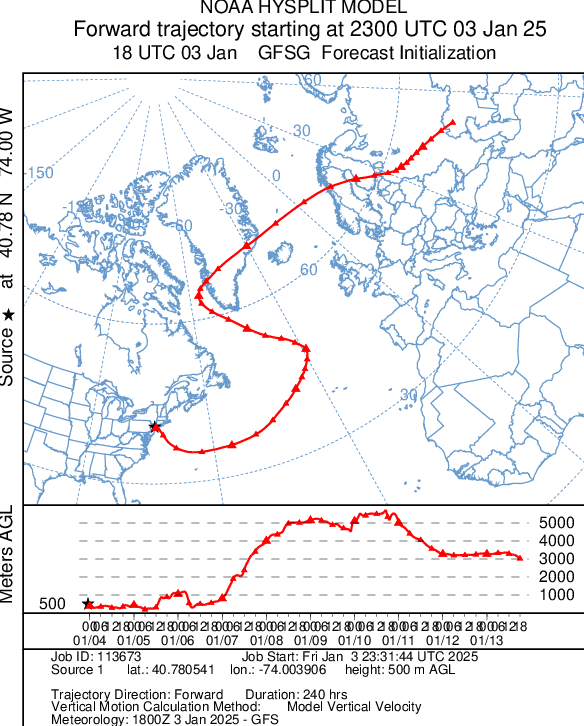
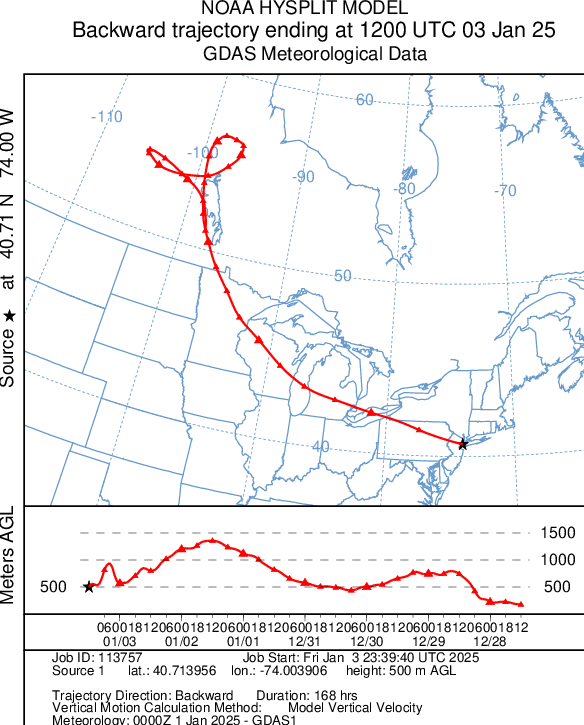
The map shows where the current air mass originated. It originated in Canada's Northwest Territories. The lack of cross-polar flow has limited the magnitude of the cold. It's now colder than normal but really not exceptional. Cross-polar flow often leads to severe Arctic outbreaks in the CONUS.
-
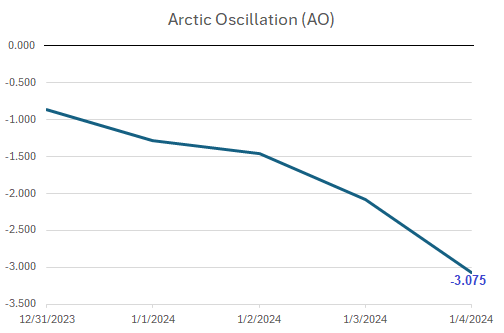
The 1/4 AO value came in at -3.075. The AO continues to fall quite rapidly. The current value is the lowest of the winter so far. A further decline is forecast on the ensembles.
-
Yes. That adds confidence in the idea of the pattern change.
-
For reference: Central Canadian origin of the current air mass.
-
I can't comment on why others might have felt that a Siberian air mass would be moving into eastern North America. However, the model data shows that the current air mass does not have Siberian origins. As to the air masses traveling in straight directions, it has happened with rapid discharges of Arctic air. But there are many synoptic features, so one often sees the kind of paths shown on the Hysplit data I posted.
-
Yes, I agree. I think Richmond will end its streak. It will be uncomfortably close due to warmer air flooding the mid-levels. KC looks to be in line for 10"+ of snow. How much sleet and/or freezing rain occurs remains somewhat of a question.
-
Some updates on last week’s thoughts: 1. On December 28th, Chicago reached 51° and Detroit topped out at 58° (3rd highest figure on record for the date). Both cities saw colder than normal conditions begin January 3rd, slightly later than suggested. 2. On December 30, high temperatures included: Baltimore: 65°, New York City: 60°, Philadelphia: 66°, and Washington, DC: 68°; On December 30, high temperatures included: Baltimore: 62° and Washington, DC: 63°; On December 31, high temperatures included: Philadelphia: 60° and Washington, DC: 63°. Temperatures were modeled to fall to below normal levels starting today. 3. Snowfall amounts for December 28-January 3 included: Baltimore: Trace ; Boston: None; Chicago: 0.3”; Detroit: 0.5”; Indianapolis: Trace; New York City: None; Philadelphia: Trace; and, Washington, DC: Trace 4. Phoenix concluded its warmest December (mean temperature: 62.3°) and its warmest year (78.6°) on record. Phoenix also reached and then surpassed its old record of 353 consecutive days during which the temperature stayed at 40° or above. Phoenix also experienced its first record high of 2025 with a high temperature of 81° yesterday (old record: 79°, 1956, 1981, and 1989) 5. Blythe’s record streak without measurable precipitation reached 277 days as of yesterday. Three Thoughts Going Forward: 1. The Great Lakes, Mid-Atlantic, and Southern New England areas will all see temperatures average below to much below normal this week. As the air mass's origin is from central Canada, the kind of severe cold seen with cross-polar air masses will not be present. 2. A powerful and strengthening AO block will shape the path of a storm coming out of the Plains States and provide significant confluence over the northeastern U.S. As a result, a storm will bring significant snowfall from St. Louis to Washington, DC during the January 5-7 timeframe. Amounts will likely include: Baltimore: 4”-8”; Indianapolis: 6”-12”; St. Louis: 5”-10”; and, Washington, DC: 4”-8” 3. Following the snowstorm, Indianapolis could see the mercury fall into the single digits for on one or two days this week. Lacking meaningful snow cover, Chicago and Detroit will probably see their coldest temperatures fail to break 10°. Longer-Range: A slow moderation in temperatures is likely during the third week of January, but the week will likely be colder than normal across much of the East and Great Lakes Regions. The long-range guidance suggests that an EPO+/AO+/PNA- pattern could develop in late January. The change in teleconnections could coincide with the emergence of an AAM- regime. That would imply that the month of January or the start of February could see warmer than normal readings. That pattern change now shows up on the ECMWF weeklies, even as the CFSv2 maintains the cold.
-
Morning Thoughts... Not much has changed in the overall picture since yesterday. The dominant feature remains a strong and strengthening AO block. The latest value will likely come out near -3.000. A further decline will occur prior to the upcoming snowstorm. As a result, the storm track and confluence continue to favor a significant snowfall in the Washington, DC-Baltimore area with snowfall amounts falling off rapidly once one gets north of Philadelphia. Some areas favored for the heaviest snowfall could see local amounts of 10" or more. The confluence looks a little more impressive and secondary development looks to be a little slower than yesterday. The cutoff between little and no snowfall on the northern periphery of the storm will likely be somewhat sharper. Early thinking: Baltimore: 4"-8" New York City: Possible coating (but the risk of no measurable snow has increased) Philadelphia: 2"-4" Washington, DC: 4"-8"
-
The forward trajectory for what lies ahead shows this quite well. And here's the source region of today's air mass: The bottom line: there has been no true cross-polar flow and none appears likely through the near-term. Unfortunately, I suspect that the terms "Arctic air" and "cross-polar flow" are increasingly used generically to refer to colder air rather than in the true sense of the terms.
-
An extended period of generally below normal temperatures is now poised to commence in the New York City area. Although the general below normal temperature regime will likely extend through at least mid-month, it appears increasingly likely that there won't be severe cold that sees minimum temperatures fall below 10° in the Philadelphia to New York City areas during that period. The cold could still peak with readings dropping into the teens with several subfreezing highs. A storm will bring parts of the Middle Atlantic region a moderate to locally significant snowfall Sunday night into Monday. Washington, DC and Baltimore appear to be in line for 4"-8" of snow. Philadelphia has the potential to pick up 3"-6", but there is greater uncertainty there. Once north of Philadelphia, accumulations could fall off quite rapidly. A light amount remains likely for the New York City area. Richmond will likely see an end to its ongoing record streak of 1,083 days without daily 1" or greater daily snowfall. However, that outcome isn't completely assured. In addition to snow, sleet and freezing rain are likely in Richmond. Small changes in the models may still occur in coming cycles. Big changes seem unlikely as the AO block that will influence the storm's track and confluence to its north is well-modeled. The second and third weeks of January will likely feature widespread cold anomalies in much of the eastern half of the CONUS and Canada south of the Hudson and James Bays. The potential exists for widespread cold anomalies of 6°-10° below normal during that week in parts of that region, particularly the Southeast. Those anomalies will likely result more from the prolonged nature of the cold than its severity. However, notable exceptions could be areas with fresh snow cover that experience strong radiational cooling. The ENSO Region 1+2 anomaly was -0.2°C and the Region 3.4 anomaly was -1.1°C for the week centered around December 25. For the past six weeks, the ENSO Region 1+2 anomaly has averaged +0.10°C and the ENSO Region 3.4 anomaly has averaged -0.53°C. Neutral ENSO conditions may still evolve into a La Niña event during the winter. Uncertainty as to whether a La Niña will actually develop persists. On the December 19 outlook, 56% of dynamical models but 0% of the statistical models forecast the development of a La Niña. The SOI was -7.63 today. The preliminary Arctic Oscillation (AO) was -2.085 today.
-
In this thread, I already noted that my expectations for less severe cold stated in this thread will likely prove too aggressive given the latest guidance. That hasn't occurred yet, but I don't see, for example, single-digit cold occurring in NYC, PHL, or BOS Unfortunately, the Internet Archive doesn't have Easternuswx. I believe I noted how unusual it was that Sandy would turn westward and how abnormal the AO block was at the time. The biggest bust that I can recall concerned being late with the idea that what would become the Boxing Day blizzard wasn't going to merely scrape the coast. And, as I post daily my thoughts looking ahead, from December 24 regarding the first half of January: The cold will begin to recede toward the end of the week. December will likely close with above normal temperatures and periods of rain. The opening days of January will likely also begin with above normal temperatures, but it will start to turn colder. Snowfall prospects will remain limited through the end of December. However, the pattern could become more favorable for moderate or perhaps larger snowfalls as the cold returns during the first week of January. There is growing potential for the second week of January to feature widespread cold anomalies in much of the eastern half of the CONUS and Canada south of the Hudson and James Bays. So far: January 1: 9.8° above normal January 2: 3.0° above normal January 3: 0.2° to 1.2° above normal (estimate) January 4: Likely start of the below normal regime as per the guidance The timing from 10 days out is in line with what is occurring. In addition, there is ongoing light snowfall in parts of the region today. Moreover, a significant snowstorm will affect parts of the East Sunday night and Monday. The potential of the pattern is going to be realized. But New York City and northward will see little if any snow from that storm. Details can't really be pinned down that far out, so even if the exact placement of the snow is outside the Greater NYC area, the general idea that the pattern would become more favorable seems poised to be a good one. Having said all this, there is a huge difference between busting on forecasts, and hyping events to gain engagement.
-
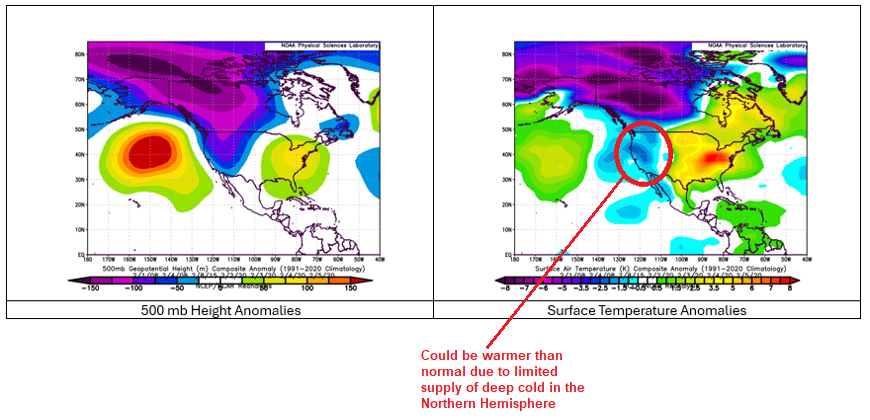
Even as much of the CONUS is in the early stages of what should be a multiweek period of generally sustained cold, albeit with only limited severe cold, if that, there are distant hints of a dramatic pattern shift for late January or the start of February. The 46-day ECMWF ensemble forecast now shows the development of a strong EPO+/AO+ pattern. At the same time, the AAM will likely have been negative for approximately two weeks. The January 2, 2025 ECMWF weekly forecast showed a break from the cold to start February. The January 3 cycle reaffirmed that change with an even more expansive warm signal. January 3 run of the ECMWF Weeklies: Strong EPO+/AO+ Patterns (February 1-10, 1980-2024): It should be noted that the maps are currently used to illustrate a scenario now showing up on the long-range guidance. Skill scores at the timeframe involved are low. What is important is that one has now seen multiple runs suggesting that a milder/warmer regime could set in for the start of February. That's the only point that should be taken from the post at this time. In short, if the early shift in the long-range guidance is correct, winter could relax to end January/start February.
-
Yes, that's correct. It's not surprising, either, as the pattern was not forecast to become a classic KU snowstorm-type pattern.