donsutherland1
-
Posts
21,077 -
Joined
Content Type
Profiles
Blogs
Forums
American Weather
Media Demo
Store
Gallery
Everything posted by donsutherland1
-
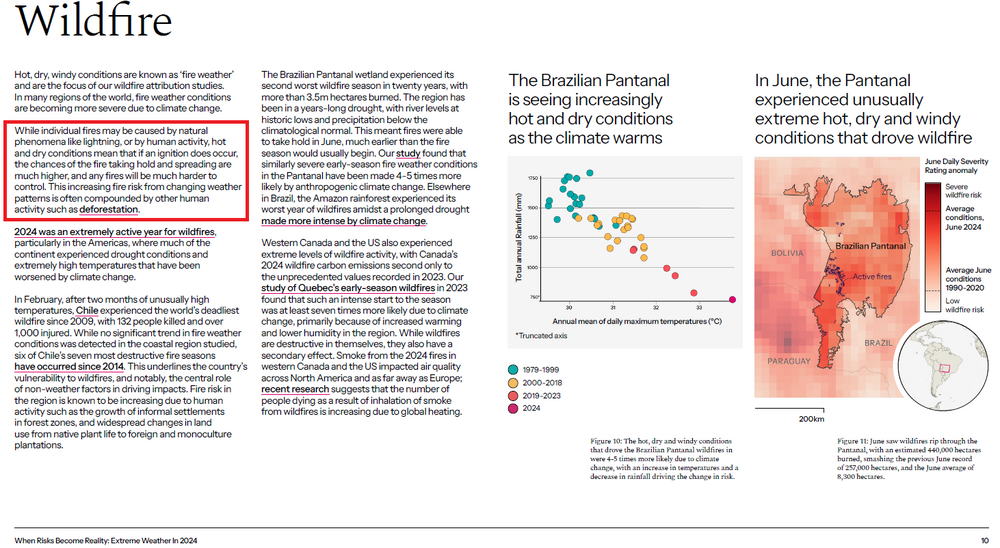
For World Weather Attribution's/Clmate Central's 2024 annual report: https://spiral.imperial.ac.uk/handle/10044/1/116443
-
Although it's possible, but not yet certain, that New York City is in the very early stages of a transition to lower snowfall from a warming climate, it should be noted that even in a warmer climate, both big snowstorms and snowy winters will remain possible for decades to come. Washington, DC's 7.2" snowfall on January 6 provides an example. Winters 2009-10, 2013-14, 2014-15, and 2015-16 provide examples of snowy winters there. The impacts of climate change will concern generally warmer winters, more "stuck patterns," and SST-forced changes from the increasing frequency of marine heatwaves. Nevertheless, internal variability will remain significant, even within the context of a warmer climate than the present one.
-
The storm that brought 2.1" of snow to Atlanta, its biggest snowstorm since January 16-17, 2018, also brought some light snow to the Northeast. Accumulations included: Allentown: 0.6" Atlantic City: 0.5" Boston: 1.5" Bridgeport: 1.2" New York City: 0.5" Newark: 0.5" Philadelphia: 0.1" Tomorrow and Monday will be fair and pleasant. Temperatures will top out in the upper 30s and lower 40s in New York City and Philadelphia. A cold front will then cross the region Monday night or early Tuesday morning, possibly with some snow flurries. In its wake, temperatures will again be below normal through at least Friday. An extended period of generally below normal temperatures is underway in the New York City area. Although this cold regime will likely extend through at least the first three weeks of January, the kind of severe cold that produces minimum temperatures below 10° in the Philadelphia to New York City areas is unlikely during that period. The cold could still peak with readings dropping into the teens and several subfreezing highs. The third week of January will likely feature a continuation of widespread cold anomalies in much of the eastern half of the CONUS and Canada south of the Hudson and James Bays. Those anomalies will likely result more from the prolonged nature of the cold than its severity. However, notable exceptions could be areas with fresh snow cover that experience strong radiational cooling. Moderation is possible during the closing week of the month. The ENSO Region 1+2 anomaly was +0.1°C and the Region 3.4 anomaly was -0.7°C for the week centered around January 1. For the past six weeks, the ENSO Region 1+2 anomaly has averaged +0.02°C and the ENSO Region 3.4 anomaly has averaged -0.63°C. La Niña conditions are underway and will likely persist into the start of spring. The SOI was -21.15 today. The preliminary Arctic Oscillation (AO) was -1.571 today. Based on sensitivity analysis applied to the latest guidance, there is an implied 79% probability that New York City will have a colder than normal January (1991-2020 normal). January will likely finish with a mean temperature near 30.7° (3.0° below normal).
-
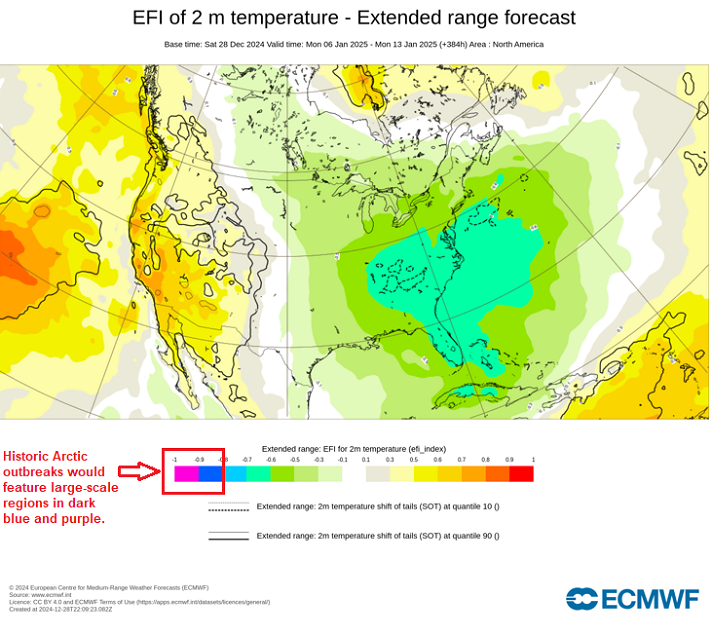
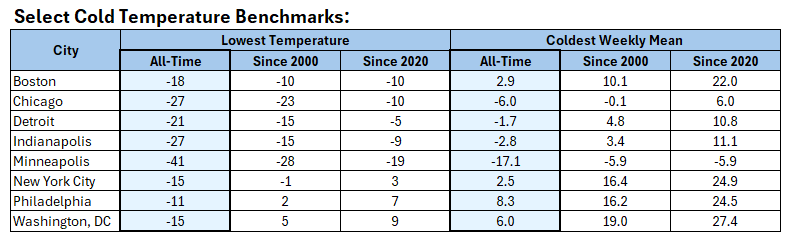
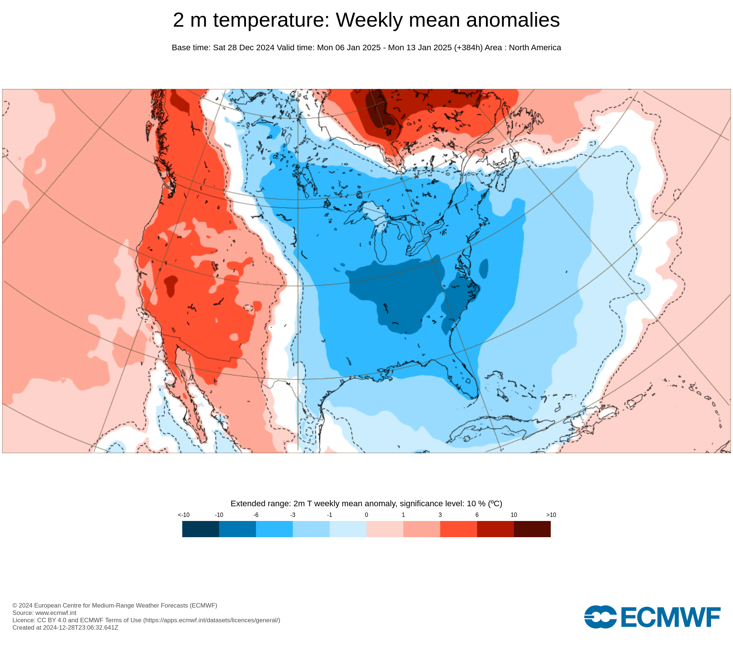
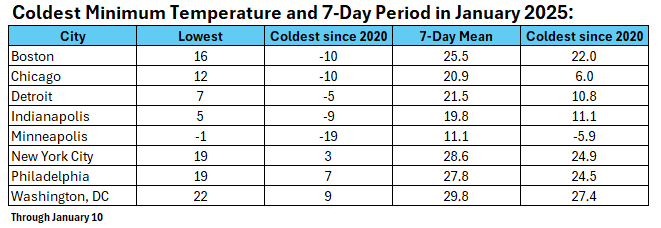
Update through January 10th: Two Key Points: 1. None of the highlighted cities has seen their coldest low temperature or coldest 7-day period since 2020. The current lowest temperature and 7-day mean temperature could be surpassed later this month, but most or all areas likely won't see their coldest low temperature or coldest 7-day period of the 2020s. 2. The lack of a deep cold pool and, at least through January 10th, the failure to establish cross-polar flow has contributed to a warmer outcome than the Social Media calls for historic-type cold. In general, one should be wary of Social Media "meteorology" sites that hype extremes. There's a lot more involved than simply cutting and pasting model runs e.g., the due diligence involved in assessing the likelihood that the models will verify (in this case, the lack of an expansive pool of deep cold in the Northern Hemisphere was a glaring "red flag"). At present, I am not aware of any of the sites that had hyped coming historic-type cold even beginning to acknowledge their unfolding error. Unfortunately, as the general public was exposed to the hype, one can reasonably expect that the gap between the hype and what actually verifies will further skew public perceptions. Indeed, things are currently breaking somewhat warmer than I had anticipated in the initial post. The final numbers will be verified.

-
One sees the importance of bigger storms in Washington, DC where a warmer climate has reduced seasonal snowfall. For the 1999-00 through 2024-25 (through 1/10) period, days on which 4" or more snow fell accounted for 44% of seasonal snowfall. During 1999-00 through 2008-09, that figure was 31%. Since 2009-10, it has averaged 51%.
-
Some updates on last week’s thoughts: 1. Temperatures have averaged much below normal across the Great Lakes, Mid-Atlantic, and southern New England areas this week. Temperature anomalies from January 5-10 were as follows: Atlanta: -7.9°; Baltimore: -8.1°; Boston: -5.7°; Chicago: -3.9°; Detroit: -5.0°; Indianapolis: -9.0°; New York: -5.9°; Norfolk: -8.2°; Philadelphia: -6.6°; Raleigh: -8.7°; Richmond: -10.6°; Washington, DC: -8.0°. 2. A storm brought heavy snow from the Plains States to the Mid-Atlantic region during January 5-7. Snowfall totals included: Baltimore: 6.6”; Indianapolis: 7.8”; St. Louis: 8.5”; Richmond: 3.5”; and Washington, DC: 7.2”. These amounts were in line with what had been expected. A separate storm brought snow to the Southeast on January 10th. Amounts included: Atlanta 2.1”; Augusta: 1.0”; and Birmingham: 2.0”. The last time all three cities saw 1” or more in the same storm was February 12-13, 2014. That second storm also brought 3.0” to Richmond and 0.5” to New York City. 3. Indianapolis saw the temperature bottom out at 5° on January 9. Although Chicago saw a low temperature of 14°, Detroit saw the mercury dip to 7° on January 9. The low in Detroit was somewhat colder than had been expected in my discussion. Three Thoughts Going Forward: 1. Dry weather will continue in southern California through the week. Little or no rainfall is likely in such cities as Blythe, Camarillo, Lancaster, Los Angeles, and Palm Springs. 2. A significant (6”+) snowstorm is unlikely in the big cities of the Middle Atlantic and southern New England regions (Richmond to Boston) during the upcoming week. 3. A strong cold shot will affect the Great Lakes Region Tuesday through Thursday. Indianapolis could see the mercury dip to 0° or slightly below. Detroit and Chicago could see one or more single-digit low temperatures. This is very cold but does not rival what could reasonably be described as historic cold. Longer-Range: A slow moderation in temperatures is likely to commence late in the third week of January or during the fourth week of January. Precipitation could increase to above normal levels over the closing 7-10 days of January. The long-range guidance suggests that an EPO+/AO+/PNA- pattern could develop in early February. Initially, there will be an EPO-/AO+/PNA- pattern, which will likely close January. The change in teleconnections will coincide with the emergence of an AAM- regime. That would imply that the end of January or the start of February could see warmer than normal readings develop.
-
Jan 11th-12th Super Bomb or Super Bummed?
donsutherland1 replied to Rjay's topic in New York City Metro
I see 1.2” at Mount Pocono for today.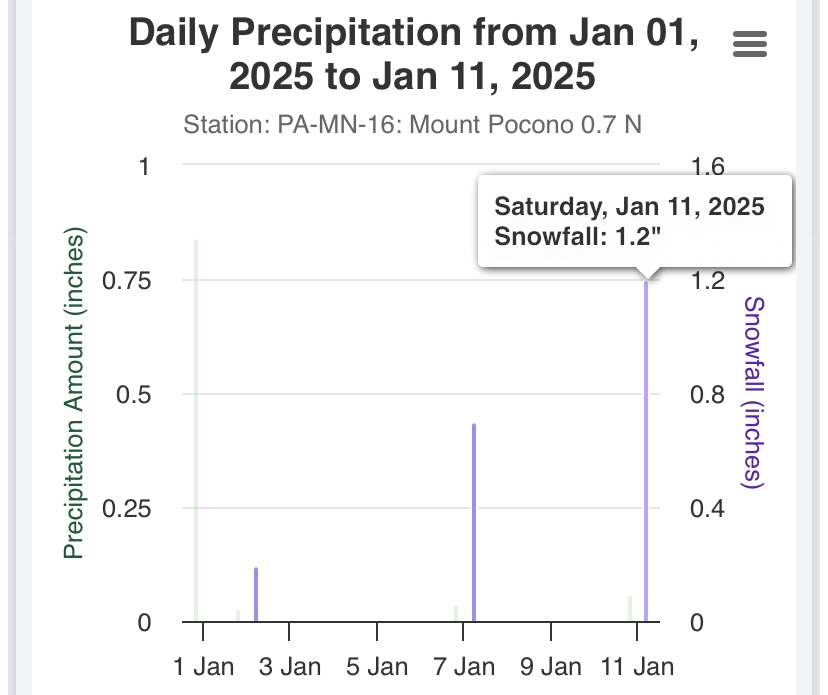
- 993 replies
-
- 1
-

-
- metsfan vs snowman
- bomb
- (and 2 more)
-
Jan 11th-12th Super Bomb or Super Bummed?
donsutherland1 replied to Rjay's topic in New York City Metro
The pennies, nickels, and dimes are adding up. Meanwhile, Petersburg, VA and James City, VA: 5.2".- 993 replies
-
- 8
-

-
- metsfan vs snowman
- bomb
- (and 2 more)
-
Jan 11th-12th Super Bomb or Super Bummed?
donsutherland1 replied to Rjay's topic in New York City Metro
Final season? Are you planning to move? -
Jan 11th-12th Super Bomb or Super Bummed?
donsutherland1 replied to Rjay's topic in New York City Metro
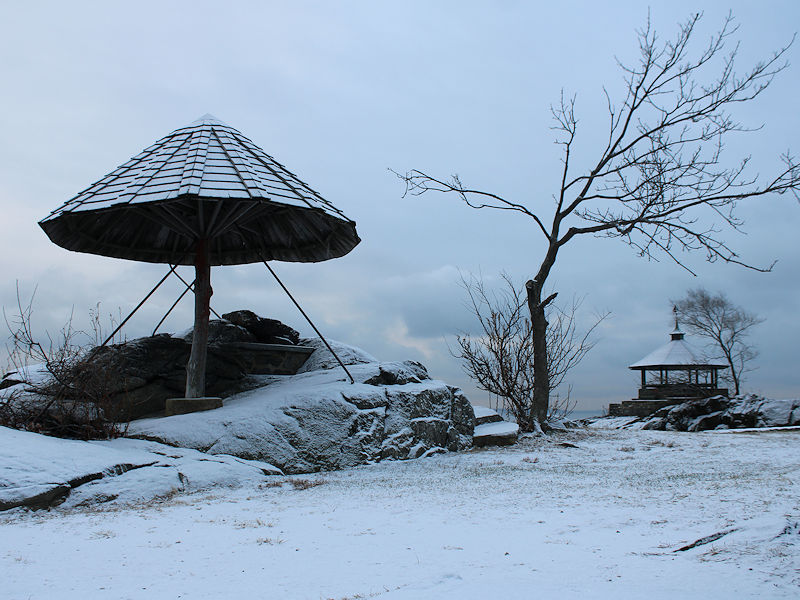
Two photos from this morning's light snowfall: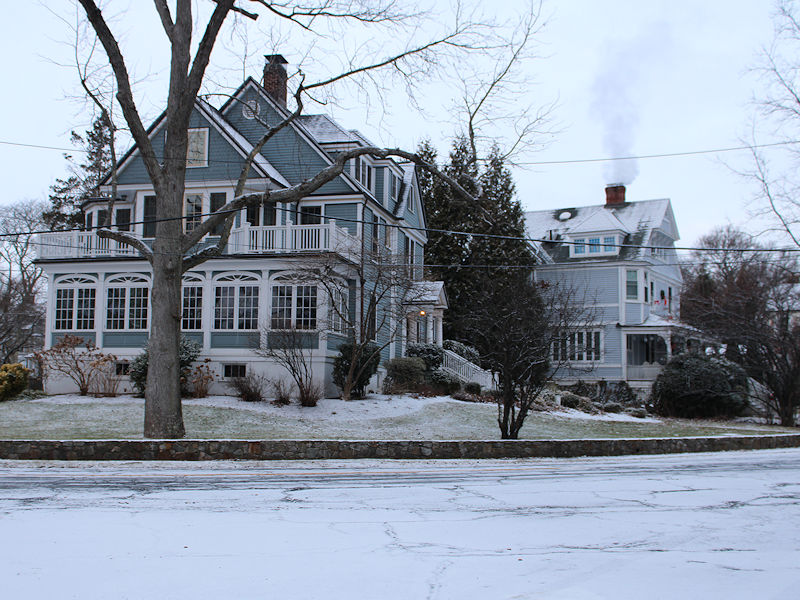
- 993 replies
-
- 6
-
-
- metsfan vs snowman
- bomb
- (and 2 more)
-
1/10-11 super awesome winter SE OBS thread
donsutherland1 replied to strongwxnc's topic in Southeastern States
Atlanta picked up 2.1" of snow yesterday. That broke the daily mark of 1.3" from 1953. It was also Atlanta's biggest snowstorm since January 16-17, 2018. In addition, Birmingham picked up 2.0" of snow. The last time both cities saw 2.0" or more snowfall in the same storm was December 8-9, 2017. Finally, Augusta also saw 1.0" of snow. The last time Atlanta, Augusta, and Birmingham all saw 1.0" or more snow in the same storm was February 12-13, 2014.- 510 replies
-
- 13
-
-
-
Atlanta’s snowfall was 2.1”.
-
1/10-11 super awesome winter SE OBS thread
donsutherland1 replied to strongwxnc's topic in Southeastern States
Last daily snowfall of 1” or more: 1/21/2022 1.5”; Last storm with 1” or more: 1/21-22/2022 2.3” -
1/10-11 super awesome winter SE OBS thread
donsutherland1 replied to strongwxnc's topic in Southeastern States
Charlotte’s record stretch without measurable snow has ended.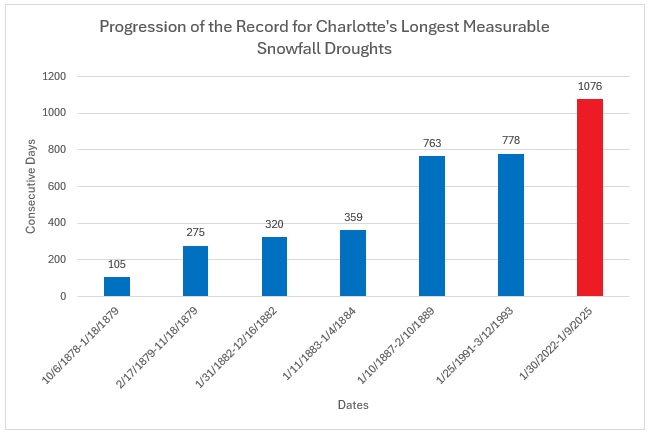
-
Atlanta’s official number is not yet available.
-
Some snow flurries or snow showers are likely tonight into tomorrow as a storm passes well to the south and east of the region. Any accumulations will be small. Following the storm, a fair and somewhat milder weekend lies ahead. High temperatures will top out in the upper 30s to near 40° in New York City and Philadelphia. It will likely turn colder again by the middle of next week. An extended period of generally below normal temperatures is underway in the New York City area. Although this cold regime will likely extend through at least the first three weeks of January, the kind of severe cold that produces minimum temperatures below 10° in the Philadelphia to New York City areas is unlikely during that period. The cold could still peak with readings dropping into the teens and several subfreezing highs. The third week of January will likely feature a continuation of widespread cold anomalies in much of the eastern half of the CONUS and Canada south of the Hudson and James Bays. Those anomalies will likely result more from the prolonged nature of the cold than its severity. However, notable exceptions could be areas with fresh snow cover that experience strong radiational cooling. Moderation is possible during the closing week of the month. The ENSO Region 1+2 anomaly was +0.1°C and the Region 3.4 anomaly was -0.7°C for the week centered around January 1. For the past six weeks, the ENSO Region 1+2 anomaly has averaged +0.02°C and the ENSO Region 3.4 anomaly has averaged -0.63°C. La Niña conditions are underway and will likely persist into the start of spring. The SOI was -4.75 yesterday. The preliminary Arctic Oscillation (AO) was -1.682 today. Based on sensitivity analysis applied to the latest guidance, there is an implied 78% probability that New York City will have a colder than normal January (1991-2020 normal). January will likely finish with a mean temperature near 30.7° (3.0° below normal).
-
Since 1970: Coldest winter: Winter 1972-73: DJF Mean temperature: 35.6°; Seasonal snowfall: 2.8" Coldest Month: December 1989: Monthly mean temperature: 25.9°; Monthly snowfall: 1.4"
-
For historical reference: NYC's coldest winter with less than 10.0" seasonal snowfall. Winter 1900-01: DJF mean temperature: 31.9°; Seasonal snowfall: 9.1"
-
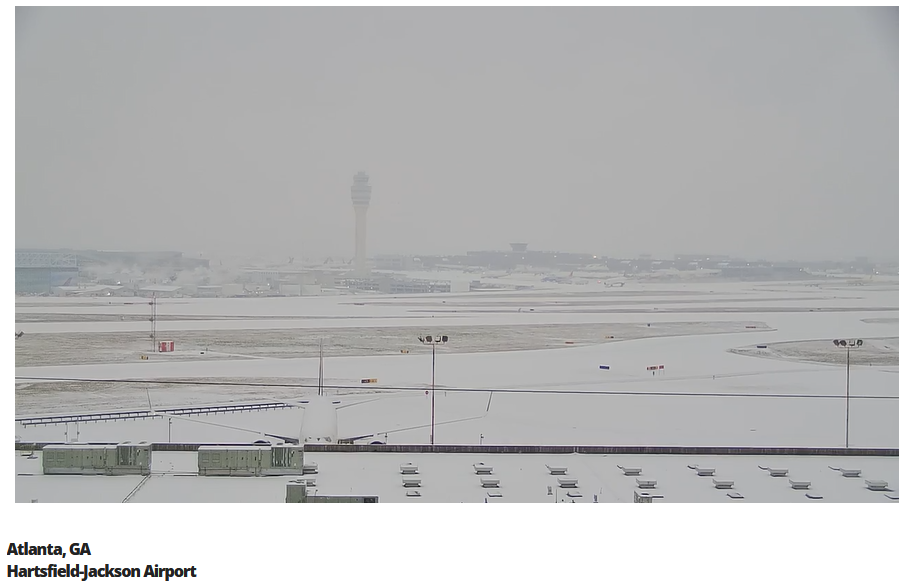
Atlanta has measurable snowfall. The webcam from Hartsfield International Airport: https://www.fox10phoenix.com/webcams-atlanta2
-
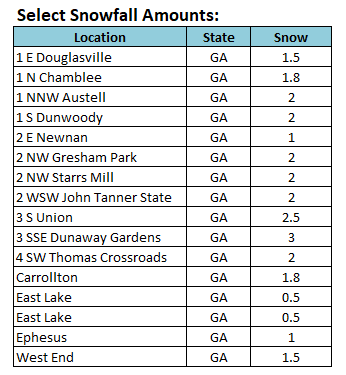
Some early snowfall amounts from Georgia. No figure for Atlanta is available, yet.
-
Yes. It's still a possibility, but at least Atlanta will have its first meaurable snowfall in just over two years. Charlotte's record 1,076-day streak without measurable snowfall should also end later today.
-
Last measurable: 0.1", Deember 26, 2022; Last storm with 1" or more: January 16-17, 2018: 2.4" (2.3" fell on January 17).
-
Atlanta has gone over to light snow.
-
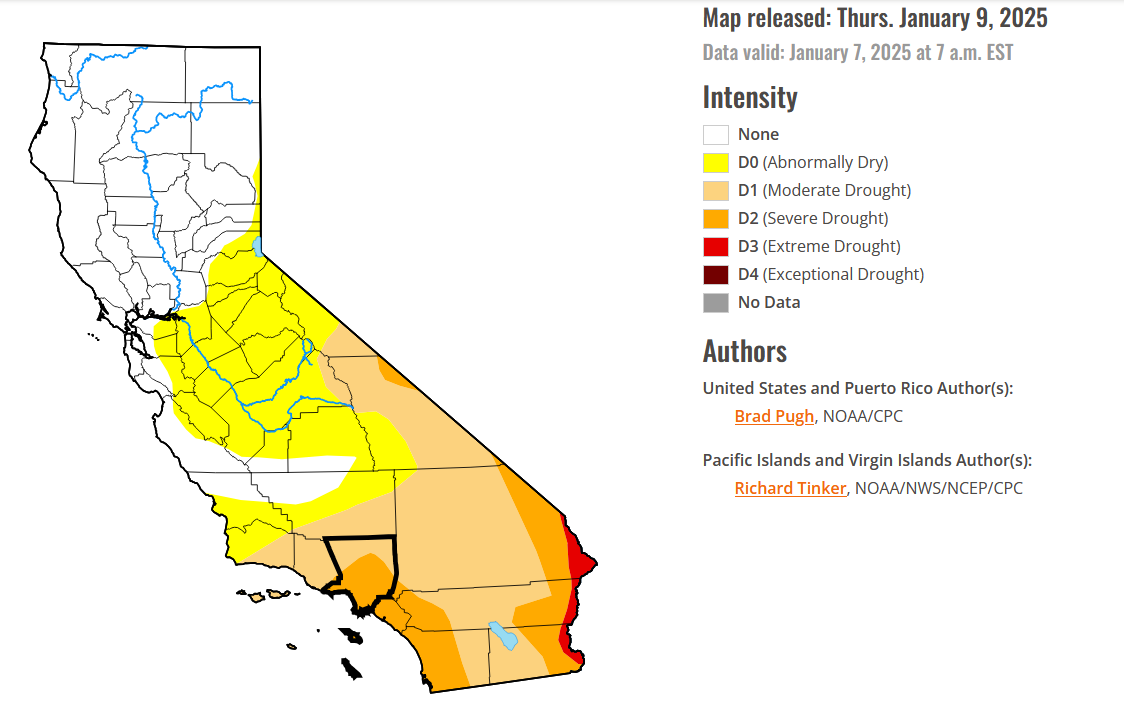
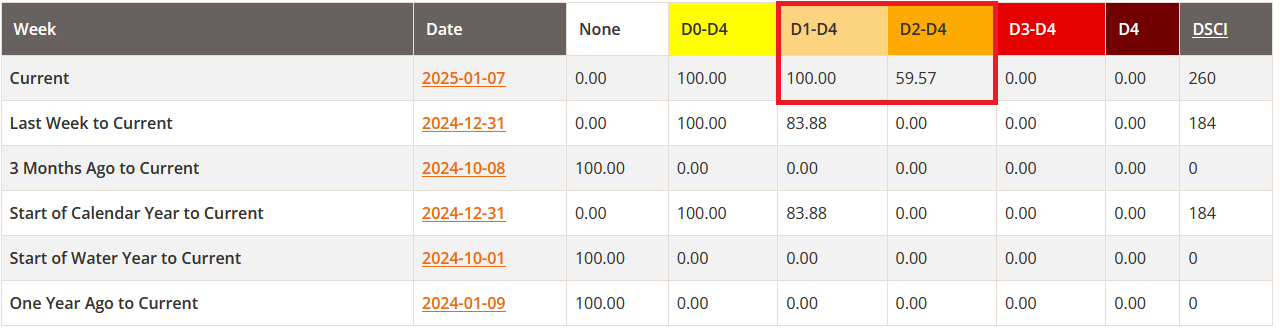
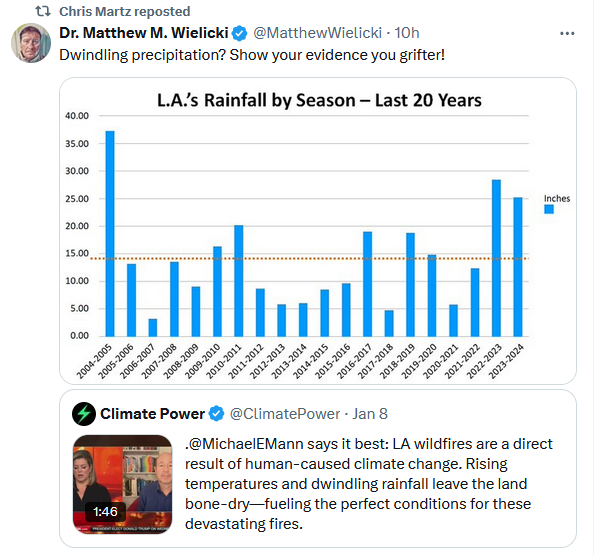
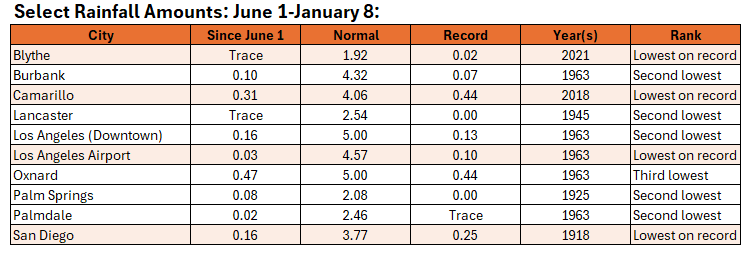
Even as the flames of wildfires ringing the Los Angeles area in hellish fashion have consumed some 4,000 structures, climate change deniers are exploiting the catastrophe to push disinformation. Let's take a quick look. Neither Wielicki nor Martz has sufficient understanding of weather and climate to analyze what has actually taken place. Instead, both push the common fallacy that rainfall in the past (last 20 winters, in this case) means there can't possibly be a drought, much less severe wildfire conditions. Now the facts: 1. Los Angeles County is in the midst of a moderate or severe drought, as is much of southern California. Moreover, drought conditions were growing rapidly worse. The latest data: 2. Rainfall in past winters means nothing. That rainfall is in the distant past. What matters is how much rain has recently fallen. Many locations have had either their second lowest or lowest rainfall on record since June 1. Through yesterday, Blythe has gone a record 282 consecutive days without measurable rainfall. Lancaster has gone 238 consecutive days without measurable rainfall (second longest such streak). 3. Flash droughts, which can develop in as few as five days are becoming increasingly frequent due to climate change. Two papers: A global transition to flash droughts under climate change Global projections of flash drought show increased risk in a warming climate Increased risk of flash droughts with raised concurrent hot and dry extremes under global warming 4. Climate change is also driving an increase in the vapor pressure deficit leading to more intense and extreme wildfires. One paper: Quantifying contributions of natural variability and anthropogenic forcings on increased fire weather risk over the western United States 5. The literature has made abundantly clear that climate change is leading to an increased wildfire risk in southern California. A key paper: The season for large fires in Southern California is projected to lengthen in a changing climate Two Key Points: 1. Neither person cited in the opening has the background knowledge or information to make an informed judgment about weather, climate, or the antecedent conditions responsible for southern California's catastrophic wildfires. Their reasoning about past precipitation was fallacious. Both had no idea that the region was currently in a drought or any awareness that drought products exist and can readily be accessed by the public. They appear to have no knowledge of the concept of flash droughts, thus there flawed argument about past winters' rainfall. They are unfamiliar with the literature on the role of climate change in driving flash droughts, increased vapor pressure deficits, and on the wildfire risk to southern California. 2. At a time of great danger and terrible tragedy, such ill-informed social media accounts should refrain from pushing disinformation, if just for ethical reasons. Their misleading people--including those at risk of the wildfires or victims of the fires--can put lives at risk. It can also increase the emotional distress being experienced among those who have already lost much in the raging fires.


-
Guidance raised it. It's based purely on the guidance.