donsutherland1
-
Posts
24,192 -
Joined
12 Followers


About donsutherland1

-
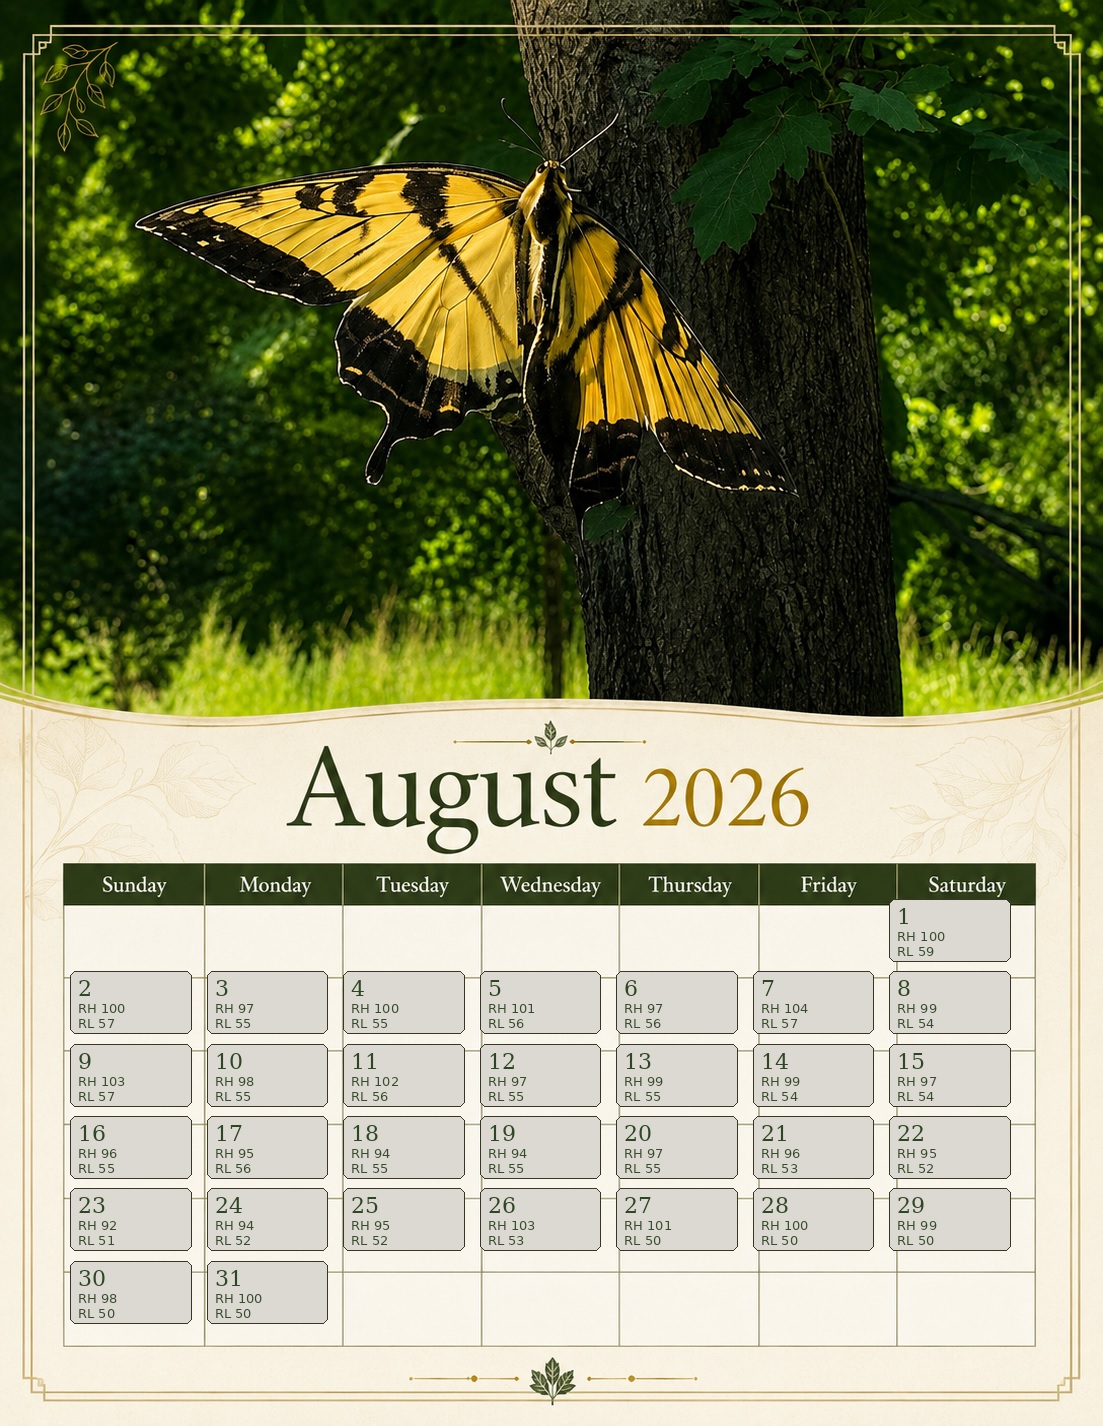
August 2026 calendar with record highs and record lows for Central Park.

-
August has begun on a quiet but warm note. No exceptional heat or severe storms were present to mark the start of the month. Tomorrow will be another quiet day with readings reaching the lower 80s. Afterward, a moderate to potentially locally significant rainfall is likely Monday into Tuesday. No exceptional heat is likely through the first week of August. The ENSO Region 1+2 anomaly was +3.8°C and the Region 3.4 anomaly was +2.2°C for the week centered around July 23. For the past six weeks, the ENSO Region 1+2 anomaly has averaged +3.38°C and the ENSO Region 3.4 anomaly has averaged +1.92°C. The ongoing strong El Niño will continue to strengthen through the summer. The SOI was -21.67 today. The preliminary Arctic Oscillation (AO) was -0.423 today.
-
Occasional Thoughts on Climate Change
donsutherland1 replied to donsutherland1's topic in Climate Change
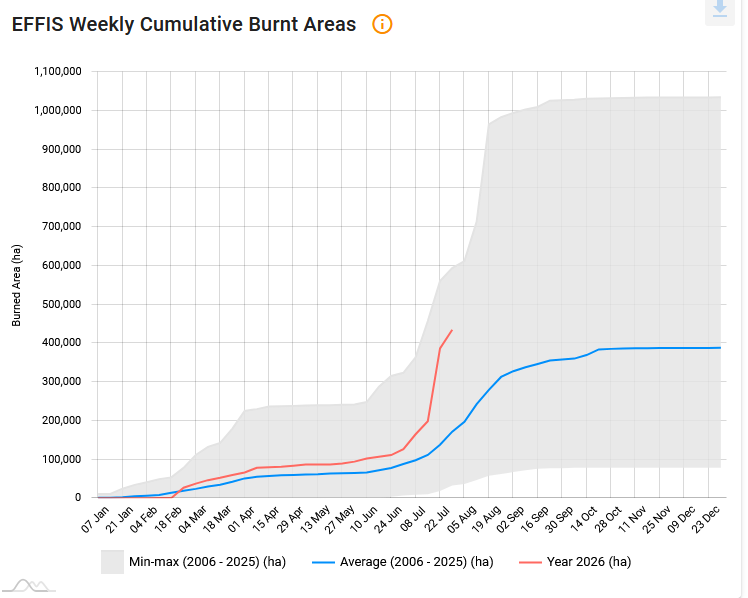
The map is dated. Nevertheless, winter fire activity in South America has so far been largely suppressed by a wetter to much wetter than normal start to winter. The U.S. has seen a fairly sizable pickup in fire activity in late July. -
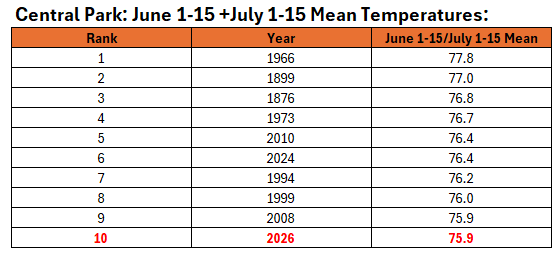
The first half of June+first half of July would have ranked as the 10th warmest such period. The second half of June + second half of July would rank as the 51st coolest such period (mean temperature: 74.0°; 2009 with a mean temperature of 68.0° is the coolest such period).
-
Occasional Thoughts on Climate Change
donsutherland1 replied to donsutherland1's topic in Climate Change
Heat domes aren't new. But the warming background climate has made even relatively ordinary heat domes much hotter than they were decades ago. Regional patterns coupled with a wetter climate has likely contributed to the recent absence of long-duration heatwaves in parts of the Northeast. -
Thank you. I made it.
-
DCA _ NYC _ BOS _ ORD _ ATL _ IAH _ DEN _ PHX _ SEA 0.3 0.3 0.8 1.5 2.0 0.5 2.0 2.0 1.6
-
Occasional Thoughts on Climate Change
donsutherland1 replied to donsutherland1's topic in Climate Change
The extreme heat was more the focus of climate change in my post, which merely noted that France was "wildfire-swept." At least for now, my understanding is that the connection between climate change and extreme heatwaves is stronger than the more complex linkage between climate change and wildfires. Nevertheless, there is a fairly prominent link. Since my initial post, World Weather Attribution (WWA) has published a rapid attribution report. Consistent with the expectations from a growing body of scientific literature, including one Nature piece talking about the future that I posted, climate change contributed. Excerpts: In Spain, January 2026 was the wettest January of the last quarter of a century (AEMET, 2026). In particular, in the area affected by the Ávila–Madrid–Toledo fire, rainfall was 175% higher than usual, which allowed a great accumulation of plant biomass. The summer of 2026 began with record-breaking temperatures and a severe drought, both conditions exacerbated by human-caused climate change (WWA, 2026a; WWA, 2026b). This sequence resulted in high fuel loads that then dried to become highly flammable, increasing the intensity of the fires... In 2025, WWA conducted two rapid attribution studies on fires in Spain and Portugal (WWA, 2025a) and Turkiye, Cyprus and Greece (WWA, 2025b), alongside a retrospective analysis of the entire wildfire season in several European regions (Keeping et al., 2026b). Across all three studies, we found that human-caused climate change was a key driver of the fire weather conditions, primarily through its influence on exceptionally high temperatures, but also by exacerbating drought conditions... The weeks leading up to the fires were characterised by a succession of extreme heatwaves and low rainfall across much of Western Europe, despite it still being comparably early in the season. Recent studies have shown human-caused climate change increased the likelihood of these hot and dry antecedent conditions, which were essential for the development of the extreme fire weather that enabled the fires... In both study regions observations show strong trends of increasing likelihood and severity with global warming. DSR7x values as extreme as those observed in central Spain in July 2026 are now at least 20 times more likely than in a pre-industrial climate. In the French regions the statistical model fits the data less closely and may underestimate the return period of the event, thus the result of an increase in likelihood by at least a factor two in southwest France is a conservative estimate... A recent attribution study has shown that climate change is increasing the likelihood of severe soil moisture drought through higher atmospheric evaporative demand, while the same sequence of above-average winter rainfall followed by exceptional spring drying was identified as a key driver of the 2025 Iberian wildfires. Finally, the WWA rapid attribution report cites and links to a fairly large number of papers on fire weather in Europe, many of which have relevance to the impact of climate change. -
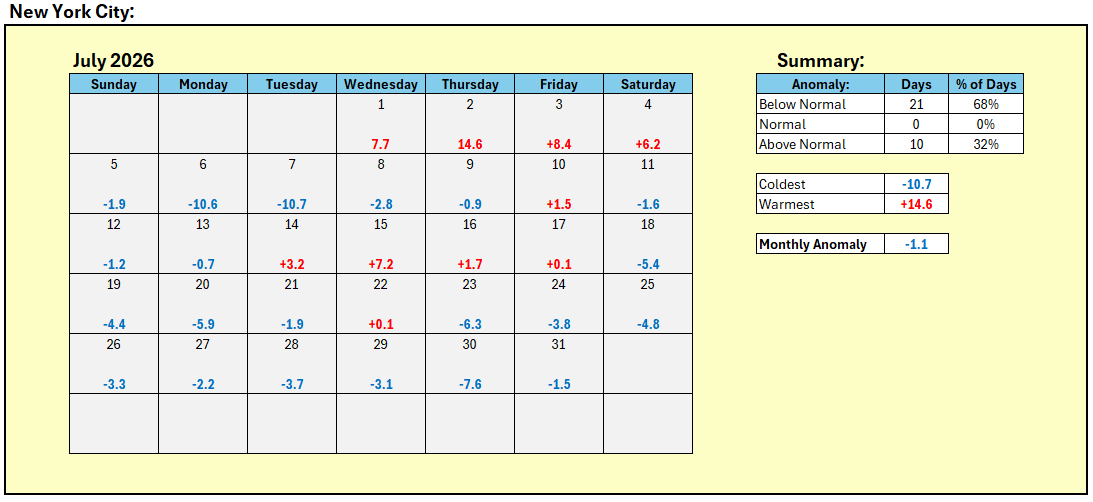
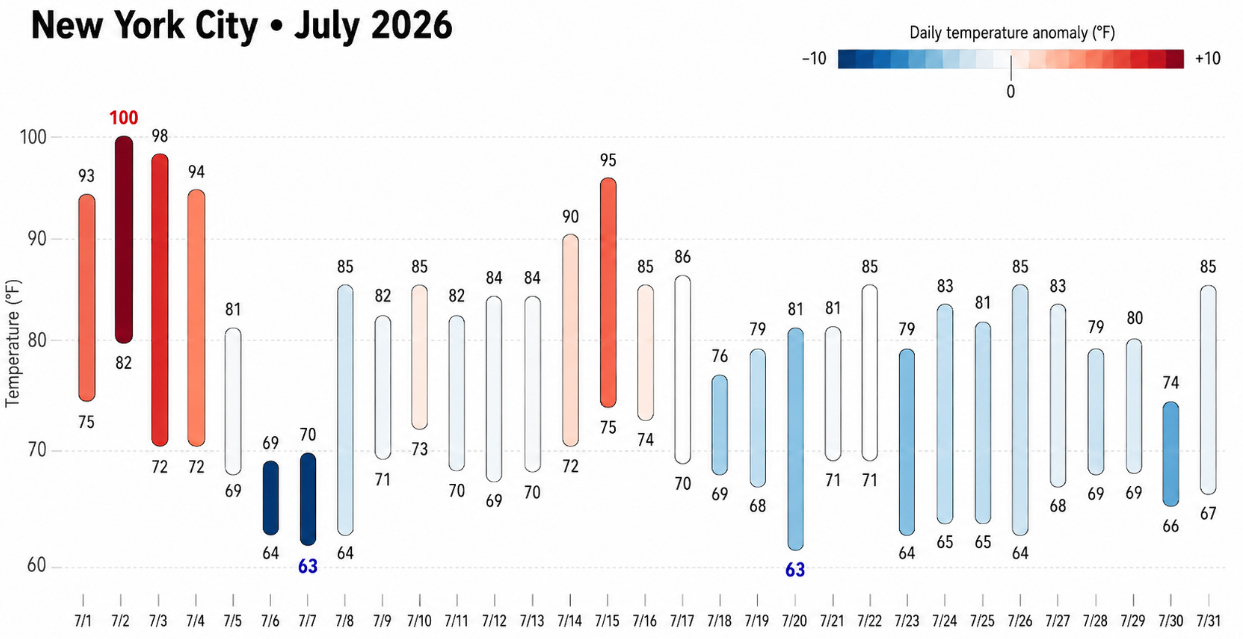
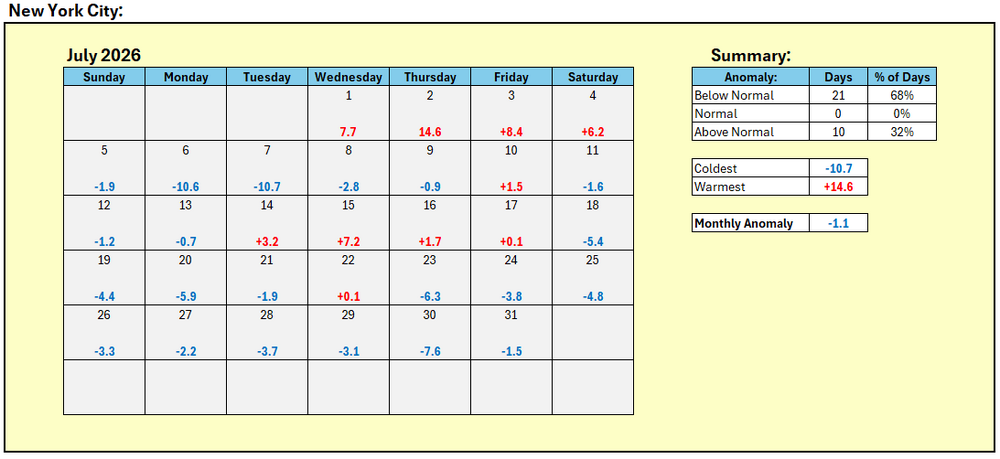
July 2026 finished with a monthly mean temperature of 76.4°, which was 1.1° below normal (0.1° below the 1981-2010 baseline).

-
New York City (Central Park) is finishing July with a monthly mean temperature of 76.4°. Despite the hot start to the month, that is 1.1° below normal (0.1° below the older 1981-2010 baseline). Temperatures could return to near seasonable levels for a time this weekend. Sunday could be a bit cooler than normal. Another moderate to potentially significant rainfall is likely Monday into Tuesday. No exceptional heat is likely through the first week of August. The ENSO Region 1+2 anomaly was +3.8°C and the Region 3.4 anomaly was +2.2°C for the week centered around July 23. For the past six weeks, the ENSO Region 1+2 anomaly has averaged +3.38°C and the ENSO Region 3.4 anomaly has averaged +1.92°C. The ongoing strong El Niño will continue to strengthen through the summer. The SOI was -26.84 today. The preliminary Arctic Oscillation (AO) was -0.295 today.
-
Occasional Thoughts on Climate Change
donsutherland1 replied to donsutherland1's topic in Climate Change
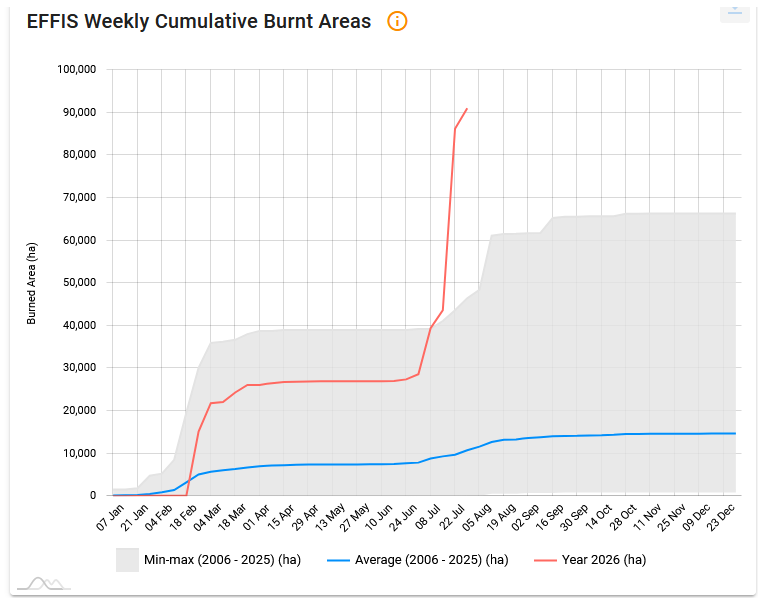
You objected to my description of "wildfire-swept France" with a map that was largely irrelevant to the issue at hand. The 2026 wildfire season has been very severe in France and also a bad one in the European Union. My providing information about France and the European Union to address the flaws in the chart that was used to object to my point about France does not argue that climate-change effects stop at the EU or that they exclude Russia. The posted chart was not appropriate for judging the severity of the fire season in France. More data are not automatically better if that additional data is irrelevant to the question at hand. Excluding the irrelevant data that had nothing to do with France wasn't "cherry picking." Including irrelevant data to dismiss the narrowly focused point concerning France creates a misleading picture. -
Occasional Thoughts on Climate Change
donsutherland1 replied to donsutherland1's topic in Climate Change
I was still editing and added an opening paragraph. This is projected to happen during climate change. I am not certain about seasonal variations, though June 2026 has been quite wet. A Finland publication describing climate change refers to increasing winter rains. https://itameri.fi/en/state-of-the-baltic-sea/climate-change/ This year, January-February were drier than normal in Scandinavia, but March was wetter than normal. -
Occasional Thoughts on Climate Change
donsutherland1 replied to donsutherland1's topic in Climate Change
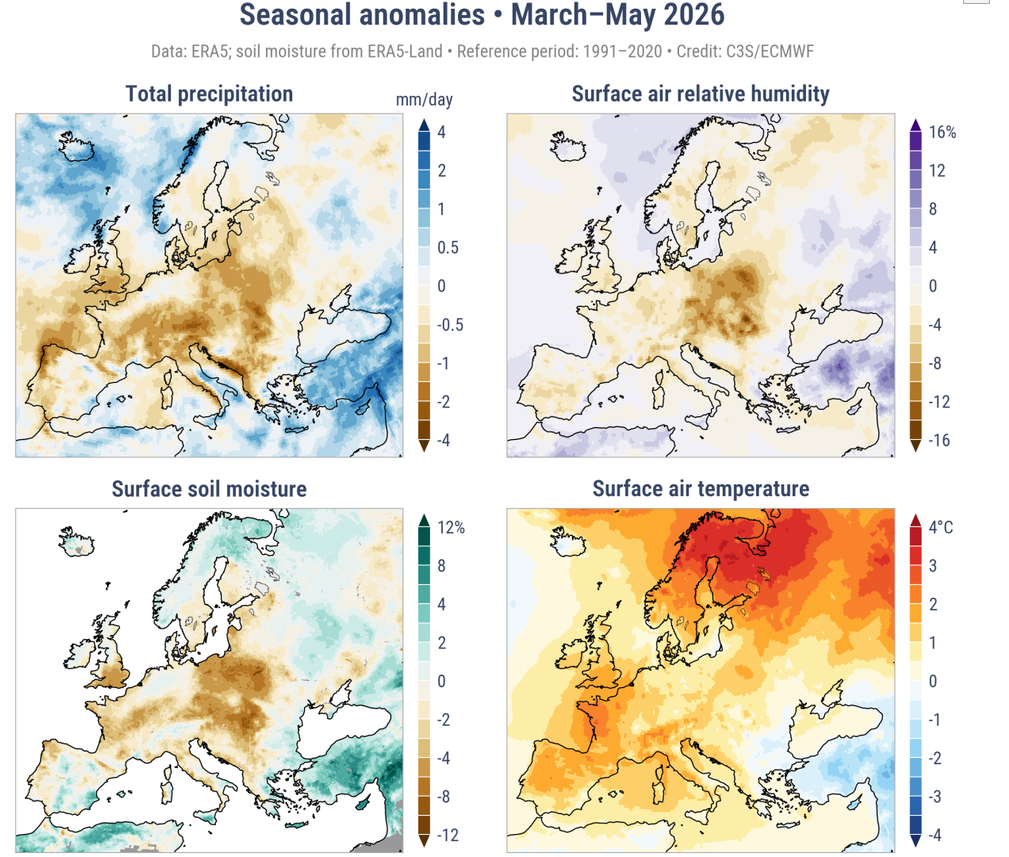
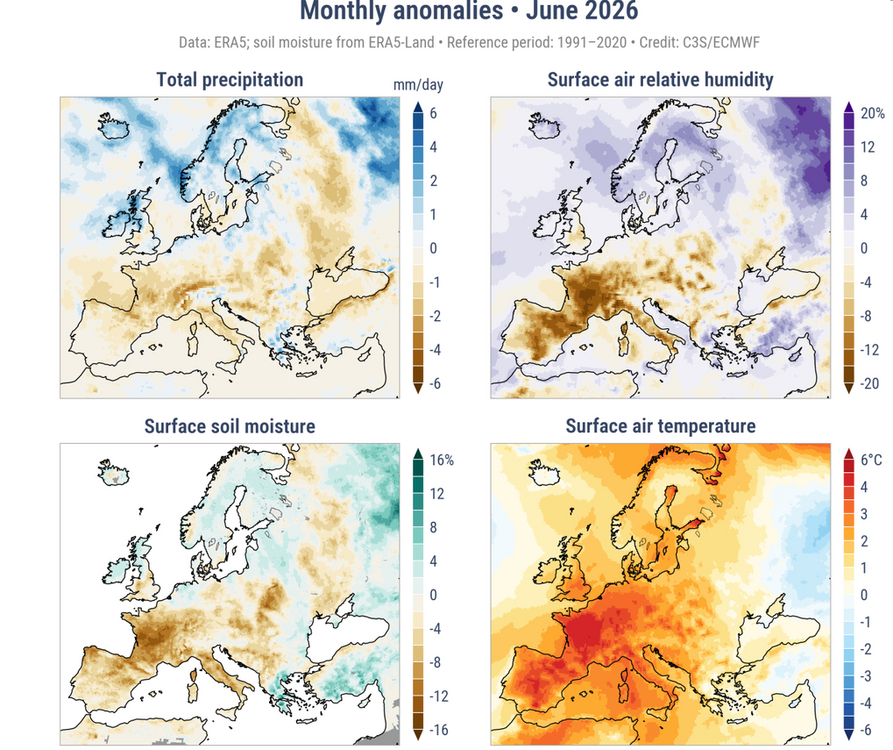
The Baltics and Scandinavia are projected to grow warmer and wetter from climate change. The 10-year precipitation anomalies suggest that this process may be ongoing. I am not sure whether it's just winters or overall. June has been wetter than normal this year. In terms of fire weather given the introduction of European data that included Russia, the Copernicus provides data showing that European Russia had near to above normal precipitation during spring 2026. The part that had been somewhat dry during spring saw much above normal precipitation in June. Compare and contrast the surface air relative humidity in Russia vs. France/Spain both in Spring and then June. The data suggested that France/Spain had explosive fire potential given the dry conditions that had emerged there. June 2026: It should also be noted that a wet conditions followed by drought lead to the worst fire potential. Europe saw a severe drought develop this spring. Relevant excerpt from the scientific literature: "The combination of abundant fuel (resulting of the 2025 wet spring; Fig. S3d), exceptional heat, and severe summer drought fueled the intense fires that raged across northwestern Spain last year." https://www.nature.com/articles/s41598-026-61756-4
-
Occasional Thoughts on Climate Change
donsutherland1 replied to donsutherland1's topic in Climate Change
World Weather Attribution has now released an analysis concerning the wildfires in France and Spain. https://www.worldweatherattribution.org/climate-change-increases-likelihood-of-compounding-drivers-of-severe-wildfire-conditions-in-france-and-spain/ -
Occasional Thoughts on Climate Change
donsutherland1 replied to donsutherland1's topic in Climate Change
Several things: 1) Your posted chart includes Russia. It has been an above average fire season in the European Union so far. As per Copernicus: 2) France is having its worst fire season (Copernicus) in some two decades: 3) Climate change has contributed through its impact on heat/drought, which increased the vapor pressure deficit (dried the vegetation). The impact of climate change--how much more likely, how much worse, etc.--the fires would have been has not yet been assessed in the attribution studies. It's had a contribution. The extent of the contribution remains to be determined. 4) Climate change is expected to lead to an increase in extreme wildfires. https://www.nature.com/articles/s41612-024-00575-8