Jns2183
-
Posts
5,817 -
Joined
-
Last visited
Content Type
Profiles
Blogs
Forums
American Weather
Media Demo
Store
Gallery
Everything posted by Jns2183
-
Wunderground has now hit a no rain prediction for the rest of the evening. Looking at radar I can see that possibility Sent from my SM-G970U1 using Tapatalk
-
I have the realization that more than likely the only way I'm going to hit normal rainfall this year if others experience severe flooding so my new goal is 80% normal rainfall. Sent from my SM-G970U1 using Tapatalk
-
Full sun. 89. The dew point has dropped to 71 Sent from my SM-G970U1 using Tapatalk
-
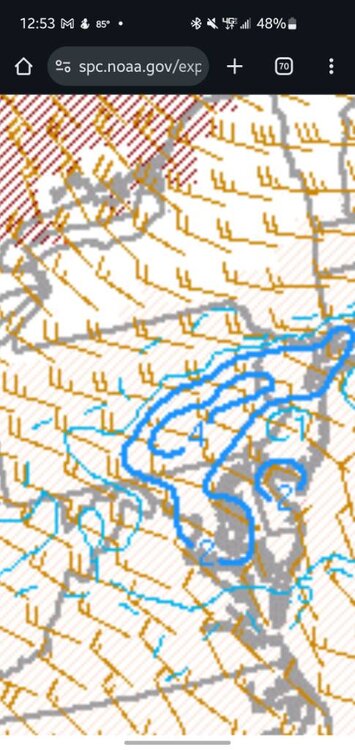
Supercell composite Right now it is the most ridiculous humid conditions with heat I've ever felt here Sent from my SM-G970U1 using Tapatalk
-
If something is going to blow up I'd beg for it to start developing in the Carlisle to Mechanicsburg area. Being upper 80s with sun and dewpoints that high I feel like there almost has to be a cap in place there that it has not blown up already Sent from my SM-G970U1 using Tapatalk
-
I'm full sun. It's 90, dewpoint 76 HI of 106 Sent from my SM-G970U1 using Tapatalk
-
Haha, wunderground now has all of Cumberland county and Harrisburg city proper getting less than 0.10" of rain today Sent from my SM-G970U1 using Tapatalk
-
I'll happily take higher temperatures with lower dewpoints. Yesterday was horrendous and today my heat index was 96 with a 84 air temperature. Literally makes me nauseous Sent from my SM-G970U1 using Tapatalk
-
It's 84 with dewpoint of 79 Sent from my SM-G970U1 using Tapatalk
-
I feel nuts sitting here worrying about rain when everyone else seems to be +7"-12" on me for the year Sent from my SM-G970U1 using Tapatalk
-
Doesn't Mt Joy have about 35" for the year so far? Which is nuts since it's 27 miles away. Sent from my SM-G970U1 using Tapatalk
-
Currently I'm sitting at 21.32" for the year. I should be at 25.76". For July I'm at 3.68", I should be at 4.76". So I'm definitely hoping for 2" today to eat into my 4.45" rain deficit. Sent from my SM-G970U1 using Tapatalk
-
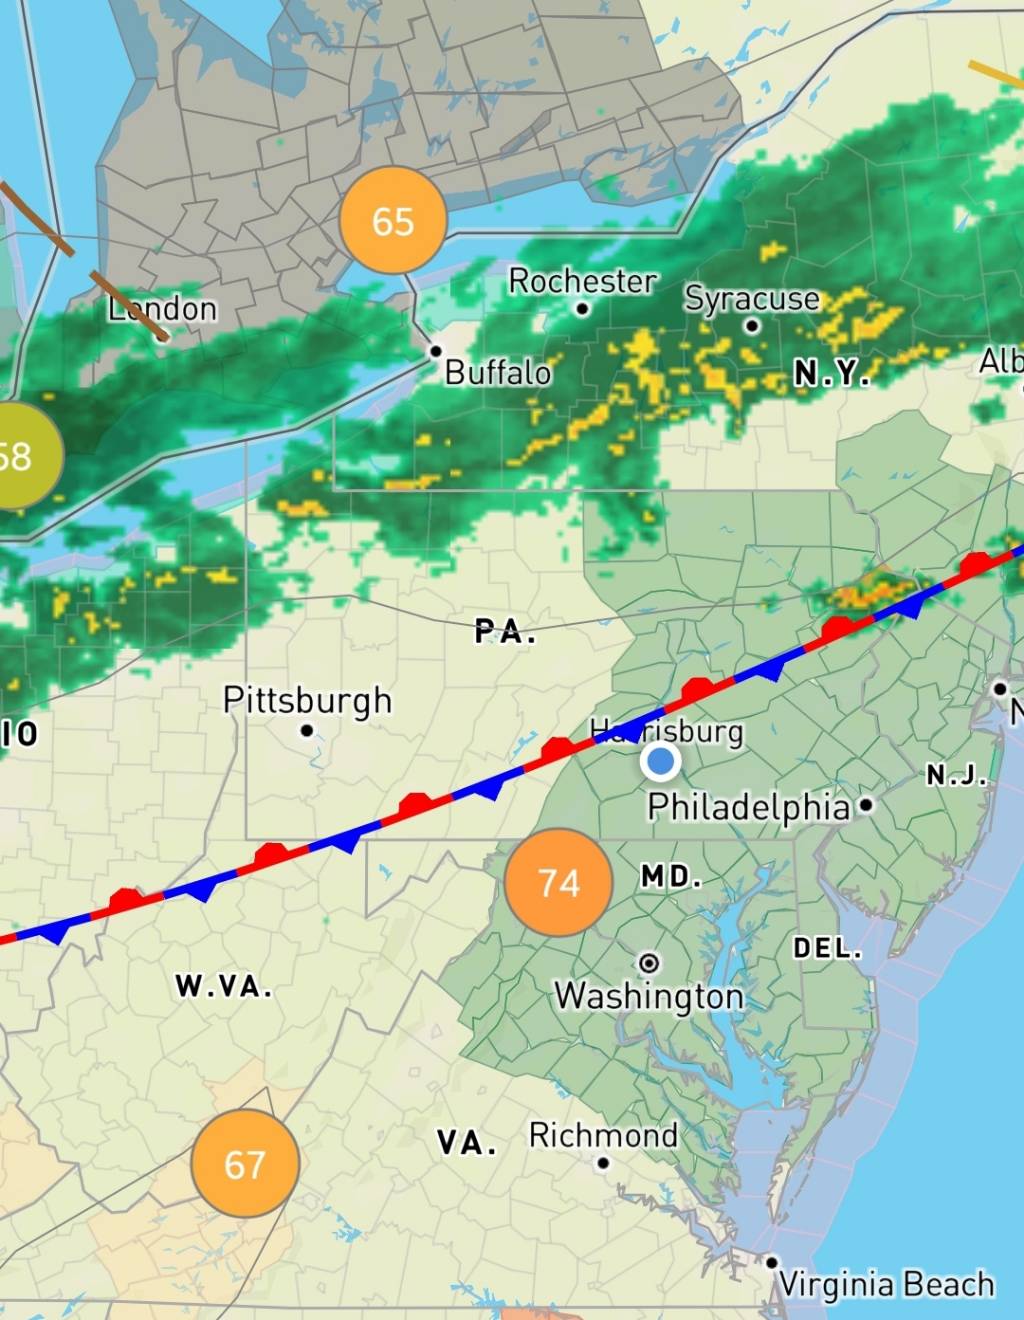
What's causing the outbreak up there something far north of boundary? Wunderground local forecasts give me whiplash. Today has been pegged by them as an inch plus day for days until this morning when it dropped to 0.15" Sent from my SM-G970U1 using Tapatalk

-
Today has gotten a lot of hype. Sent from my SM-G970U1 using Tapatalk
-
My friend camping way up north had the fun experience of zipping his tent to go piss and see 10 sets of yellow eyes looking back at him. Sent from my SM-G970U1 using Tapatalk
-
We have sacrificed all possible 100 degree days to the dewpoint gods Sent from my SM-G970U1 using Tapatalk
-
That's it? Sent from my SM-G970U1 using Tapatalk
-
Not a drop and I probably could have walked 1/5 miles either side at one point and hit rain. I figure this is nature easing me into getting 0.10" tomorrow Sent from my SM-G970U1 using Tapatalk
-
I hope we do as well, but I could easily see us on outside looking in Sent from my SM-G970U1 using Tapatalk
-
WPC has my estimated rainfall tomorrow at 0.50" if that Sent from my SM-G970U1 using Tapatalk
-
You are destined to triple my yearly rain total Sent from my SM-G970U1 using Tapatalk
-
Play the lottery tonight. Sent from my SM-G970U1 using Tapatalk
-
Everything is boiling outside. I forced myself to take trash out and this is the worst day all summer Sent from my SM-G970U1 using Tapatalk
-
It's 96 with a dewpoint of 76. Heat Index is 112. Seems a bit high for a mere heat advisory Sent from my SM-G970U1 using Tapatalk
-
I have off today and I refuse to even go outside once. It's a perfect 65 in my room. Sent from my SM-G970U1 using Tapatalk