

Jns2183
-
Posts
4,747 -
Joined
-
Last visited
Content Type
Profiles
Blogs
Forums
American Weather
Media Demo
Store
Gallery
Everything posted by Jns2183
-
This is exactly why deserts with endless irrigation are the best growing parts in the world. Who knew that endless sunshine and water on demand would create ridiculously good crops Sent from my SM-G970U using Tapatalk
-
That's way different than grass for me, even though I also made that claim specifically out west, not here Sent from my SM-G970U using Tapatalk
-
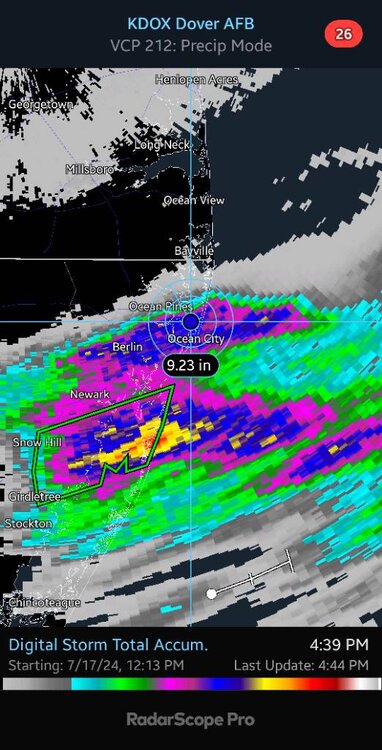
I'm sure radar is way overdone but I'm also sure one mile separated the haves from have nots Sent from my SM-G970U using Tapatalk
-
Looks like it. Looks like a mile was the difference between a lot and nothing Sent from my SM-G970U using Tapatalk
-
Insanity is Ocean City getting close to 9 inches while Bethany Beach gets nothing Sent from my SM-G970U using Tapatalk
.thumb.jpg.fefbce011c91e994c0f9a5f05feb8905.jpg)
-
I'd rather they do this than waste water out west where water is needed for the basics. I'd also rather go without almonds and a lot of nuts that are super water intensive. If people want them they can pay a super high premium for them Sent from my SM-G970U using Tapatalk
-
Truthfully out there nothing makes a difference compared to The agriculture sector that just a few families own most of. They use far more water than human consumption does. The trade-off is a lot higher prices at the grocery store for a lot of items though. Sent from my SM-G970U using Tapatalk
-
I'm also weird in while not being a huge fan of the state I believe they should be able to set water rates for different uses with draconian appellies for cheating the system. Frankly I don't believe grass should be grown at all in most of the Southwest or California and if it is the money raised from it should be able to pretty much fund the rest of the government. I mean I guess I don't have a problem with some ridiculously rich person wants to pay 10 million dollars a year to grow grass on this one acre lot but at least make it worthwhile for everybody else Sent from my SM-G970U using Tapatalk
-
Shrubs? Vines? Small trees? Sent from my SM-G970U using Tapatalk
-
I think you need to diversify your yard away from grass. For your sanity due to the reality the farmers shared with you Sent from my SM-G970U using Tapatalk
-
We desperately need a Chesapeake Bay mauler Sent from my SM-G970U using Tapatalk
-
What's the GPS again? Maybe the GFS is taking into account the idom wet follows wet Sent from my SM-G970U using Tapatalk
-
As @Voyager has stated. Allentown has feasted lately. But they did have a horrid horrid June so are at 5.7" about since June 1st. Sent from my SM-G970U using Tapatalk
-
We need @canderson to get a local slow mover. I think he's below 2" since June 1st and that his May wasn't as great as mine (6.8") and might have been below 4" Sent from my SM-G970U using Tapatalk
-
Which beach Sent from my SM-G970U using Tapatalk
-
I'm at 4" exactly since 6/1 3.88" June 0.12" July What is nuts is that in that Spam I only have 4 days where it rained more than 0.05". Those 4 days account for 3.75" Sent from my SM-G970U using Tapatalk
-
Well needed that's for sure. What are you at now since June 1st? Sent from my SM-G970U using Tapatalk
-
All I desire anymore is stratiform or tropical rain. Convective precipitation has let me down all summer, as I haven't seen close lightning since the begining on June. Whatever atmosphere conditions are causing or storms to fall apart in 15 to 20 minutes are also suppressing lightning formation in these parts. It is very odd because normally after a big heat wave we have prolific lightning producing storms Sent from my SM-G970U using Tapatalk
-
Are you talking about Saturday or next week? If we miss all next week I feel like going the joker route is the most logical outcome. Sent from my SM-G970U using Tapatalk
-
I have like a 30% chance Saturday. Next week looks like 50%+ for like 4 or 5 days Sent from my SM-G970U using Tapatalk
-
It is also the driest ever currently. Funny how those two attributes love to go hand in hand with each other Sent from my SM-G970U using Tapatalk
-
Most important are the rain chances next week Sent from my SM-G970U using Tapatalk
-
KMDT saw it's first measurable precipitation in July today. It was 0.15". At this point I was kind of gunning for them to break through all time low precipitation record for the month of 0.68", but they may screw that up next week too Sent from my SM-G970U using Tapatalk
-
Up to 0.12" for July Sent from my SM-G970U using Tapatalk
-
Rocking 0.04" Sent from my SM-G970U using Tapatalk


.jpg.7e7d10acaebfb5be08e3266161e62ab2.jpg)

