Jns2183
-
Posts
5,851 -
Joined
-
Last visited
Content Type
Profiles
Blogs
Forums
American Weather
Media Demo
Store
Gallery
Everything posted by Jns2183
-
Central PA Summer 2026 Discussion/Obs Thread
Jns2183 replied to Voyager's topic in Upstate New York/Pennsylvania
I'm jealous of the sleeping weather over by Kansas city. Some areas there have had 4 to 6 hours straight of rolling thunder and moderate rain with that MCS slowly crawling. I'd take that so fast. Window open another to hear it all. I think it was summer 2011, that we had that week straight of overnight MCS as we sat on edge of heat dome. It was horrible during the day living in swampland, but every night for a week straight around 2-3am I awoke to thunder, lightning, rain from a slowly dying MCS. If I remember correctly the plants were turbo charged all summer from the plentiful moisture and heat. I feel like some of you still have records from cutting grass that summer. Sent from my SM-S731U using Tapatalk -
Central PA Summer 2026 Discussion/Obs Thread
Jns2183 replied to Voyager's topic in Upstate New York/Pennsylvania
I think I can find the radar. I texted my friend, but he's on his way to Brazil currently so we shall see. How are farmers summer crops coming along? Sent from my SM-S731U using Tapatalk -
Central PA Summer 2026 Discussion/Obs Thread
Jns2183 replied to Voyager's topic in Upstate New York/Pennsylvania
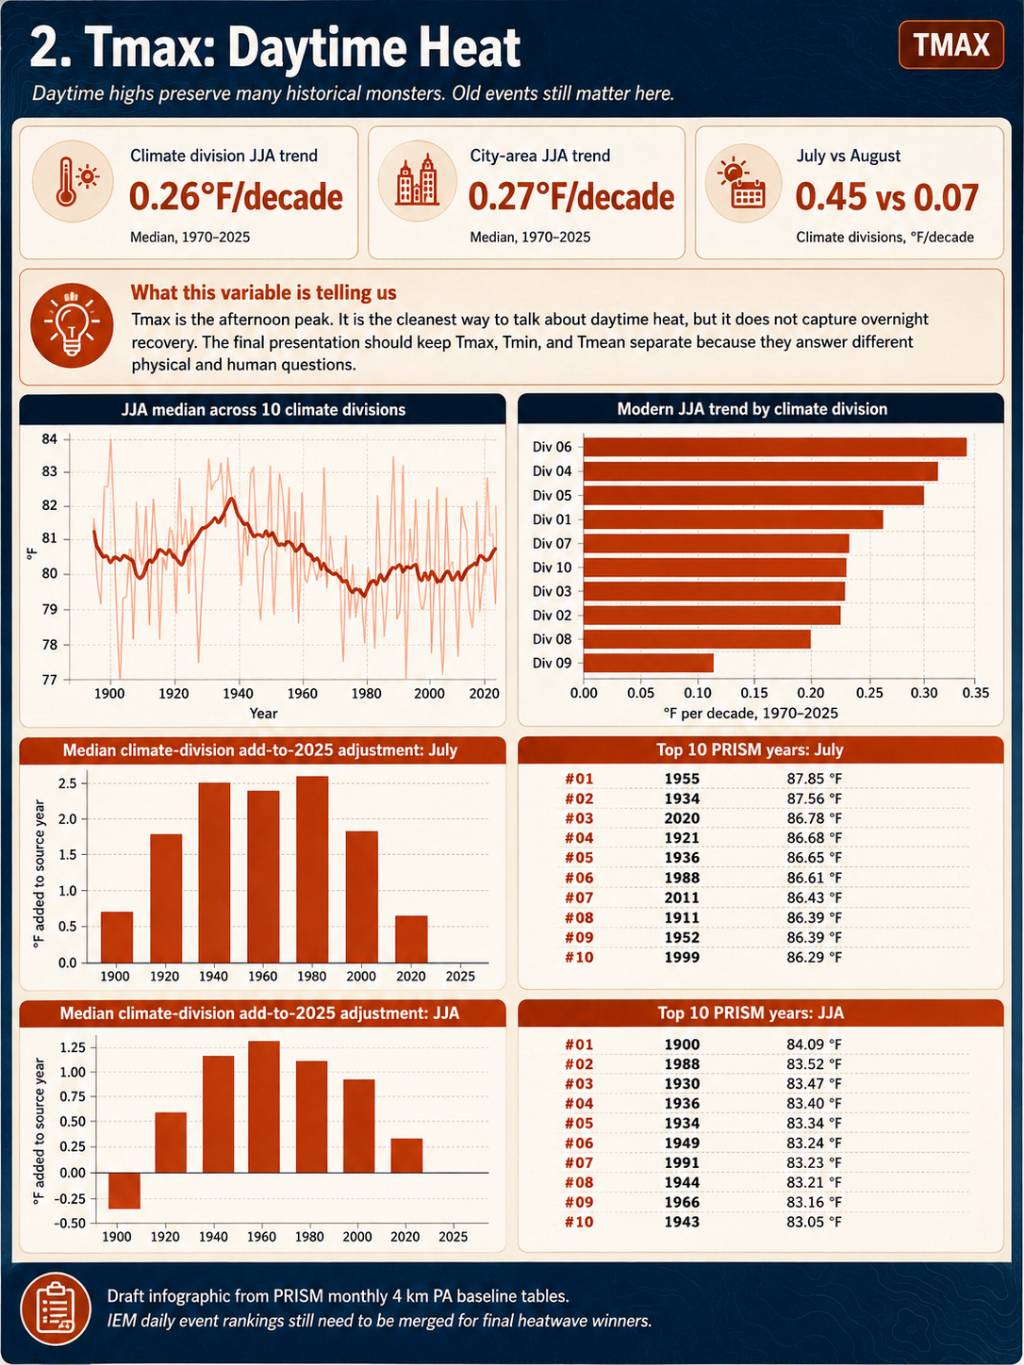
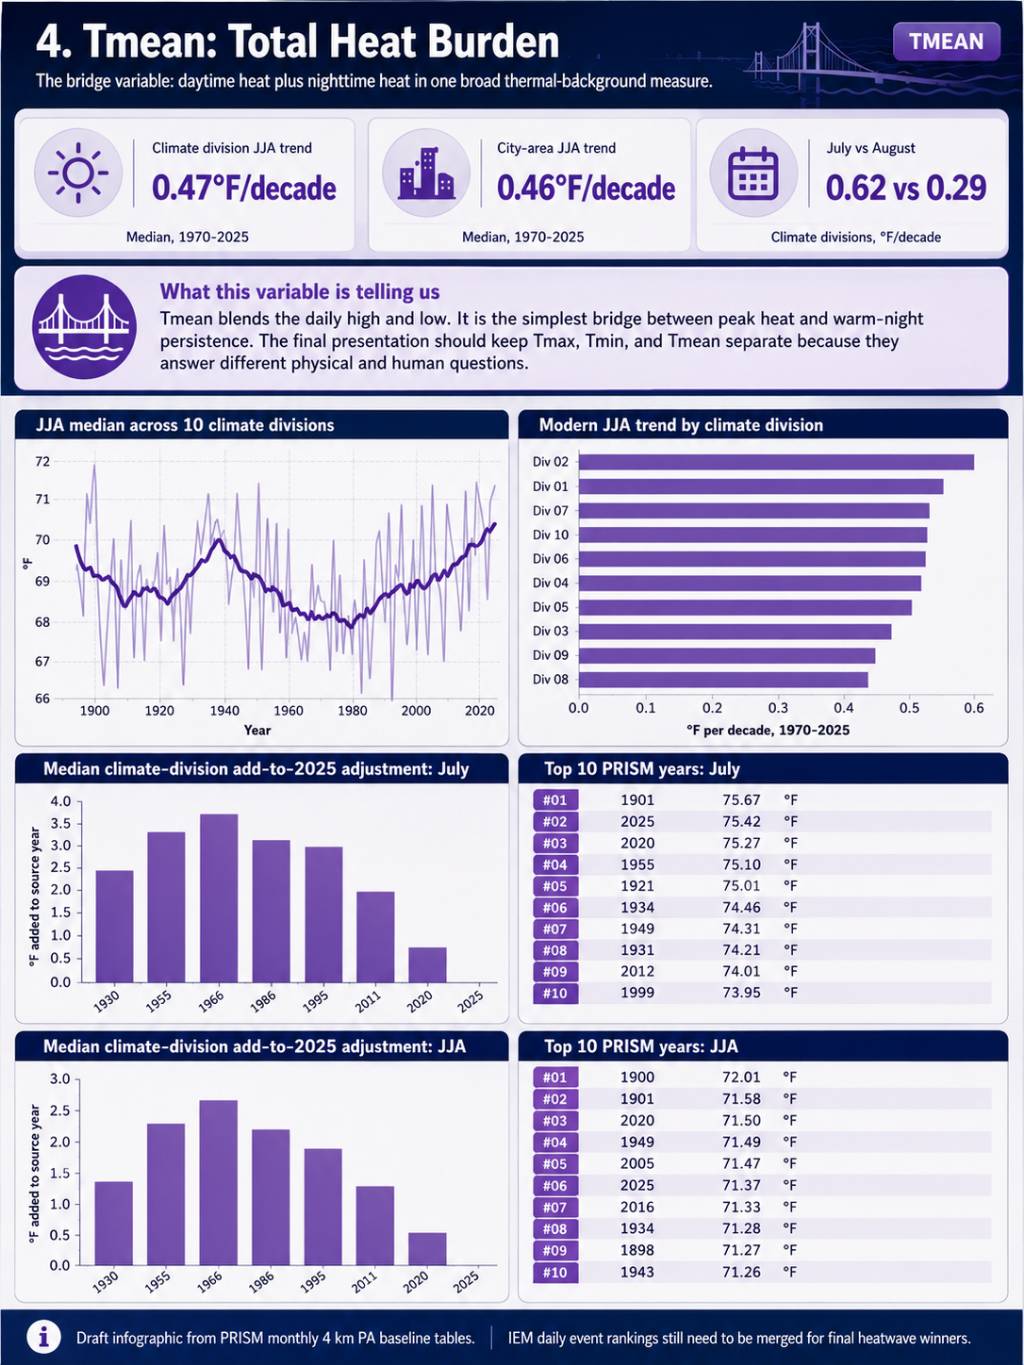
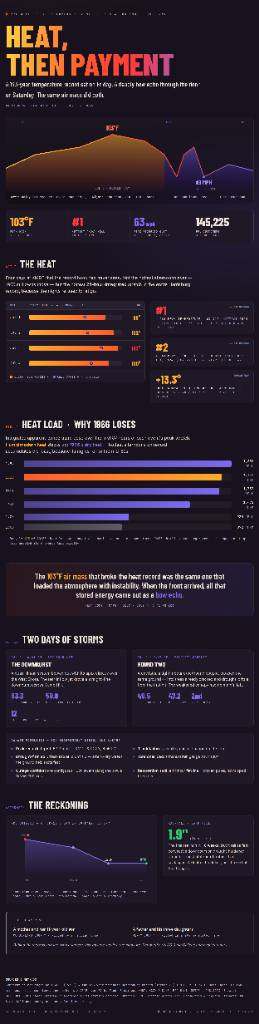
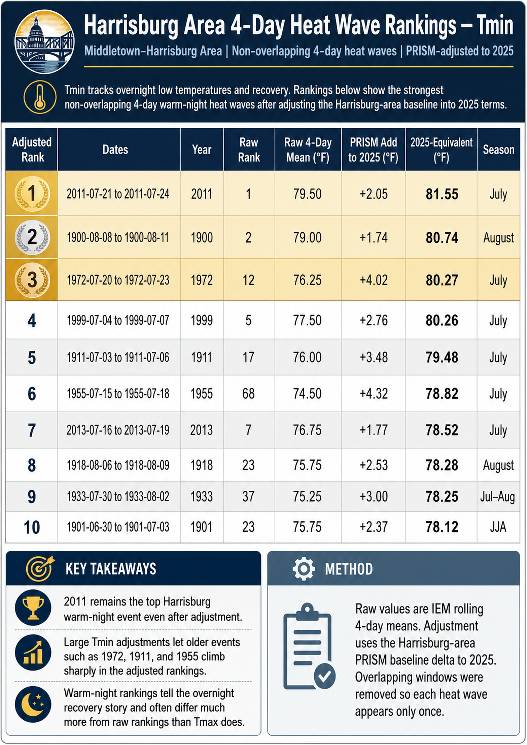
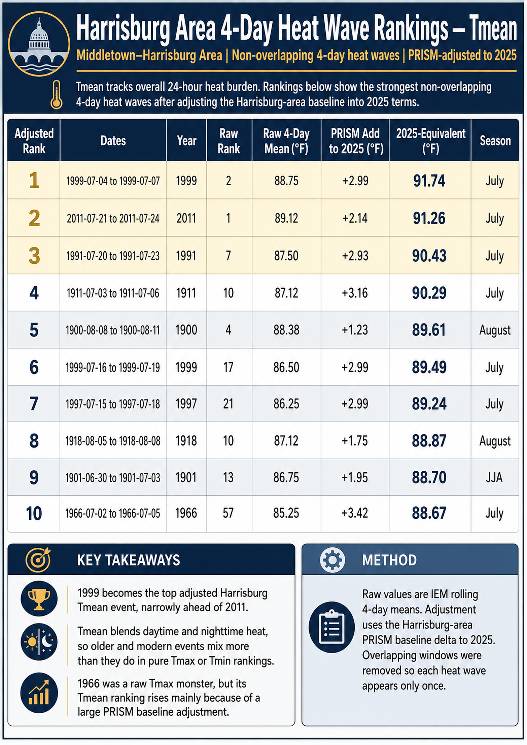
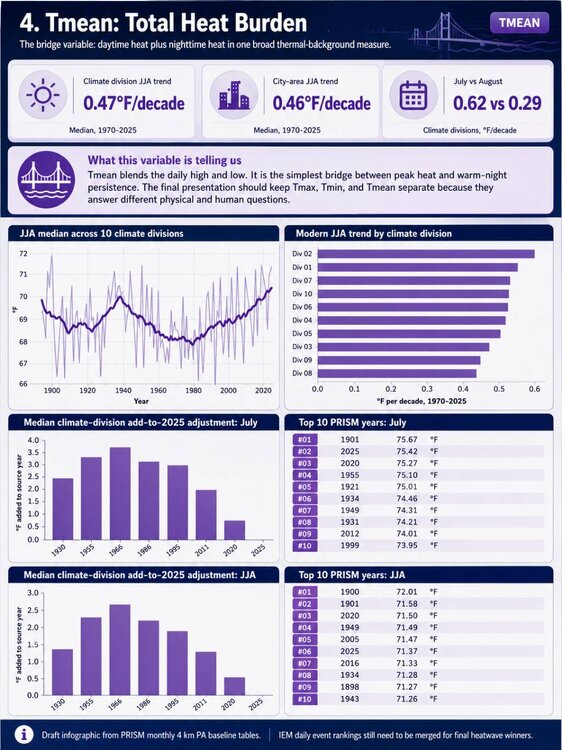
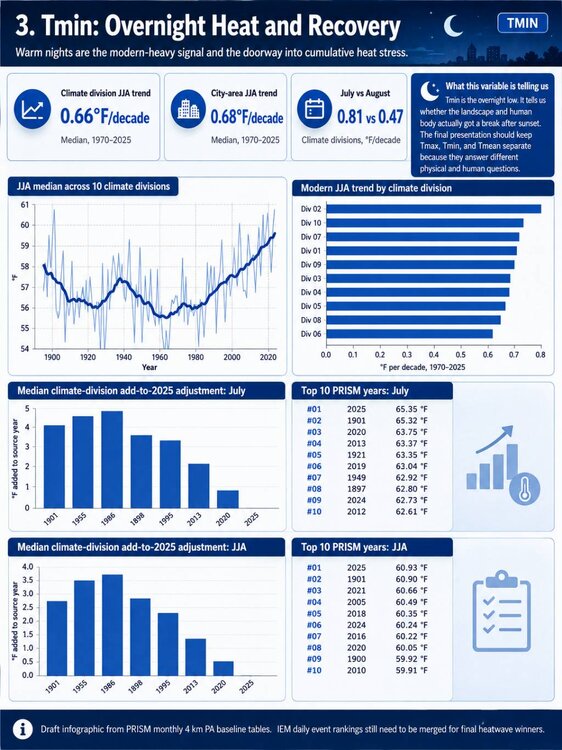
Here are my updated heatwave rankings. It doesn't have the latest one in them simply because I need to wait till July passes to properly weight the temperature. I don't think most people know just how dry the summer of 1966 was, nor that our hotest summer by max temperature was 1949. The 1930's to 1940's were brutal here. Hot summers and crappy snow in the winter. Sent from my SM-S731U using Tapatalk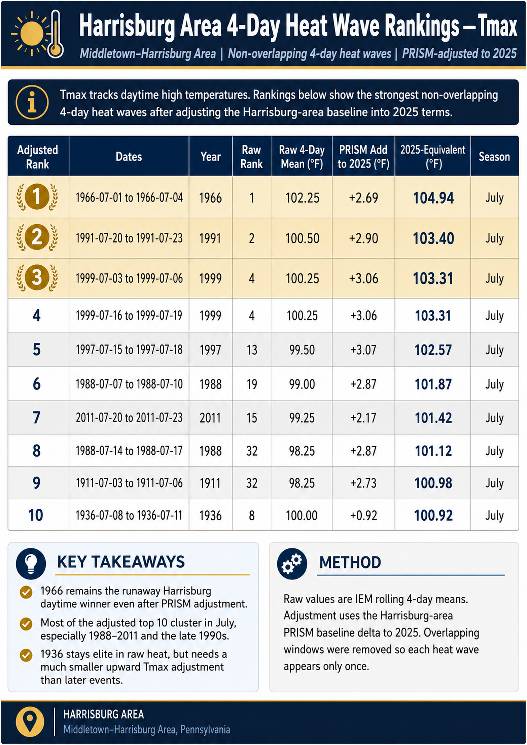
-
Central PA Summer 2026 Discussion/Obs Thread
Jns2183 replied to Voyager's topic in Upstate New York/Pennsylvania
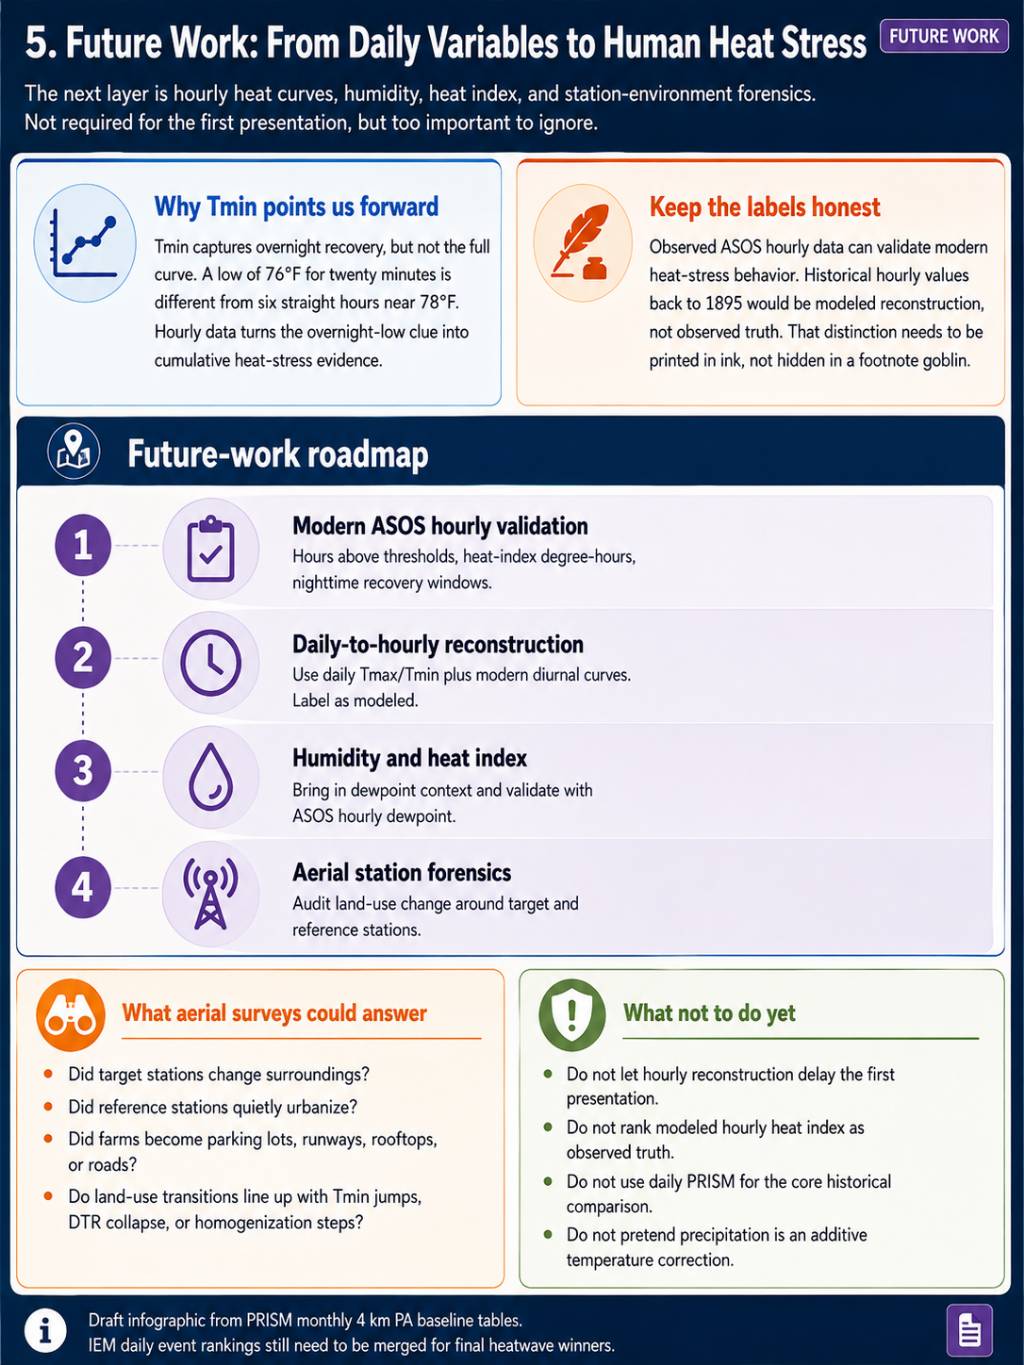
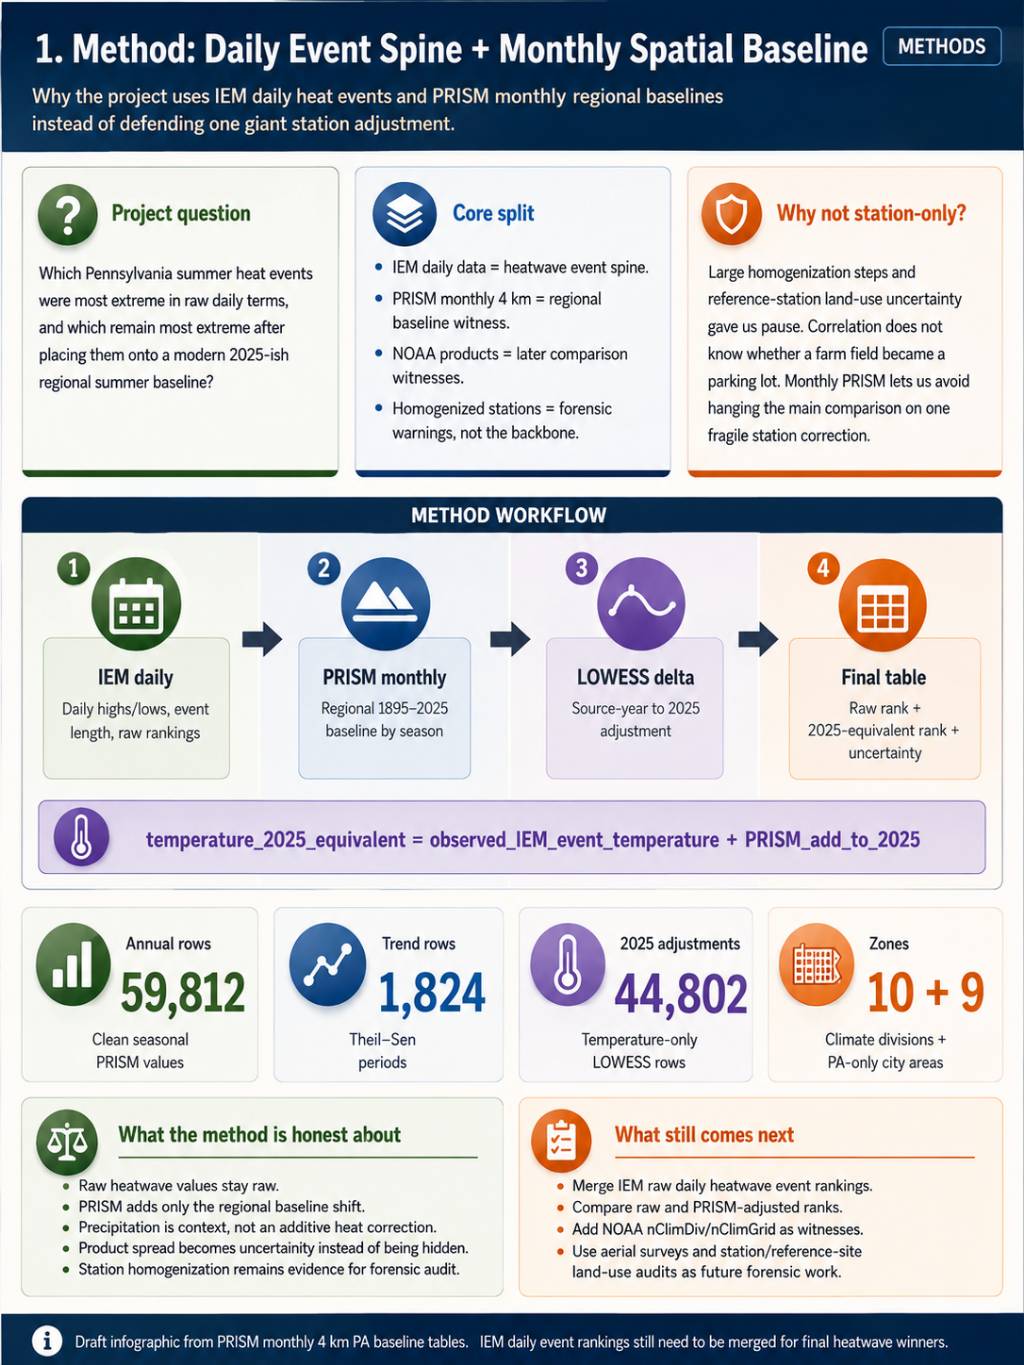
I tried to find the most defensible position in putting every summer day from 1895 to 2025 on a 2025 scale. I looked at various methods. Homogenization is not meant to answer that question and it provided less clarity the deeper I went. Future work is to try to get more a handle of what I saw there. This i feel is a strong position where I honestly put forth confidence positions. I look forward to feedback. For future work I think there's lots of potential in an area I have not seen developed at all and that is using the aerial surveys that were digitized by Penn State starting in the 1930s through the 1960s all across Pennsylvania where we could actually see the land use changes in real time in the placement for some of these long-term climate sites and the stations that they are correlated with maybe combining that with the metadata we can get a better idea of what was going on at different times and what adjustments are supported which ones are artifacts of piecewise correlations. I find this absolutely thrilling and exciting because it really has a bit explored much from the angle I'm looking at. Sent from my SM-S731U using Tapatalk -
Central PA Summer 2026 Discussion/Obs Thread
Jns2183 replied to Voyager's topic in Upstate New York/Pennsylvania
Future work Sent from my SM-S731U using Tapatalk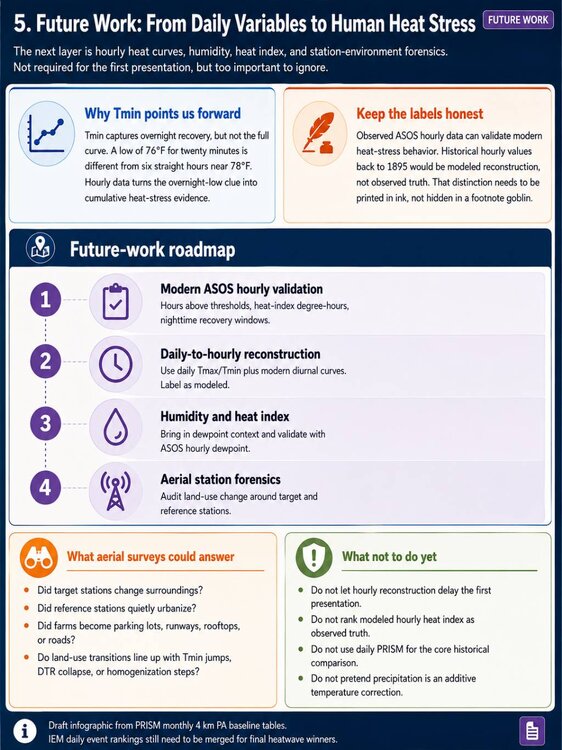
-
Central PA Summer 2026 Discussion/Obs Thread
Jns2183 replied to Voyager's topic in Upstate New York/Pennsylvania
I promised some fun Sent from my SM-S731U using Tapatalk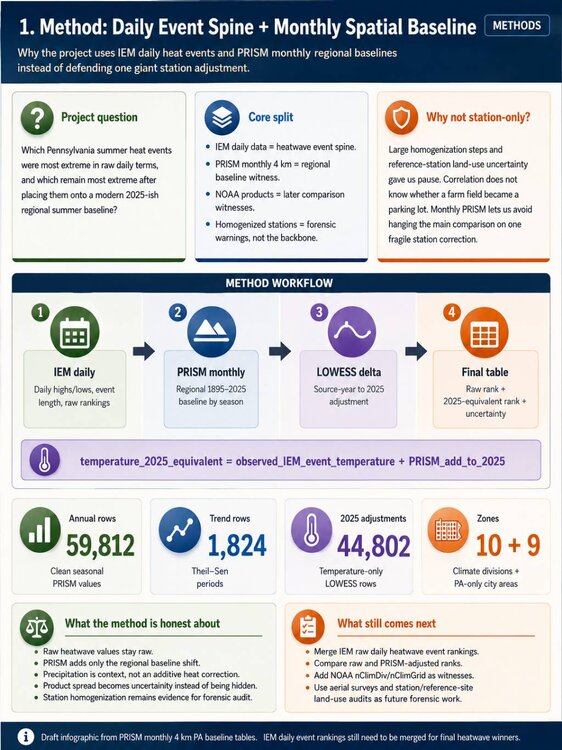

-
Central PA Summer 2026 Discussion/Obs Thread
Jns2183 replied to Voyager's topic in Upstate New York/Pennsylvania
I wonder if we are going to get a single good cape verde Atlantic storm this year or if it will all be Gulf and homebrew Sent from my SM-S731U using Tapatalk -
Central PA Summer 2026 Discussion/Obs Thread
Jns2183 replied to Voyager's topic in Upstate New York/Pennsylvania
I need to get the video from my friend. He does his roto drone up so we had a good view of rotating wall cloud. It was cool as shit Sent from my SM-S731U using Tapatalk -
Central PA Summer 2026 Discussion/Obs Thread
Jns2183 replied to Voyager's topic in Upstate New York/Pennsylvania
Thank you and thank everyone for letting me vent from my swamp castle the past few days. If anything I'm now interested in seeing what DIY solar, backup power solution I dump my weekends into. Because why do things easy when I can program a raspberry pi, a used portable solar generator and whatever gas generator I come across in a couple weeks as some people always sell after the appropriate amount of time. I also will be posting my final heatwave rankings, where I decided to get in the muck of temperature trends to have a defensible adjustment so that every year is as equivalent as possible to 2025. I think the results are absolutely amazing and will spark some fun conversations Sent from my SM-S731U using Tapatalk -
Central PA Summer 2026 Discussion/Obs Thread
Jns2183 replied to Voyager's topic in Upstate New York/Pennsylvania
Let there be light!!!!!! I set my ac to 63, took a long shower and now I'm attempting to get hyperthermia Sent from my SM-S731U using Tapatalk -
Central PA Summer 2026 Discussion/Obs Thread
Jns2183 replied to Voyager's topic in Upstate New York/Pennsylvania
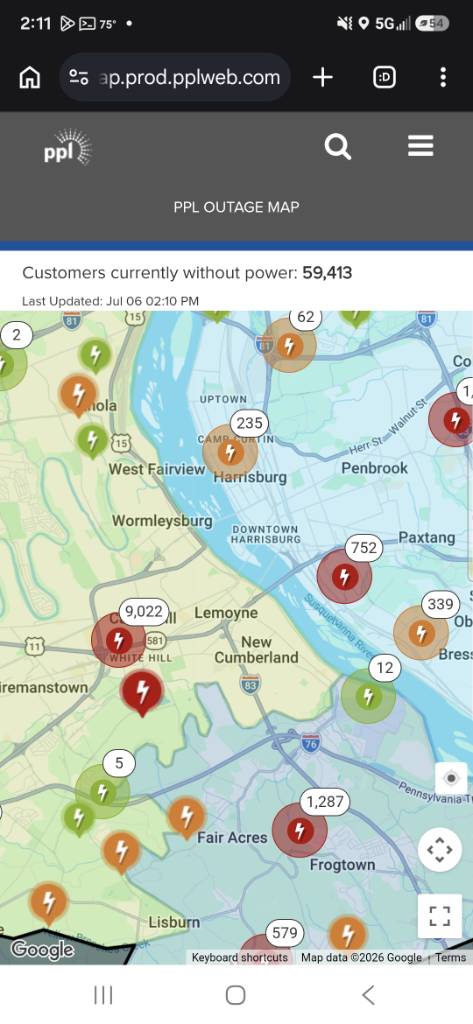
I called PPL and all they could say was sometime between today and Friday. The app still says today, the latest I was able to even find in the app was Thursday. I'm torn when I should just bite the bullet and get a room at the Springhill Suites by me. I think I'll try to wait till 6pm. I did a 1.5 mile walk around our neighborhood and nobody has even seen a ppl vehicle yet in the entire neighborhood and I managed to talk to about 20 people Sent from my SM-S731U using Tapatalk -
Central PA Summer 2026 Discussion/Obs Thread
Jns2183 replied to Voyager's topic in Upstate New York/Pennsylvania
A little summary of first few days of July Sent from my SM-S731U using Tapatalk
-
Central PA Summer 2026 Discussion/Obs Thread
Jns2183 replied to Voyager's topic in Upstate New York/Pennsylvania
Any updates on the power situation. I feel like I'm waiting on them to pull the rug out from under me and push it back further Sent from my SM-S731U using Tapatalk -
Central PA Summer 2026 Discussion/Obs Thread
Jns2183 replied to Voyager's topic in Upstate New York/Pennsylvania
East winds gave us the drizzle and stable atmosphere Sent from my SM-S731U using Tapatalk -
Central PA Summer 2026 Discussion/Obs Thread
Jns2183 replied to Voyager's topic in Upstate New York/Pennsylvania
Here Sent from my SM-S731U using Tapatalk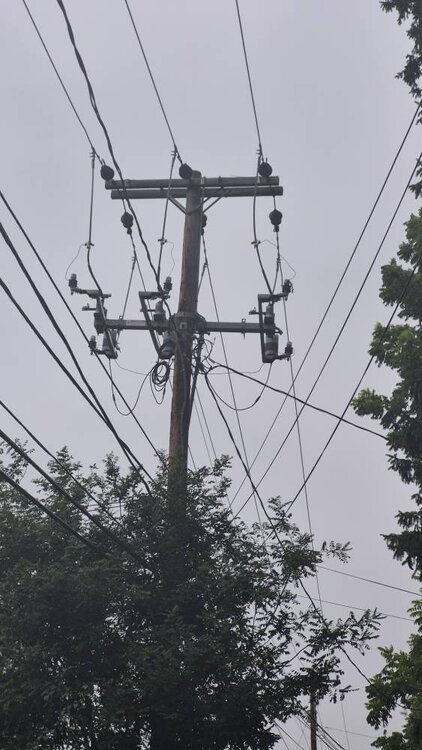
-
Central PA Summer 2026 Discussion/Obs Thread
Jns2183 replied to Voyager's topic in Upstate New York/Pennsylvania
Which evasive ones Sent from my SM-S731U using Tapatalk -
Central PA Summer 2026 Discussion/Obs Thread
Jns2183 replied to Voyager's topic in Upstate New York/Pennsylvania
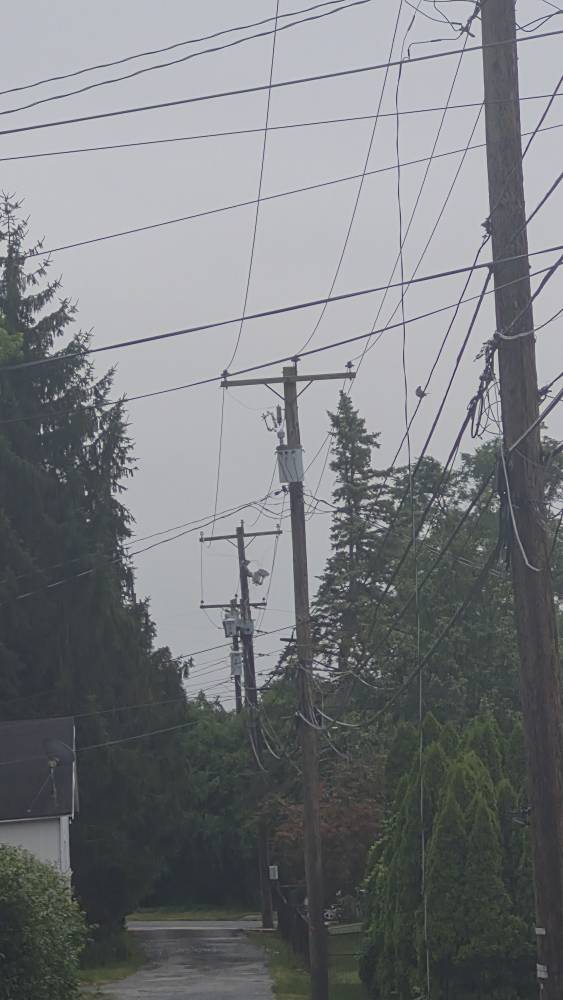
I'm just still shocked I haven't seen a single ppl truck, vehicle, tree removal service, anything. There's a ton of business still out of power including urgent care center close to me, gas stations, restaurants Sent from my SM-S731U using Tapatalk -
Central PA Summer 2026 Discussion/Obs Thread
Jns2183 replied to Voyager's topic in Upstate New York/Pennsylvania
They still seem adamant it will be fixed by tomorrow night, but I'm also starting to see Thursday night pop up in some of the smaller outages on the map Sent from my SM-S731U using Tapatalk -
Central PA Summer 2026 Discussion/Obs Thread
Jns2183 replied to Voyager's topic in Upstate New York/Pennsylvania
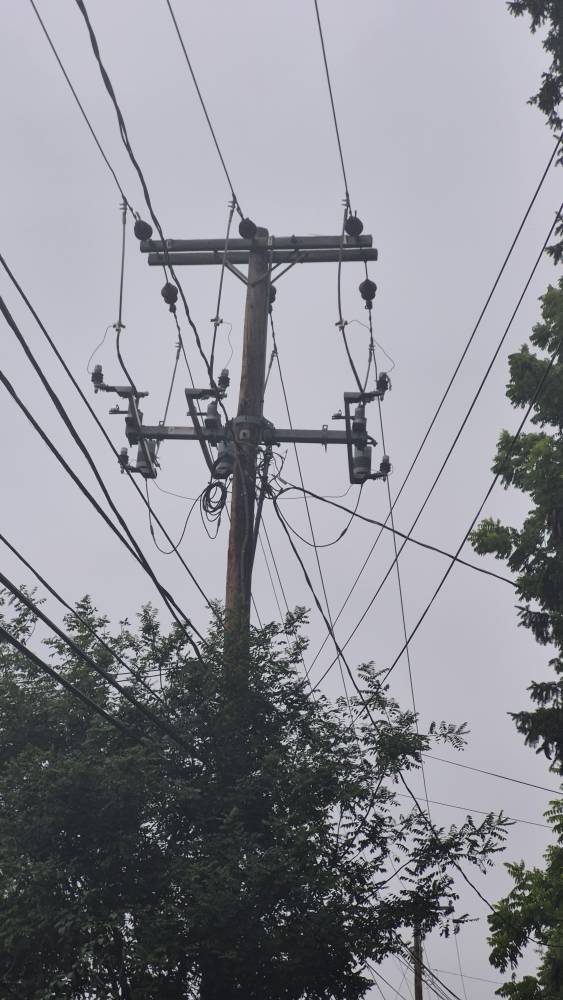
This must be one hell of a sub station Sent from my SM-S731U using Tapatalk
-
Central PA Summer 2026 Discussion/Obs Thread
Jns2183 replied to Voyager's topic in Upstate New York/Pennsylvania
That storm yesterday brought a tree down in my neighbor's yard that blew up the new fence we just put in along with deck. I've been dealing with insurance and chainsaws all morning. Work has power so I'm going to go work 12 hours just so I get some AC and fresh food Sent from my SM-S731U using Tapatalk -
Central PA Summer 2026 Discussion/Obs Thread
Jns2183 replied to Voyager's topic in Upstate New York/Pennsylvania
I just saw multiple backhoes drive twords golf course Sent from my SM-S731U using Tapatalk -
Central PA Summer 2026 Discussion/Obs Thread
Jns2183 replied to Voyager's topic in Upstate New York/Pennsylvania
Did they give any idea when they might have fixed Sent from my SM-S731U using Tapatalk -
Central PA Summer 2026 Discussion/Obs Thread
Jns2183 replied to Voyager's topic in Upstate New York/Pennsylvania
I am thankful for the 70's. I have all my windows upon and got my house temp down to low 70's. They haven't seen to make a dent in the power outages near me so I'm assuming it's pretty much a complete collapse. Sent from my SM-S731U using Tapatalk -
Central PA Summer 2026 Discussion/Obs Thread
Jns2183 replied to Voyager's topic in Upstate New York/Pennsylvania
Thank you. I'm happy I got my brother to grab my daughter and the dog today. Sent from my SM-S731U using Tapatalk -
Central PA Summer 2026 Discussion/Obs Thread
Jns2183 replied to Voyager's topic in Upstate New York/Pennsylvania
I still think I may get a hotel for tomorrow night. I can only get no or crappy sleep for so long Sent from my SM-S731U using Tapatalk