Jns2183
-
Posts
4,747 -
Joined
-
Last visited
Content Type
Profiles
Blogs
Forums
American Weather
Media Demo
Store
Gallery
Everything posted by Jns2183
-
I’d trade my snow just to see canderson jackpot with 6” .
-
In my youth I was stupid enough to be out in Isabel. Nothing like seeing multiple trees go down within a couple minutes and have the realization that I’m multiple miles from home. .
-
I forgot about the front so when my dog barked in my face at 4am I choose just to take him for a walk. I knew I was screwed when it sounded like jet engines at the tops of trees. I did the whole walk in the middle of the road with large branches falling on sidewalks. It was definitely a walk I’ll remember. When the wind mixed down I had to lean into it to not be pushed over. Walk to remember .
-
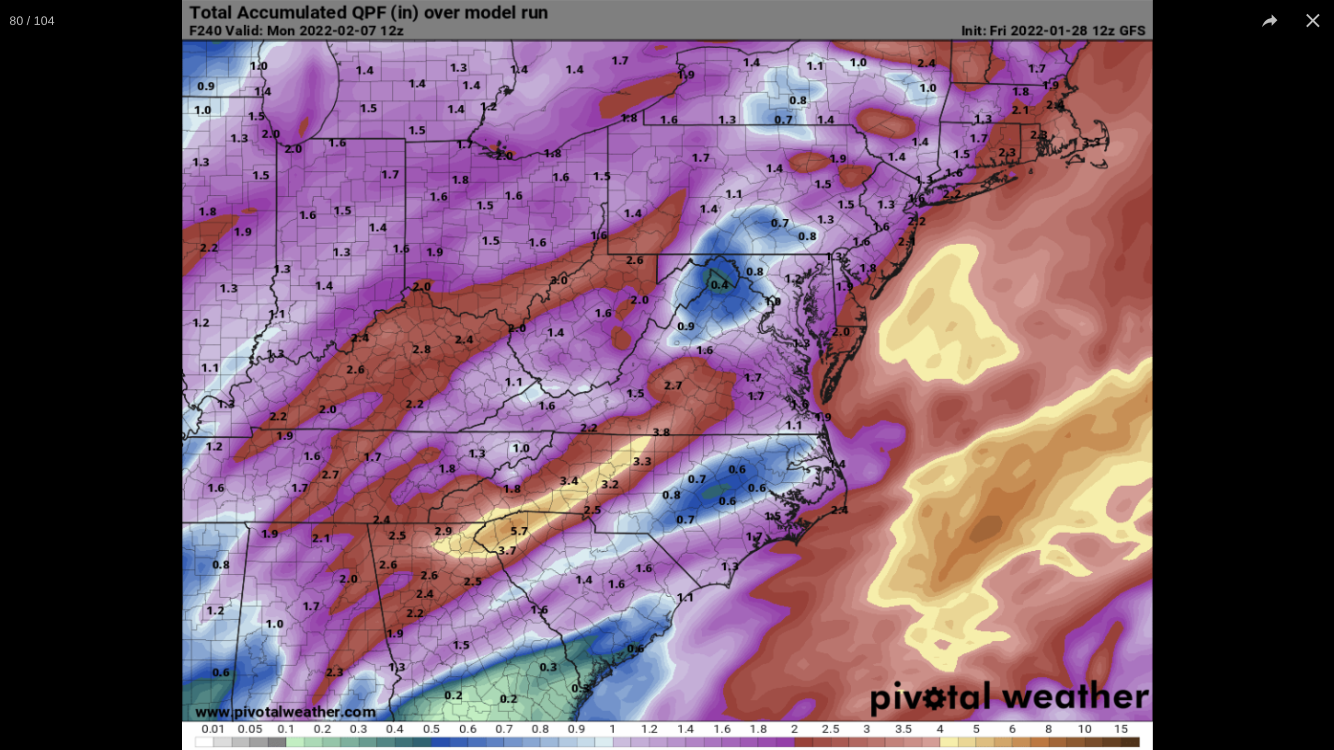
I posted the GFS QPF map hoping people would remember 5 days ago when I believe the GFS showed 30”+ of snow for the LSV. It’s apparent in this type of environment that outside of a few days those forecasts are trash and one has to actually do some meteorology to figure things out. I’d love someone to do a detail post on teleconnections for days 8-16 and take a risk. At worst the forecast will be no worse than the models and more likely those in here will learn some useful things. .
-
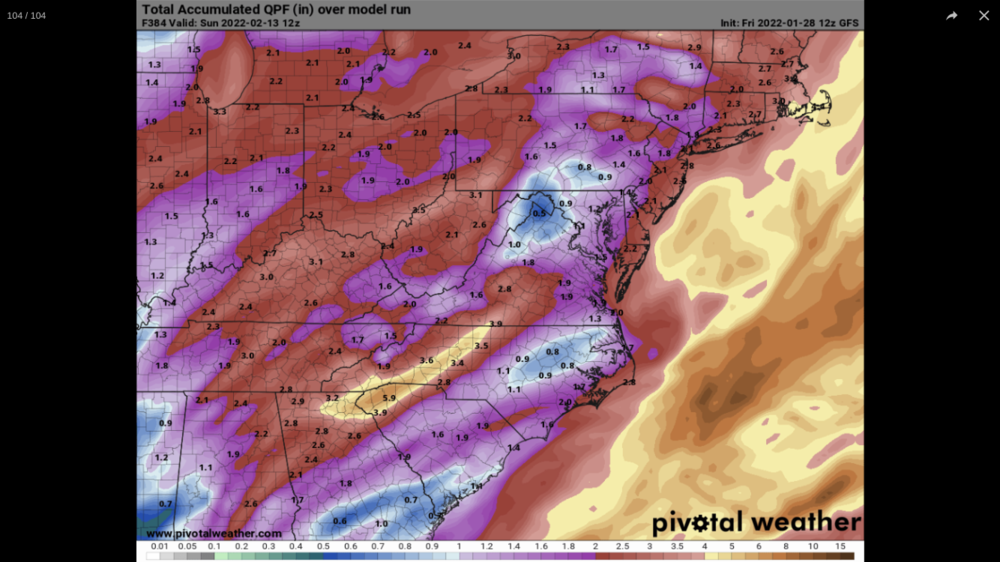
If that QPF map comes to be valid I’m sure we will see half of April be nothing but -6 temp departures and 6” of snow .
-
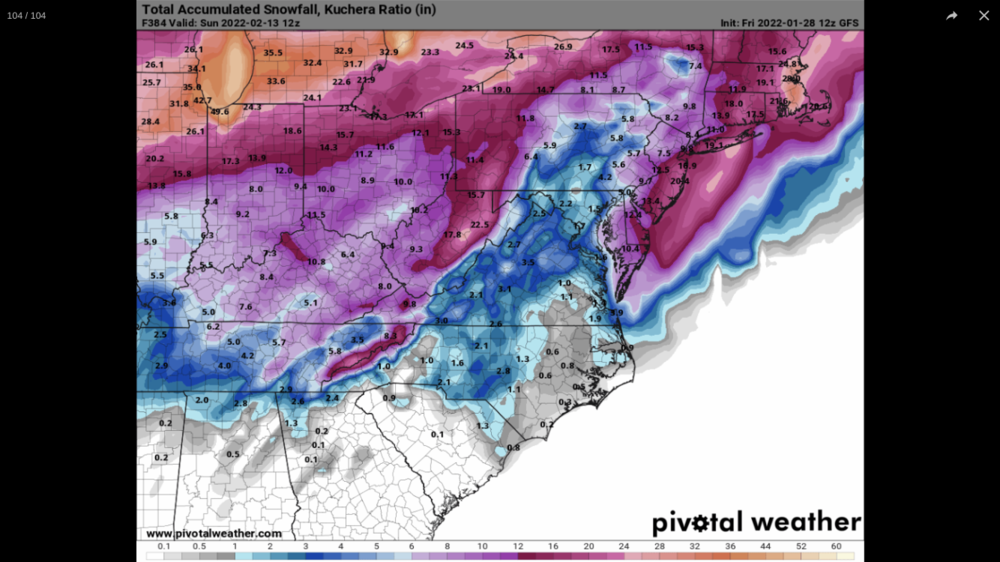
GFS 384hr QPF .
-
That would also give Boston another 42” of snow to add to there 37” January. That 79” would be too 10 all time with March to go. They only had 0.4” in November and December. Also it would add 23” to there snowpack as a positive change from today. Nothing like having a 36”+ snowpack in the middle of February. Although unless March and April blowup they aren’t touching there 108.9” record .
-
Can you provide a link to that? .
-
I believe the 1990s were a decade where this was semi common .
-
-
-

-
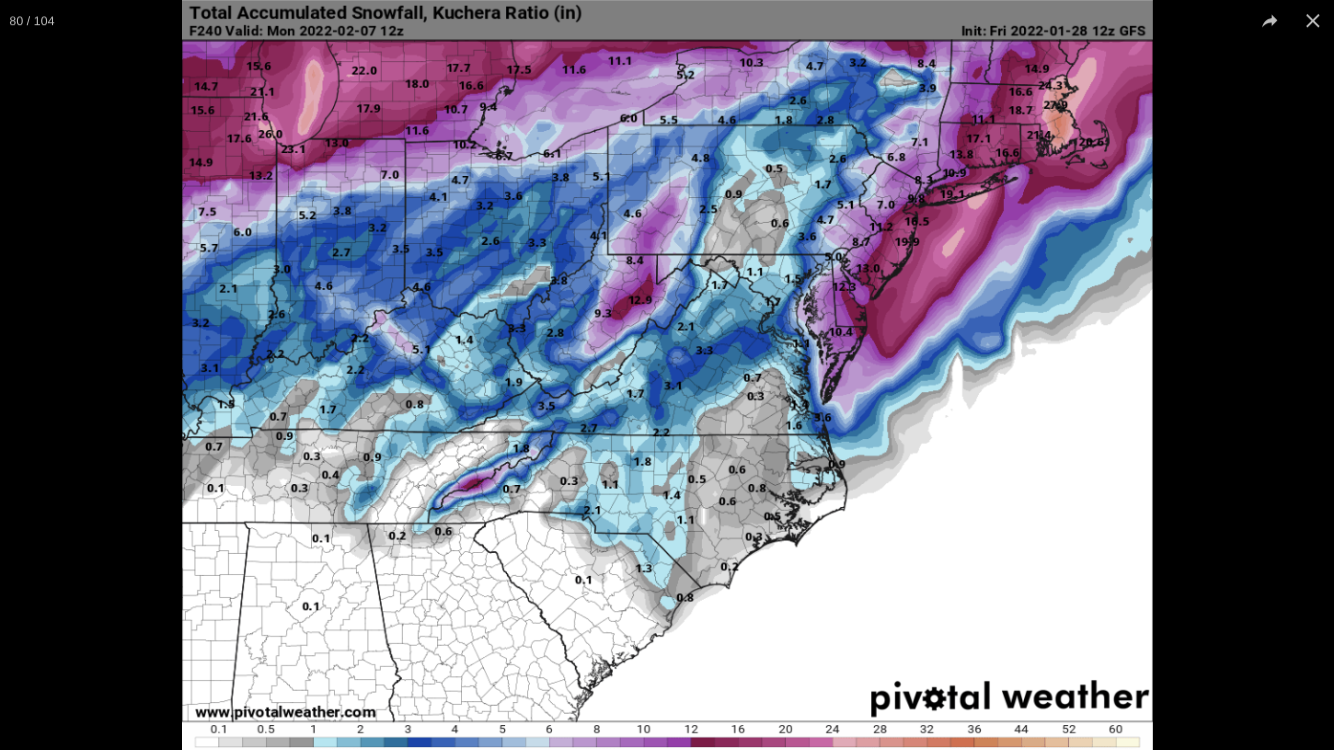
The 12Z GFS has the LSV as the epicenter of a dessert surrounded by lush snow beds. Here are the hr 240/384 QPF/Snow maps

-
You should pull up the map from the 1/6/16 thread and do a post showing the progression of CTP snowfall forecast maps from 3 days out till the middle of the storm. First time I ever saw a 36”+ area. I think that was when they first started using maps that had forecast, low end, high end. I remember that a day or so before their high end map showed only 24” I believe.
-
.
-
Anyone with more information regarding wind. Euro is throwing out guest to near 60mph for Harrisburg. If mixing is going to dislodge this cold then it’s going to bring the wind with it mixing it down. I don’t think you can have one without the other here.
-
With a forcast high of 60 let’s reflect upon the fact of how much more fun cold air damming will make our lives the next few months. .
-
Truthfully I thought that was an extremely detailed winter forecast. When you have average snowfall as low as we do and the fact that one major storm can account for 80%+ of snowfall and the fact of how hard it is to predict those storms even 72hours out let alone months I have considerably more respect for forecast as detailed as this. With the high variability in accumulations we have between storms and between +\- 25 miles of any location maybe the best way to judge forecast would be if they issued #of storms between an accumulation range (I.e 1-3,3-6,6-9,9-12,12-15,15-18) and there confidence percentage so that by taking the median multiplied by number by % percentage confidence they come up with snowfall. .
-
What’s up with the heavy drizzle all night .
-
https://www.pennlive.com/news/2021/09/winters-early-arrival-expected-in-pa.html .
-
I wonder how Millervillewx is doing? Anyone know if he got that transfer out of Lubbock yet? .
-
The ideal solution which is not expensive is to place 4 or 5 automated stations within a 10 mile radius of airport observations, and include their observations in a probabilistic model to come up with a 95% probability interval of actual temperatures within that radius which can expand outward based upon confidence in reporting stations for a larger square mile radius. But hell if I know how to communicate that with a public that doesn’t know mean or median. I can’t imagine an instant where any branch of government actually had the forward looking perspective and discipline to plan putting all weather stations in UHI due to my time working in what is arguably the most important government function, revenue. Incompetence is the rule that seems to be golden. .
-
I suspect things explode as line comes off mountain .
-
I have looked into how they determine model errors vs actual forecasts vs observed and god help you if you don’t have a strong background in statistics. I sorta understand it, and maybe could explain it when I have time to review my notes, but it is not intuitive. I suspect it’s more correct doing it how they do it, but I was hoping to find more localized analysis and that seems not possible unless you posses a login for noaa to access certain information .
-
That may shatter a few records .