-
Posts
2,348 -
Joined
-
Last visited
Content Type
Profiles
Blogs
Forums
American Weather
Media Demo
Store
Gallery
Everything posted by Jackstraw
-
If the Canuk verifies I swear I'm laying all my Loonies on it the rest of the year. It's done the best in my area 120 hrs out this winter all the way back to Halloween. Like most, the other models have waffled around here and it has too at times. But seriously, the Canuk has been pretty on within 5 days, and especially within 3 days for us in the south this year. Maybe moving forward the spirit of Neil is gonna make it even better with a Natural Science algorithm
-
Home Depot's Kitchen sink plumes just went through the roof for here on the 18Z runs, a majority on the on the kitchen side.
-

January 10th-12th Winter Storm Potential
Jackstraw replied to Thundersnow12's topic in Lakes/Ohio Valley
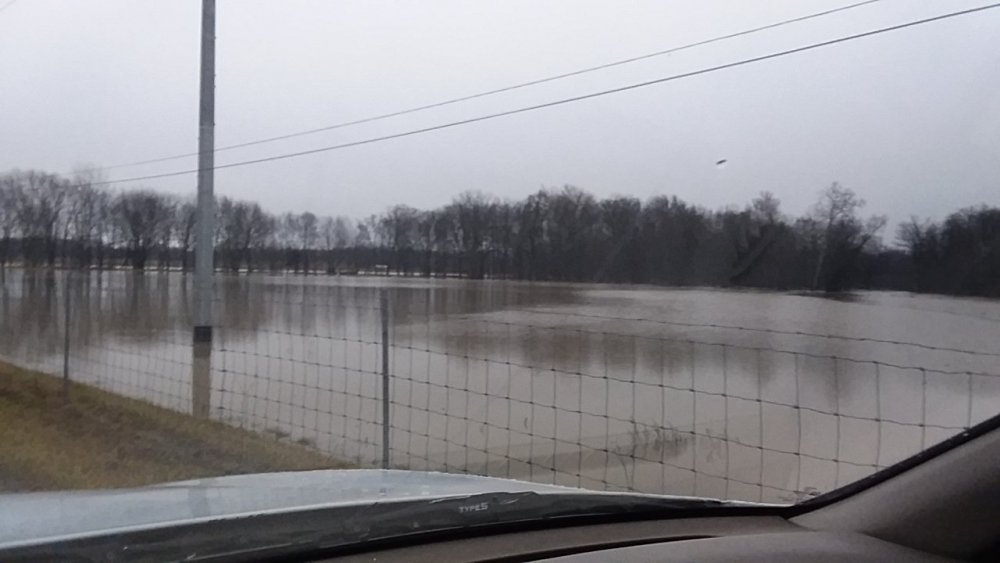
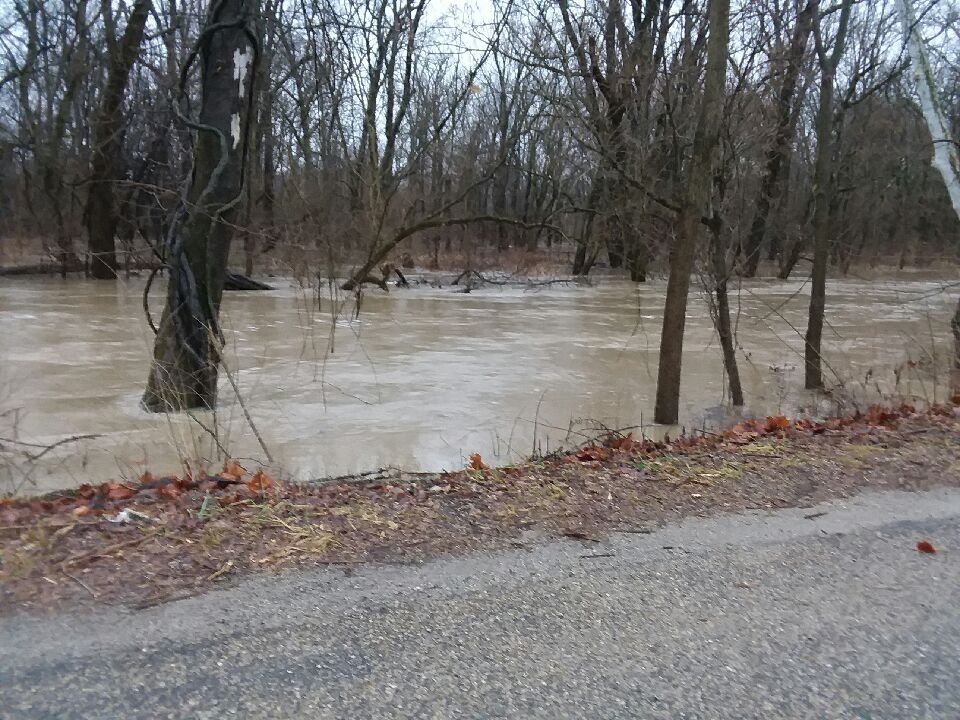
Was out an about today. Felt like it was 70 this morning lol. I'm certainly glad we didn't get the forecast 5-6 inches of rain. Ended up with a little over 2.5. The areas in the pics normally flood like this with 3-4 in a 48 hour period. If they flooded like this with 2.5 in 48 hours this area dodged a messy bullet...... -

January 10th-12th Winter Storm Potential
Jackstraw replied to Thundersnow12's topic in Lakes/Ohio Valley
Gonna be a bust here on a QPF point. Good 25 mph breeze gusting to 30-35, no rain at all. Ill take dry slotted liquid in January for 500 Alex lol. -

January 10th-12th Winter Storm Potential
Jackstraw replied to Thundersnow12's topic in Lakes/Ohio Valley
Had a break in the glacier water but radar says look out. I always take model QPF with a couple grains of salt but radar trends are concerning. Especially when the local NWS says the biblical rain is still 24 hrs away. Need this to shift north or south, don't care. When I start pooling water this fast on my property it's never good. Even last June it took 120hrs to get 6 inches. If we get another 4-5 as forecasted Fri. and Sat. this may be the worst I've seen it since moving here 7 years ago, at least locally. -

January 10th-12th Winter Storm Potential
Jackstraw replied to Thundersnow12's topic in Lakes/Ohio Valley
Been watching that too. A lot of it's tributaries have already gotten over an inch in the last 4-6 hours and the fire hose in SW MO is still pumping impulses NE. Ive got over an inch in my tippy bucket already. -

January 10th-12th Winter Storm Potential
Jackstraw replied to Thundersnow12's topic in Lakes/Ohio Valley
I'd gladly shovel this QPF down here your way so something constructive could be done with it instead of making frozen adobe lol -

January 10th-12th Winter Storm Potential
Jackstraw replied to Thundersnow12's topic in Lakes/Ohio Valley
If it wasn't 45 degrees out I'd swear it was a sultry July night outside. Constant rumbles of thunder, moderate steady rain. I didn't fall asleep in January did I? -

January 10th-12th Winter Storm Potential
Jackstraw replied to Thundersnow12's topic in Lakes/Ohio Valley
Well the game hasn't begun for you folks up north but us folks down here are getting the scuba gear out. The skies just opened up here and it is absolutely pouring. This is pretty impressive for January ..... -

January 10th-12th Winter Storm Potential
Jackstraw replied to Thundersnow12's topic in Lakes/Ohio Valley
Yeah forgot how loud thunder is in colder denser air. No ground strikes but certainly lit up the sky for about 10 minutes. Was never really in the game for frozen with this one (except 10 days out lol). Really not looking forward to 48 hours of deluge coming. Not to "rain" on those to the NW parade but I'm rooting for some big convection down south to put a big dent in the gulf flow. It takes forever to dry out when we get decent rain in the winter. -

January 10th-12th Winter Storm Potential
Jackstraw replied to Thundersnow12's topic in Lakes/Ohio Valley
Getting a nice (not!) chilly thundershower right now. My P&C is forecasting up to 4-6 inches of rain by Sat. evening. That's pretty crazy anytime of the year. -

January 10th-12th Winter Storm Potential
Jackstraw replied to Thundersnow12's topic in Lakes/Ohio Valley
Won't take much more to get IN/OH into low end severe potential. I'll take that over 4 inches of 40-50 degree rain. -

Autumn/Winter 2019-2020 Banter/Complaint Thread
Jackstraw replied to IWXwx's topic in Lakes/Ohio Valley
We have 4 big dogs and a mop by the back door. I think my feelings on mud have been expressed over the years. Seems to be a running theme the past few winters. Mushy mud during the day then frozen boot piercing stalagmites at night. -

Autumn/Winter 2019-2020 Banter/Complaint Thread
Jackstraw replied to IWXwx's topic in Lakes/Ohio Valley
Guess theres enough of us weather nerds to support a movie being made. Wasn't to bad actually... https://smile.amazon.com/gp/video/detail/B0812BZF9D/ref=atv_hm_hom_1_c_ZWyNDQ_0YgTDE_1_1 -
Got another 3 for a storm total of 7.5. I'll take it we may not see snow around here for another month lol
-

Winter 2019-20 Medium/Long Range Discussion
Jackstraw replied to Hoosier's topic in Lakes/Ohio Valley
It's still snowing here -
Didnt last long maybe got another inch but it just lit up again an hour ago. Was hoping for a nice defo or trowal but this thing seems to be getting moisture starved this far west Forcing is there just nothing to work with I guess.
-
Lol and just as I posted that I looked out the window and its ripping out of the blue. I'll post every 5 min till we get a Bo worthy 20 lol
-
Well I know this event wasn't a big deal to our friends to the North but us down here in the hinterlands are enjoying it. A lot of winters it takes us a 4 incher and 3 clippers to hit a single storm total for the I80 crew lol. Been battling dry air again around here as the moisture slowly tries to re- build N. Think an additional 2-3 is definitely possible.
-
KIND upped to WSW with now expected storm totals of 5-9 inches.
-
Up over 4 here. Back to finer dendrites but still coming at a good clip. Points north reporting 4.5 to 5 just noticed KIWX issued a WWA. Now the 00Z models are hinting at another 4-6 possible tomorrow evening into Tues. along I70. Throw another 4 on top of what I have and I'm happy till Friday lol.
-
Think the Canuk pulled a coup at least with this first wave and distribution. See how the defo sets up tomorrow evening. Thats going to be the icing or the burnt crispys on the cake lol
-
Just came back in from a ride. 3 here and still going. Yep theyre a mess. Ill never understand why they plow all the way to the freezing pavement, expose liquid water to sub freezing air, and take away 2 or 3 inches of snow you can use for traction (for that matter 4 or 5) Geez leave me some snow to grab
-
Starting to really pick up here. Medium to fine dendrites but lots with a light SE breeze. That stronger band that was in S IN is just south. Guessing 1/2 inch in the last 30 - 45 min.
-
Looking back into IL think parts of KLOT and KIWX areas could get a bit of a surprise by early am. Only issue right now is dry air but that seems to be slowly eroding. Just started dropping some floaters here.


