
Ginx snewx
-
Posts
105,747 -
Joined
-
Last visited
Content Type
Profiles
Blogs
Forums
American Weather
Media Demo
Store
Gallery
Posts posted by Ginx snewx
-
-
2 hours ago, mreaves said:
Is that where the ski area is too?
Nope that's in Exeter RI. Ski school there from age 7 to 9
-
 1
1
-
-
3 minutes ago, Layman said:
This camp?
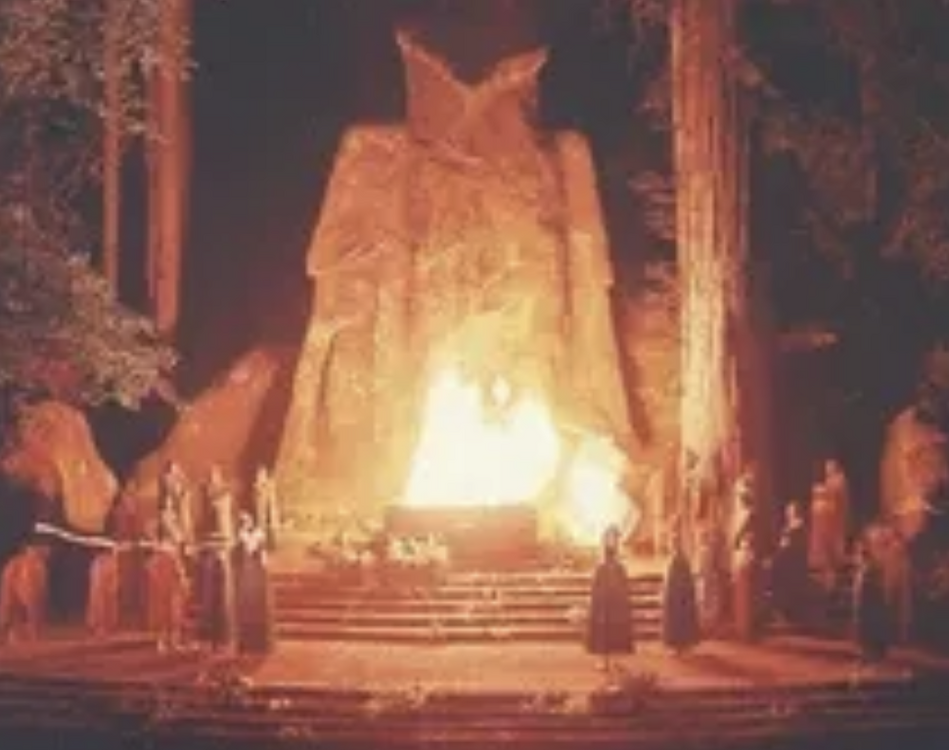
Meth kills bro
-
Just now, Brian5671 said:
yep-another year to go here...crazy how fast it all goes
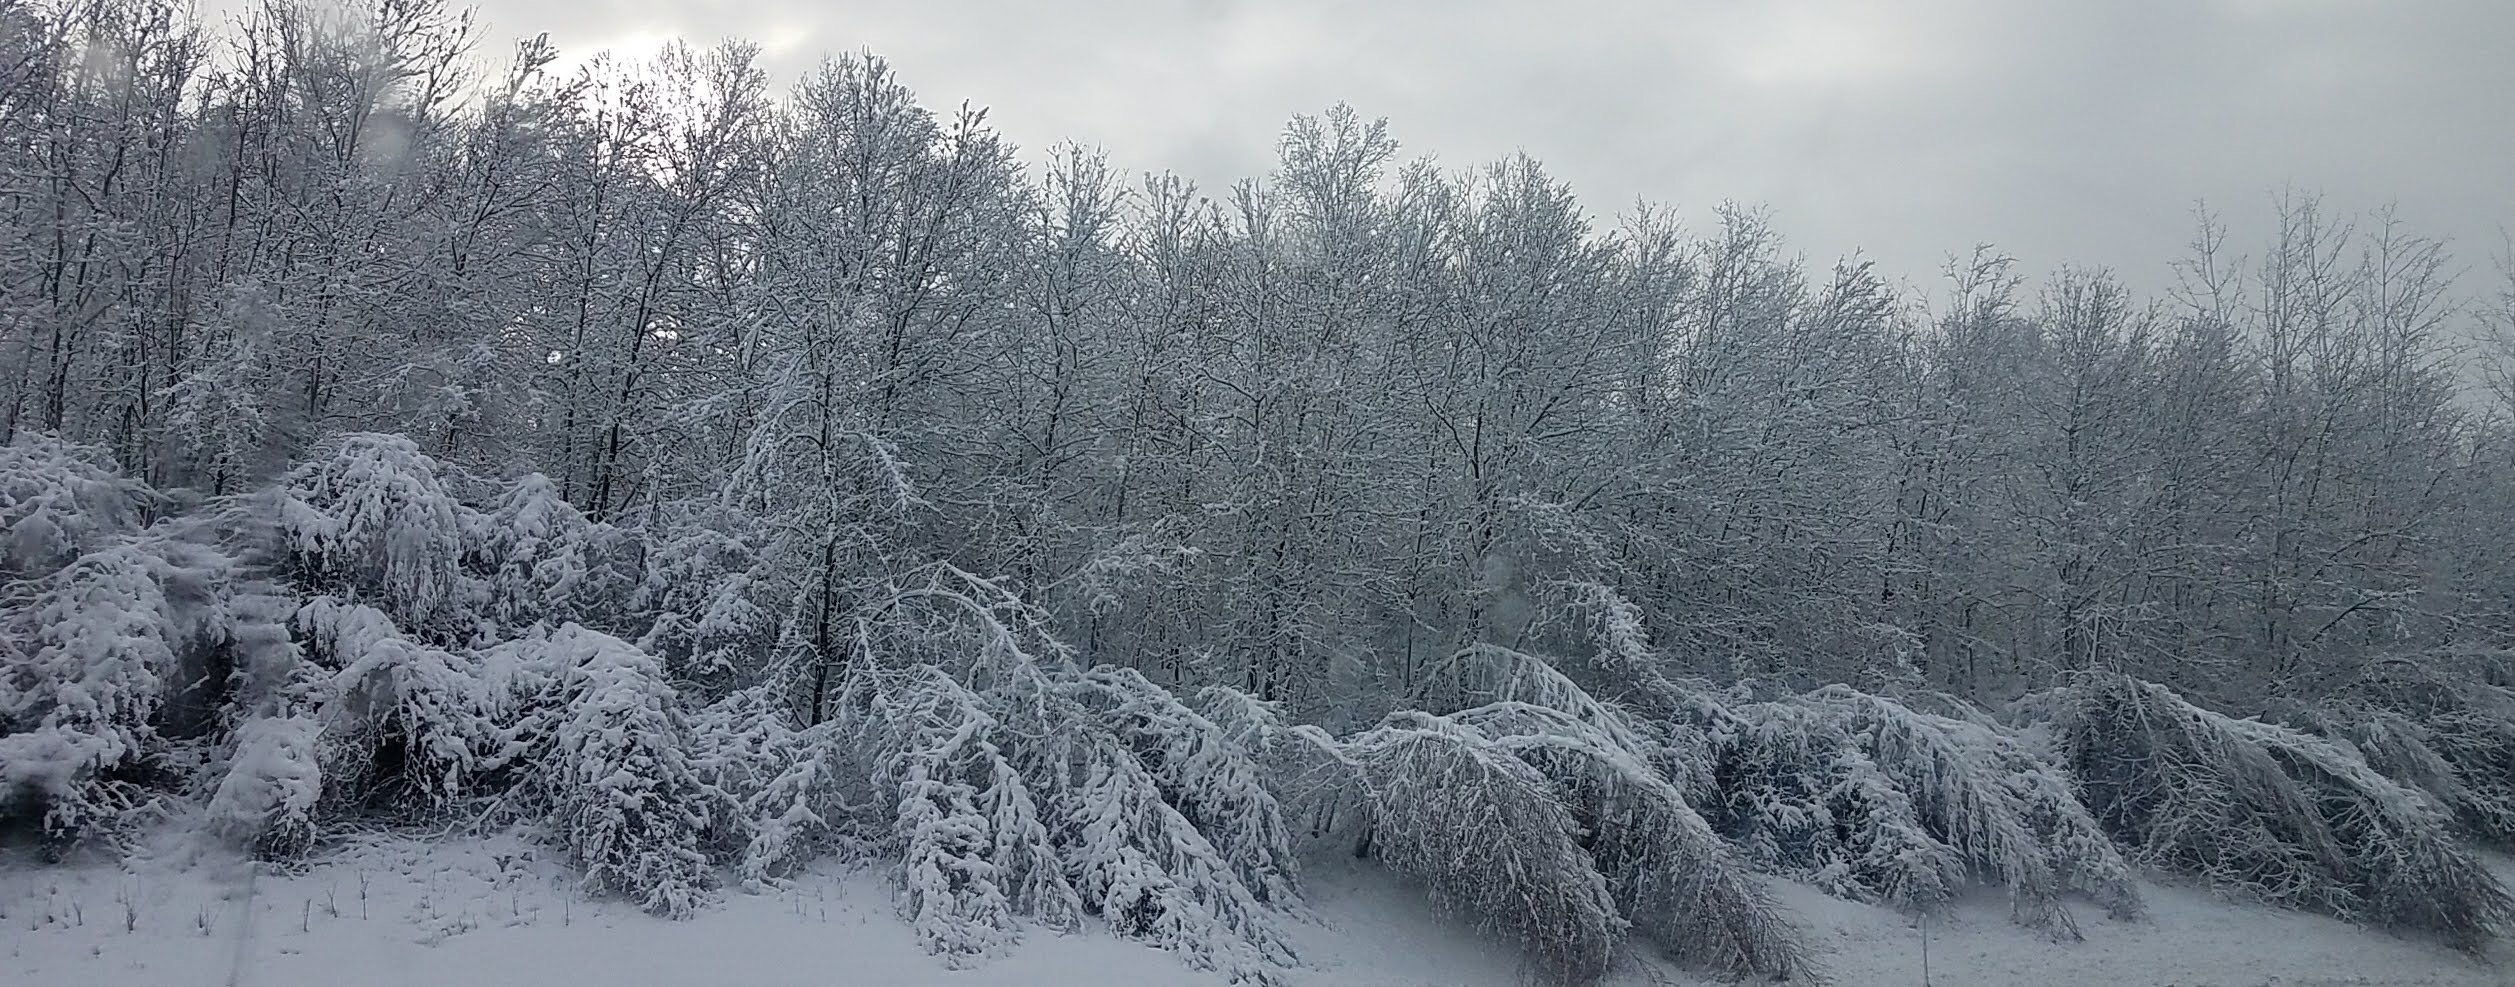
Although I probably have driven through most of New England during my heavy youth skiing days. I have been exploring every time I can. Honestly think we are in the most beautiful varied place on the East coast with the best 4 seasons anywhere
-
2
-
-
2 minutes ago, Damage In Tolland said:
Did you attend as a young boy/camper/scout?
Nope I grew up down there and partied at the camp off season. Gorgeous huge property
-
5 minutes ago, CoastalWx said:
The beaches maybe. Not that part of
Happens to married people with kids. Once they grow up extend your wings and visit all of New England. You are missing perhaps one of the best places to live in New England. Beautiful forests hills lakes rivers and in 7 minutes playing in a fantastic ocean
-
49 minutes ago, Damage In Tolland said:
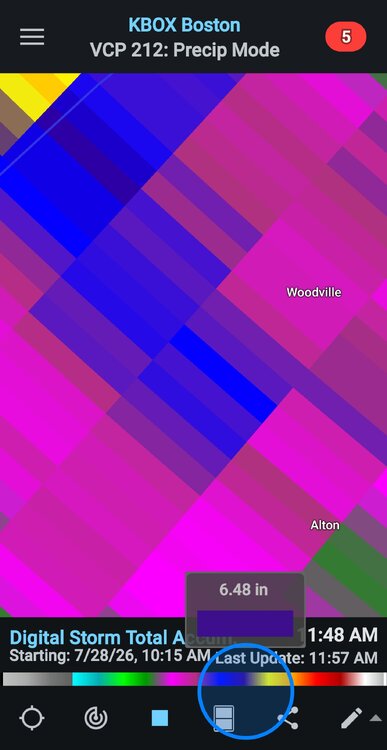
6.09” just this morning in Yawgoog ,RI that no one has ever heard of ( even people that live there)
If you were a boy scout you know the largest boy scout camp in New England is in Yawgoog.
-
1
-
-
16 minutes ago, CoastalWx said:
There's about 3 ppl that live there. That was the area Ginxy was yelling at the NWS about back in 2010 when there was a flood. Remember the Pawcatuck!
You do realize that area population swells in the summer just like the Cape. You have zero clue. That happens to people who go to the exact same safe places for vacation year after year. I guarantee you have never been there.
-
Not sad to be slotted
-
1
-
 1
1
-
-
-
3 minutes ago, weatherwiz said:
Now you have me craving that. Haven't had one of those in a while.
Cut the size double the price. Now garbage
-
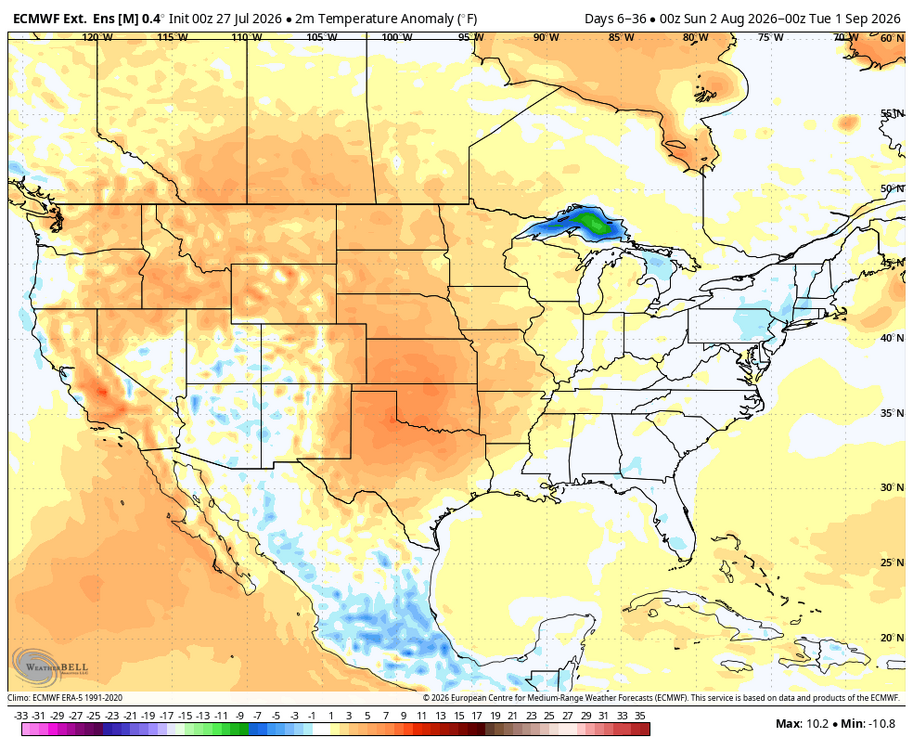
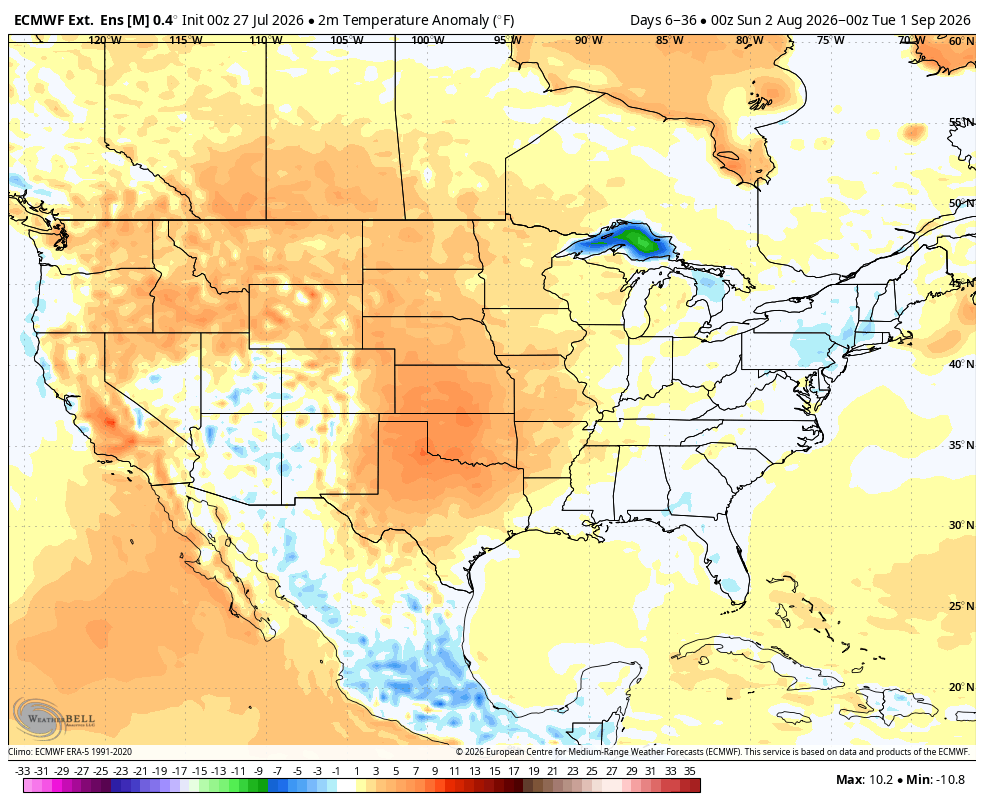
1 hour ago, forkyfork said:
here is what a super nino july is supposed to look like

Remember in 2012 when you said we would never see a BN summer month again?
-
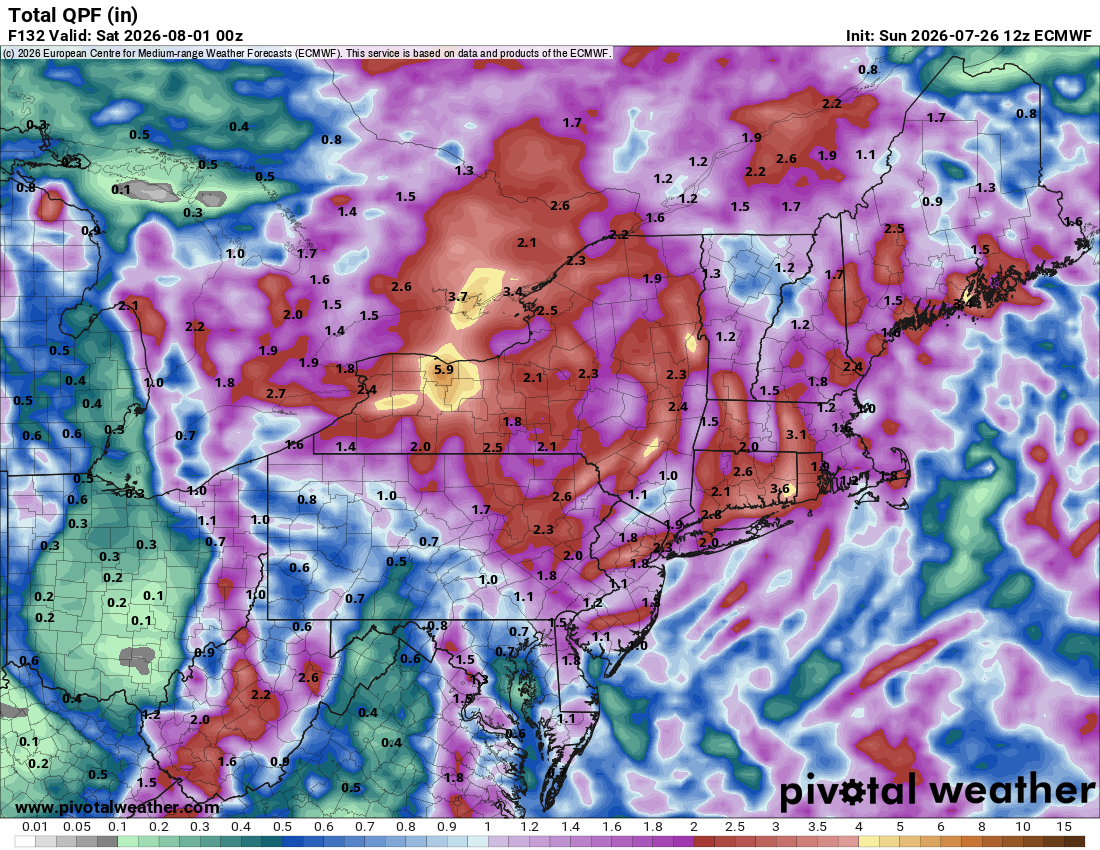
2 minutes ago, Damage In Tolland said:
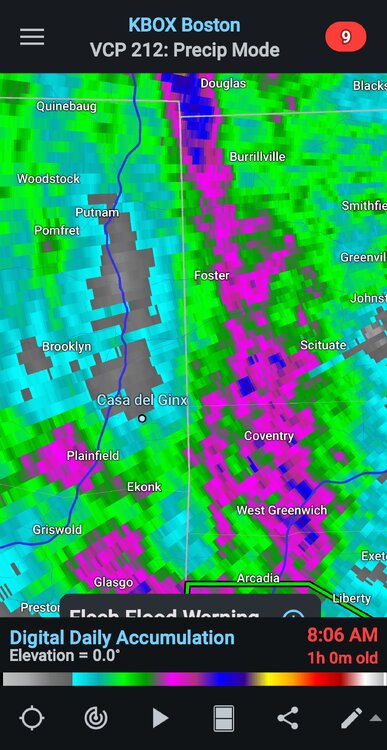
Just a pummeling east of Albany still ongoing . 12-15”?
I see some 9 to 10 2 day totals on WUnderground
-
7 minutes ago, SouthCoastMA said:
I hate that term, but what's that, like 2 people?
Dumb term for anyone who disagrees with the narrative Tip has.
-
15 minutes ago, Damage In Tolland said:
Summers of yore . Now we summer of bore
Yore is 3 years ago?. You know what average means right?
-
 1
1
-
-
Just now, BrianW said:
BDR is 2nd wettest July. Record is 12.84 July 71.
.thumb.png.ab466567c9c50a3d67a695cf55a6a3c7.png)
How about since May 1
-
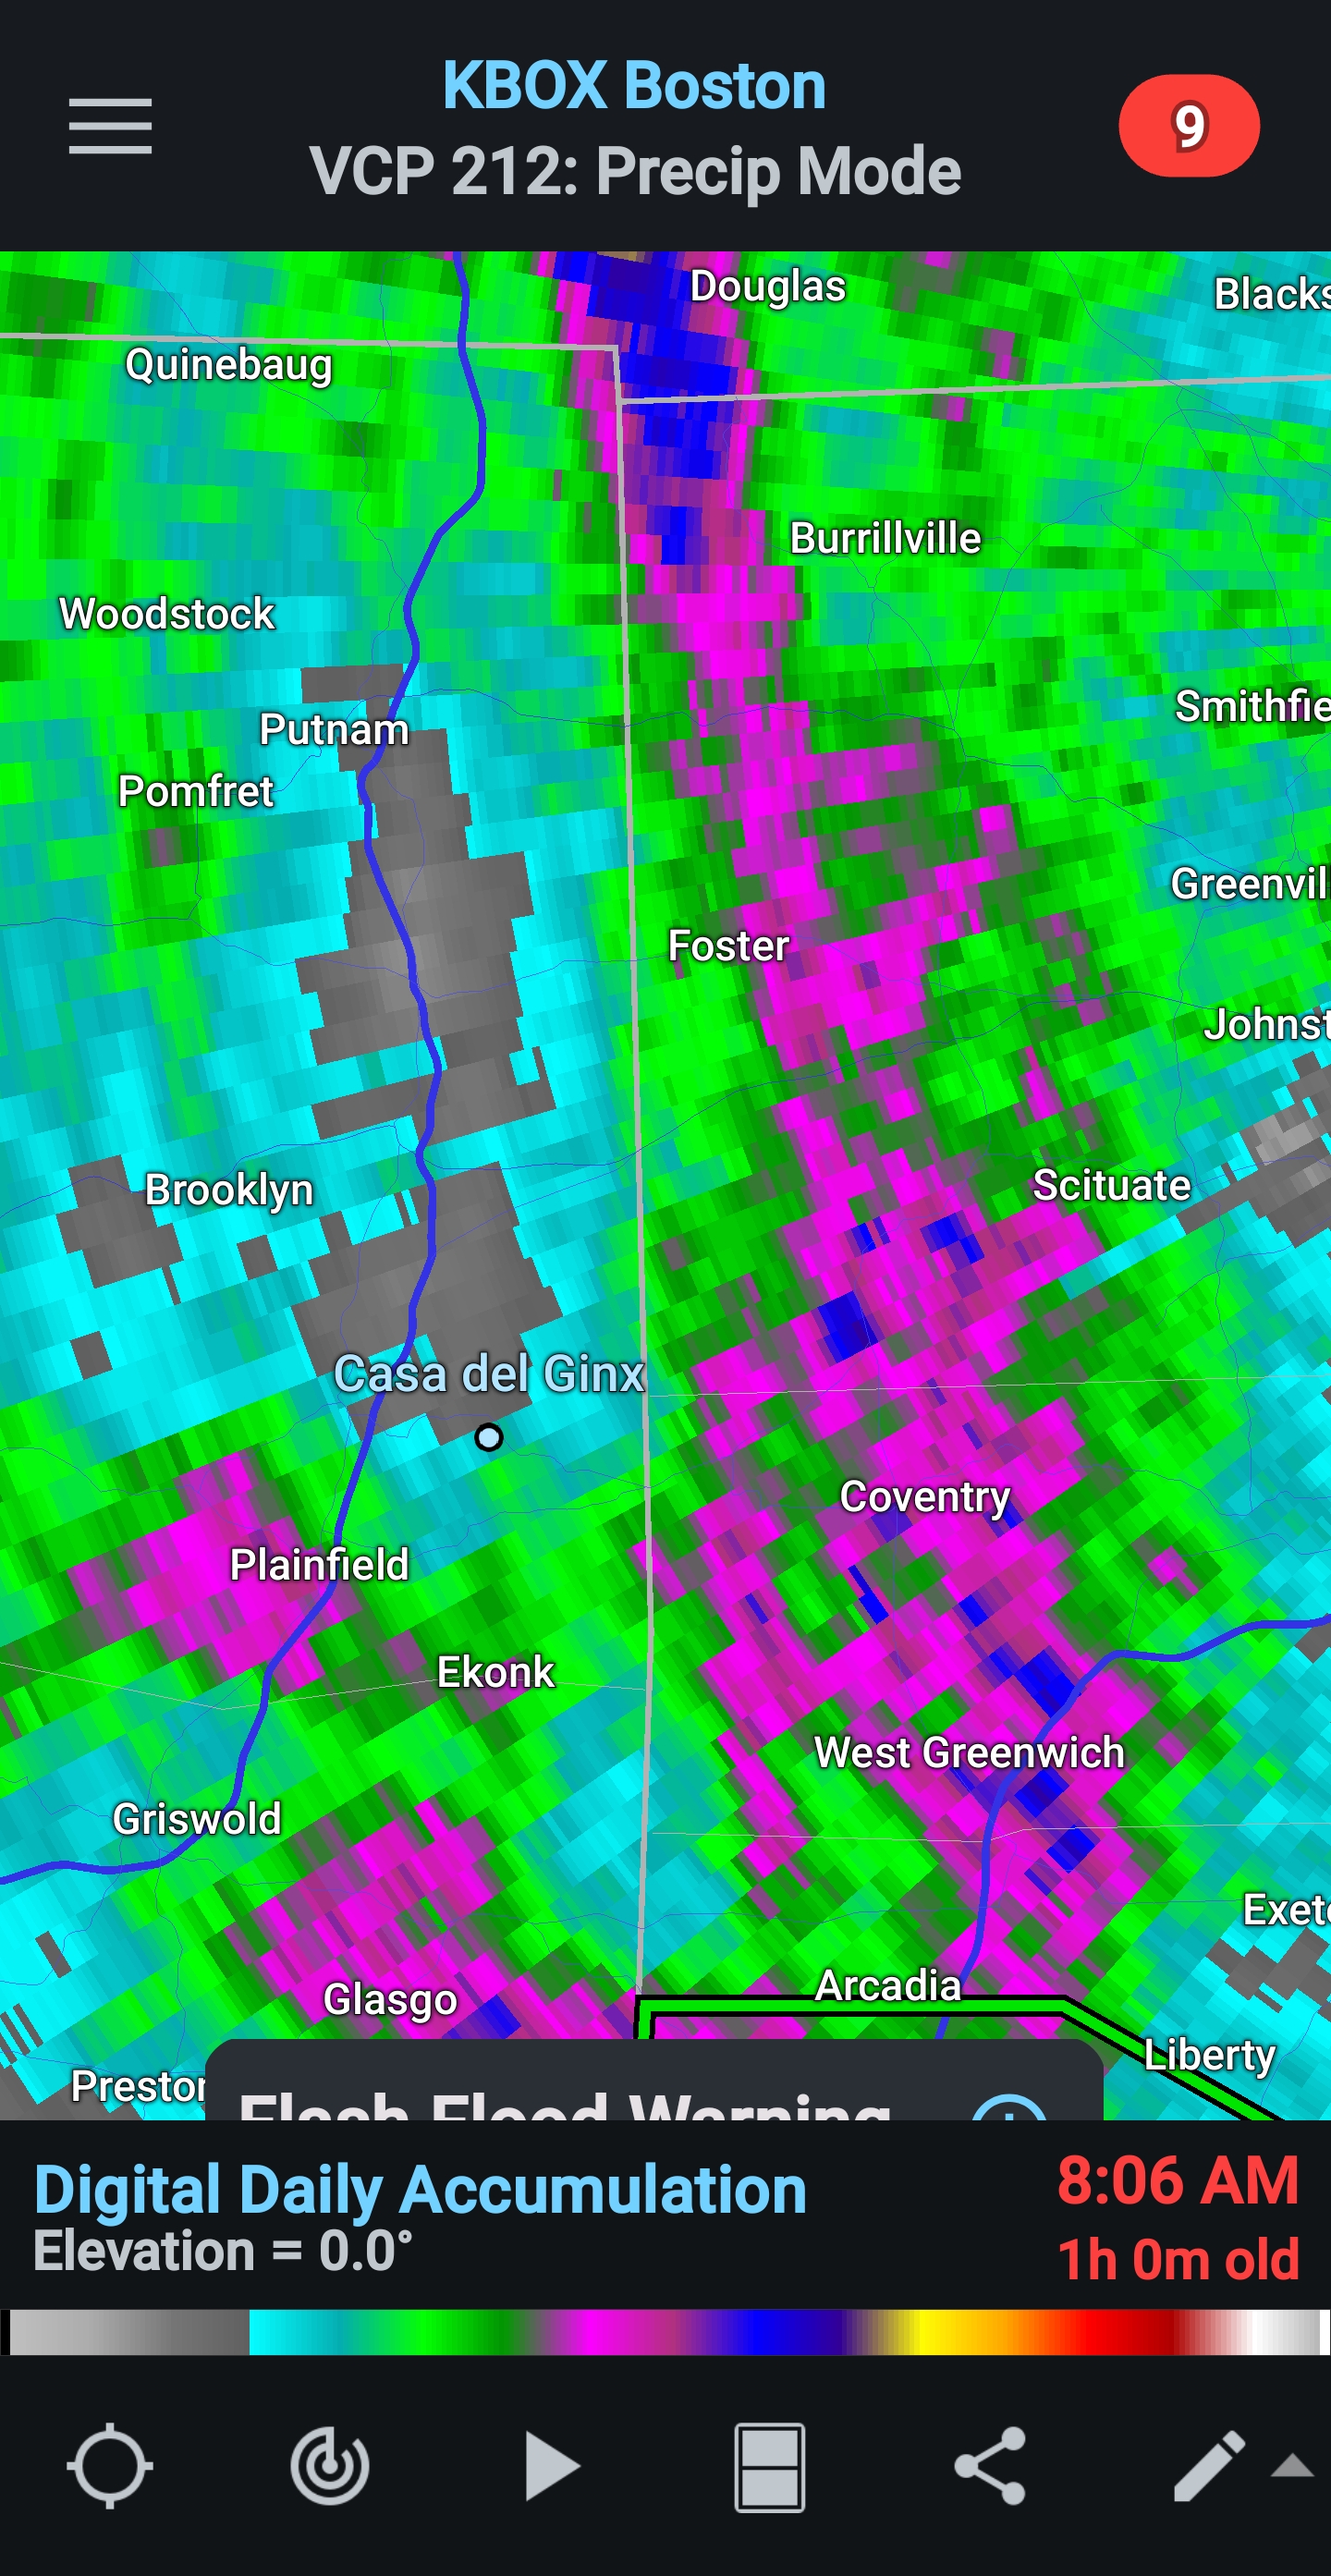
12 minutes ago, Modfan2 said:
Looks like E CT/RI going to be slotted soon, congrats SE Mass?
With 15 plus inches since the middle of May, good. It's plenty lush enough and wells are full
-
2 hours ago, Sey-Mour Snow said:
2.57" good drink.. 15.33" on the month..
Holy shit are we talking record July down there? Squitos must be brutal
-
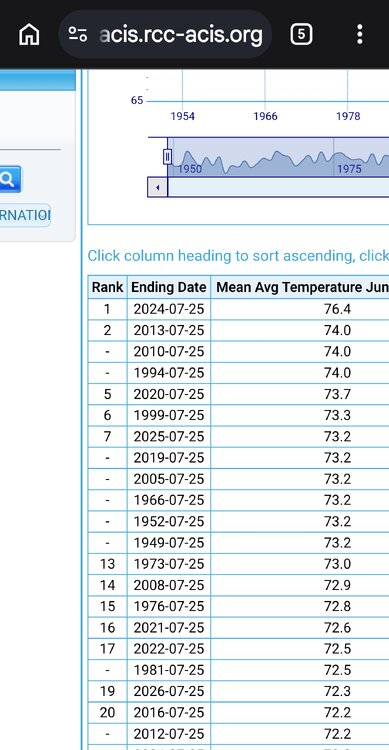
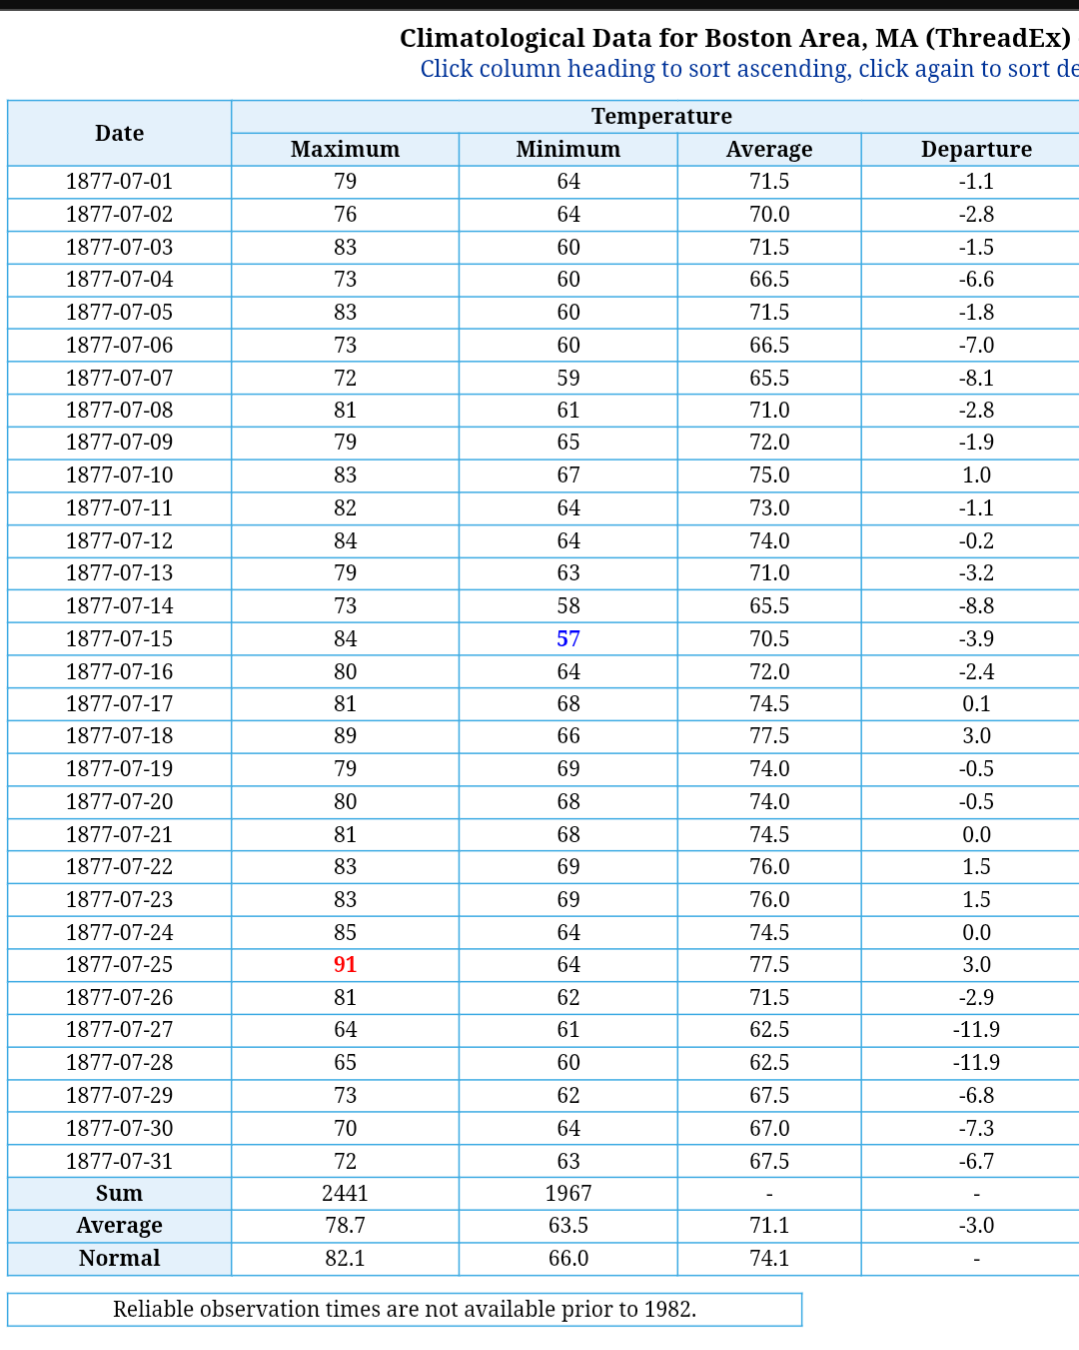
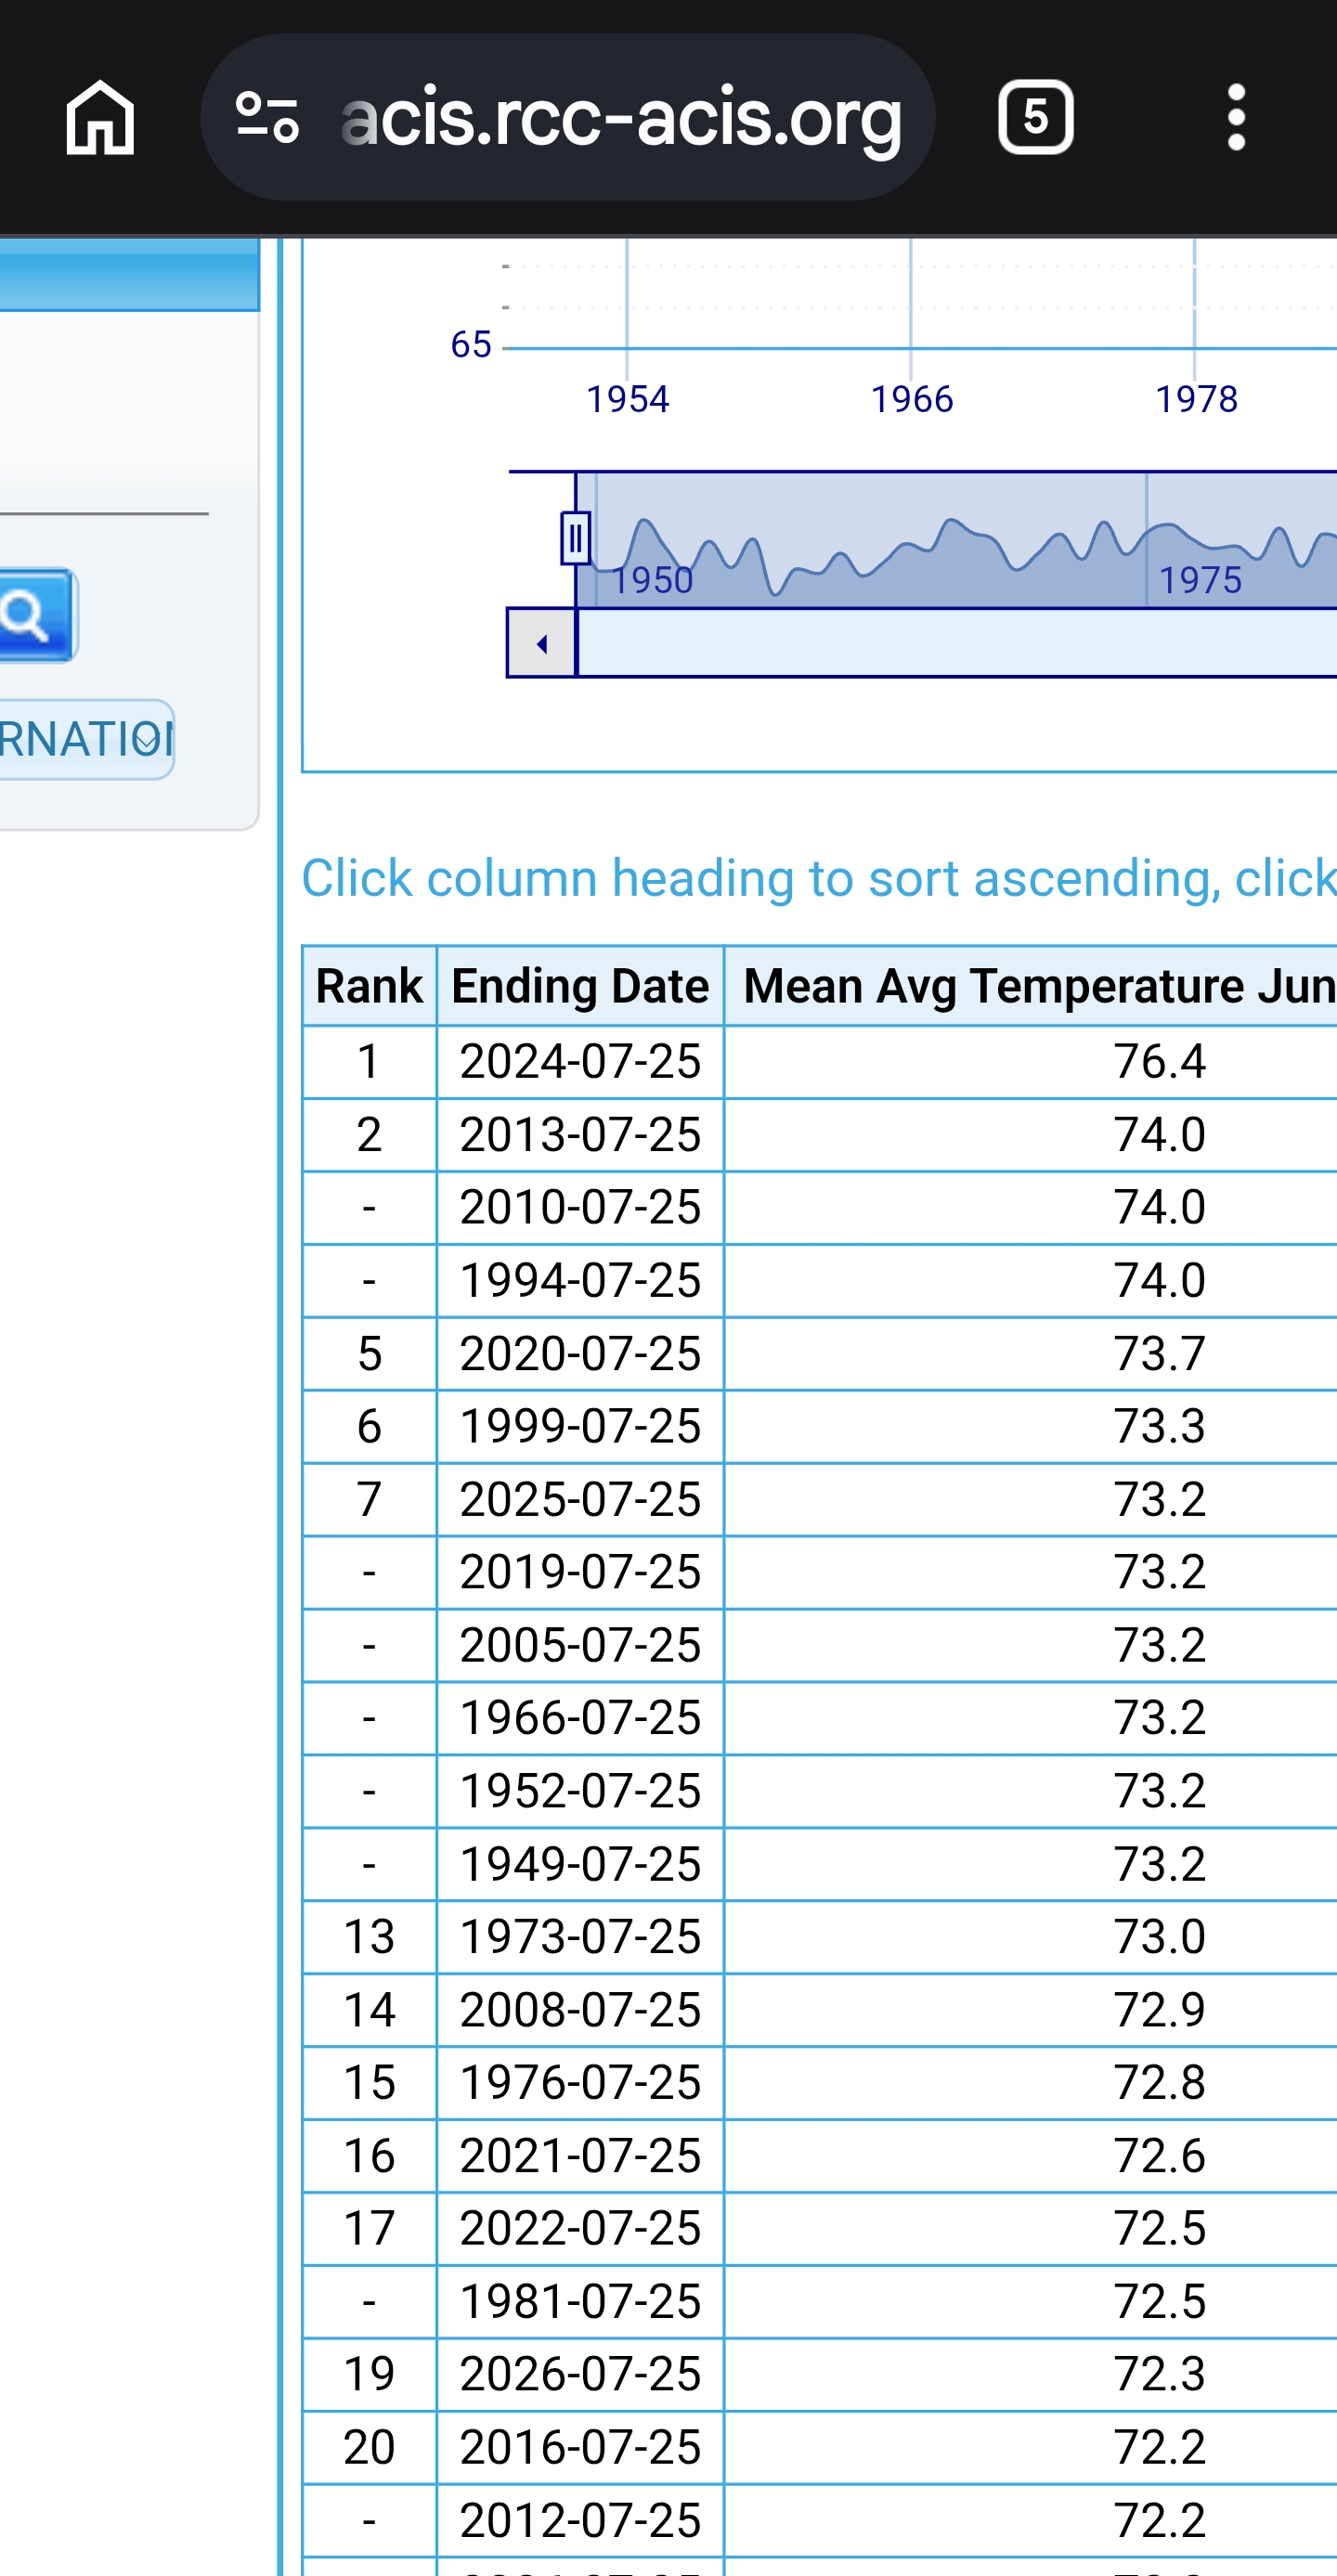
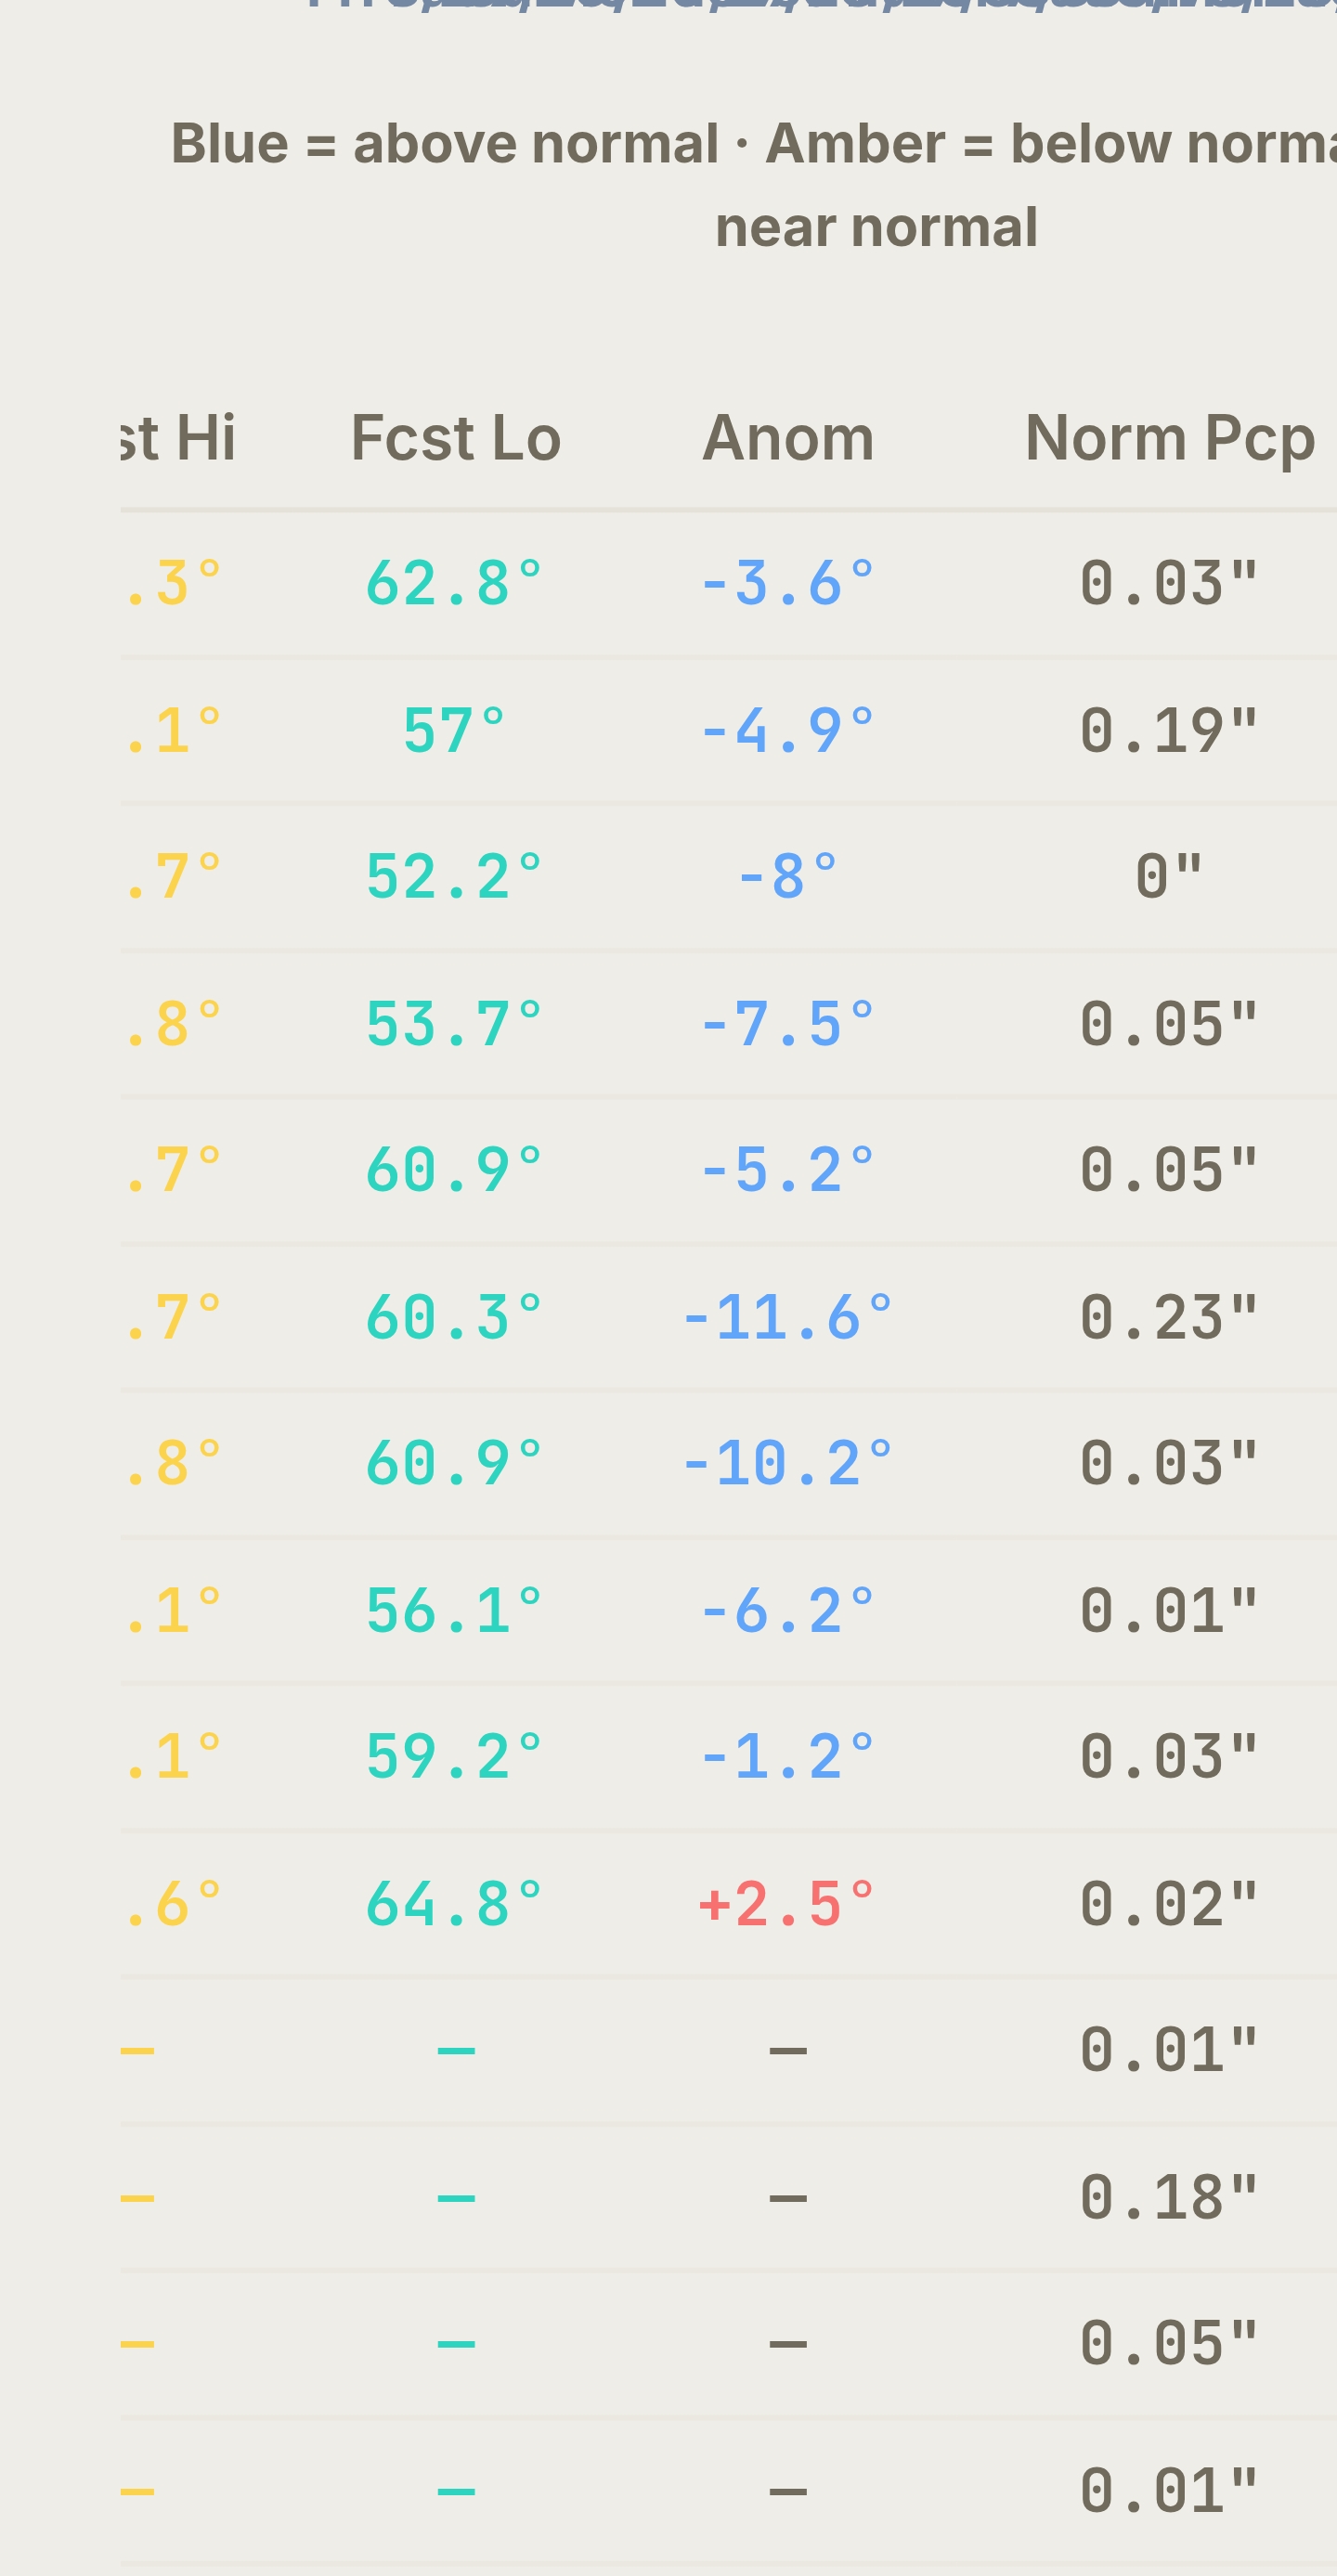
So much for the HHH hottest summer ever Top5! Weeklies BDL
-
1
-
 1
1
-
2
-
-
1 minute ago, CoastalWx said:
Some good analysis in this thread.


Noah comes
-
-
Hottest summer ever Hammer?

-
1
-
 1
1
-
-
-
27 minutes ago, kdxken said:
We were trying to tell 'em for weeks but they just wouldn't listen. Smh...
Of course Kev would never post this HammerTime, as he calls Ryan, tweet. Objectively is not his forte instead he goes right to personal insults.
-
1
-
1
-
 1
1
-
-
15 hours ago, Torch Tiger said:
OT but heard this on AM radio today. banger with the sax. minor hit
Nice cept for Autotune


.png.5f1375f5b0847bd3be40923ee928af8c.png)
Augdewst 2026: Summer's Last Stand
in New England
Posted
Need help with the harvest?