dendrite
-
Posts
75,095 -
Joined
Content Type
Profiles
Blogs
Forums
American Weather
Media Demo
Store
Gallery
Everything posted by dendrite
-
Early confusion
-
I’ll take the rain though.
-
00z 3k nam nailed that diving south into C NY.
-
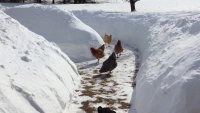
Yup. Lots of them here.
-
lol what is the euro doing in nyc. Congrats metfan and enjoy. concrete jungle!


-
1 run loss! Devers with the GW RBI!
-
I’ll take the under on 96°
-
MEX is starting to pop some 100s up here Tue. Gfs ends the week with 50s and rain Thu/Fri. Currently 54.4°
-
80% of us basically have natural immunity. https://www.rockefeller.edu/news/34384-an-immune-flaw-may-cause-west-nile-viruss-deadliest-symptoms/
-
Temps or dews?
-
I guess we’ll see
-
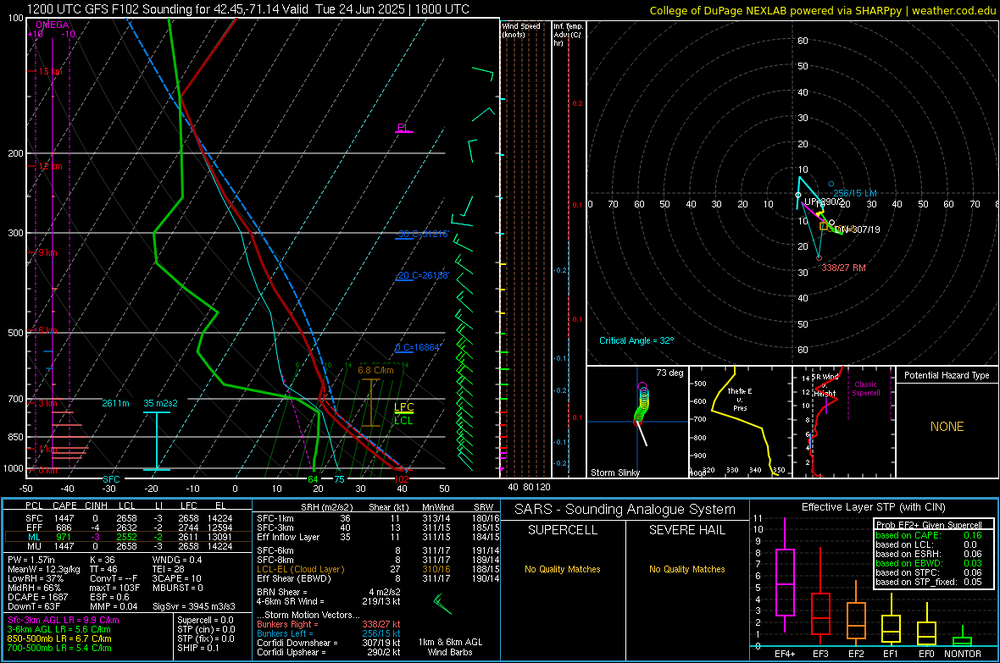
GFS mixes up to almost H7 with only 15-20kt wind up to 600mb. Idk…seems a little overdone as usual to me.
-
Not sure…there’s a seabreeze threat Monday, but that shouldn’t affect the interior much. I’m still on the 97-99 with 70s dews train unless I see more widespread 850s around 24C. MEX has been consistently 95-98 in the hot spots Tue. I want to see something more exotic aloft. I’ve seen these 2m shenanigans before.
-
https://nutwizard.com
-
Euro has almost all of NYC and interior LI at 107° Tue. It looks overdone to me given the 850s. Looks like a lot of MU90s with a hundy here and there.
-
They call that “storm chasing”
-
Can’t wait to watch that fail in storm threats all winter. I’m sure it will nail a 1040mb high within 0.1mb though.
-
Serious Scoot this morning
-
I think he meant early fall. Late fall is the 50+ mins.
-
The dewpoint?
-
Max 88.4° We are now installed. Only 2 people perished during the installation.
-
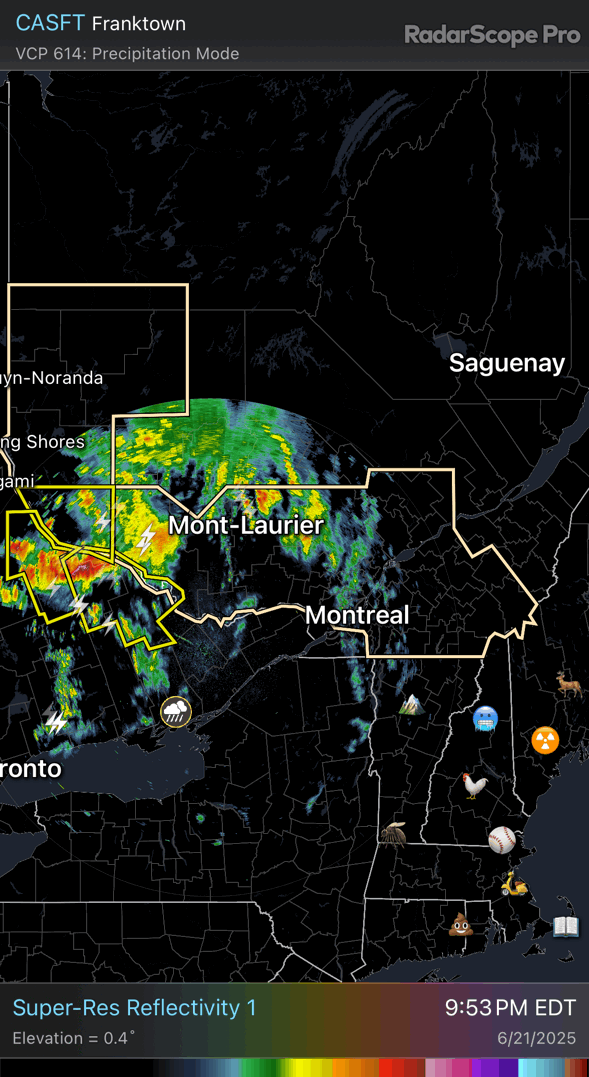
Decent hail just north of here heading toward New Hampton and Sanbornton. Just had a loud crack of thunder…not sure if it was a +CG.
-
87.7/69 Pretty awesome out.
-
Knew it didn’t read well, but figured I could avoid a sick joke involving my 72 y/o MIL. Apparently not.