dendrite
-
Posts
75,052 -
Joined
Content Type
Profiles
Blogs
Forums
American Weather
Media Demo
Store
Gallery
Everything posted by dendrite
-
 lol
lol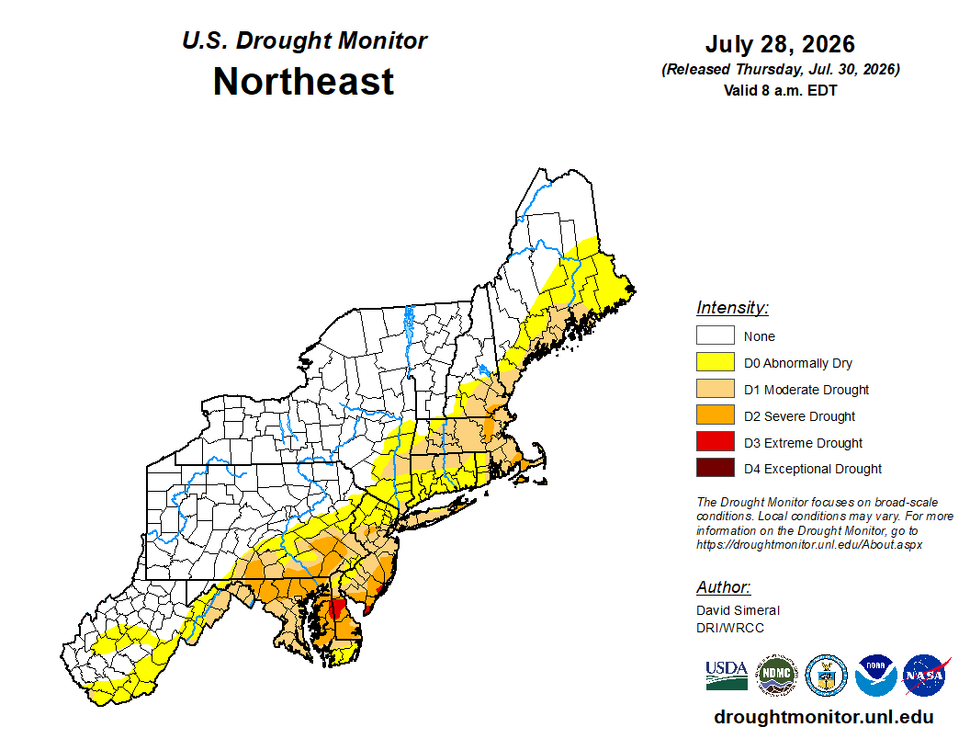
-
This makes me laugh everytime I view it…should be even better when it updates later this morning.

-
He literally “aww shucksed” it while watching his roof blow off and telephone poles snap.
-
That’s pretty good. Pretty sure you’d be safe in the bunker of your basement with your wife comforting you based on the lightning vid you posted.
-
Yeah. I’m sure we’ll oversaturate the soil when the plants finally go dormant. 4” down is pretty dry here…around 40cb. It barely budged from this event.
-
Terrible. 1.28” for July here.
-
Not a drop since sunset. 0.39”
-
May have to ban everyone
-
No water to boil them

-
I’m like the girl on the couch with 5 ‘s standing behind it waiting
-
Rainfall circle jerk in here
-
Up to 0.10” in 24hrs here Radar kinda looks like shat
-
Well we’ll obviously keep getting some below normal months if we move the goalposts every 10 yrs. It would be BN if we used Jurassic period norms.
-
They’d be +1.5F with the old normals
-
Not my station, but 0.01” here too. Just a hundredth feels like a deluge. I’m 4…not 154.
-
Hopefully the McDonalds wizzy eats his filet o’fish at in Troy is underwater.
-
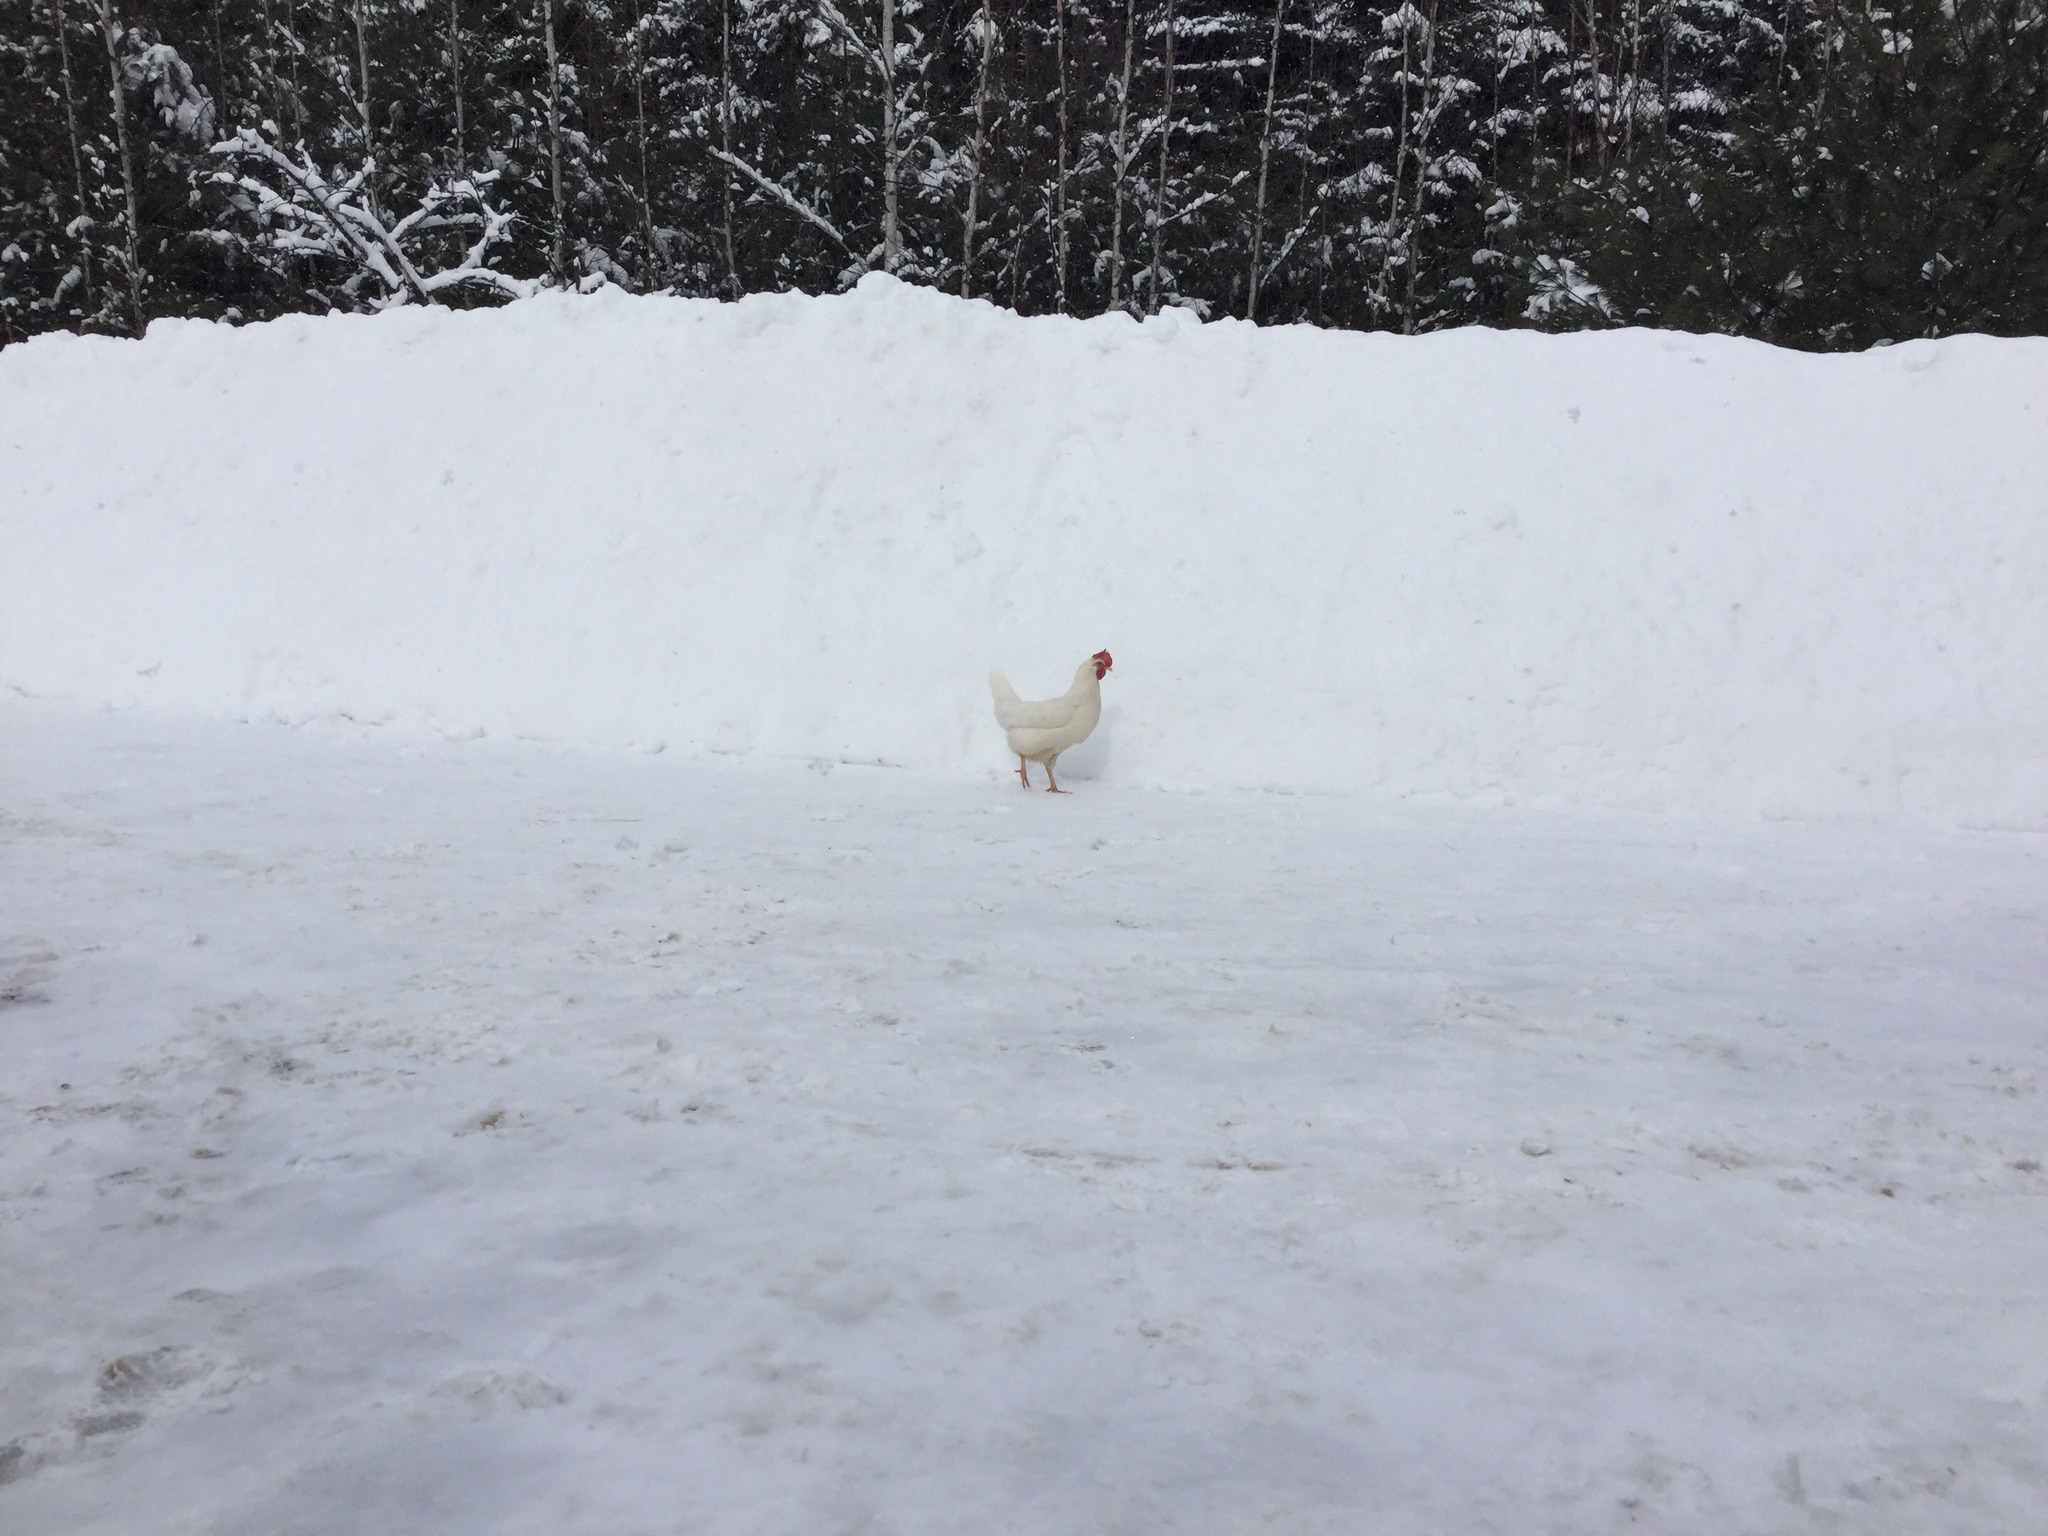
I have a virga storm in July. I feel like I live in Littleton.
-
Probably not a good sign. Just noticed dews plummeted.
-
Actually it isn’t. Virga.
-
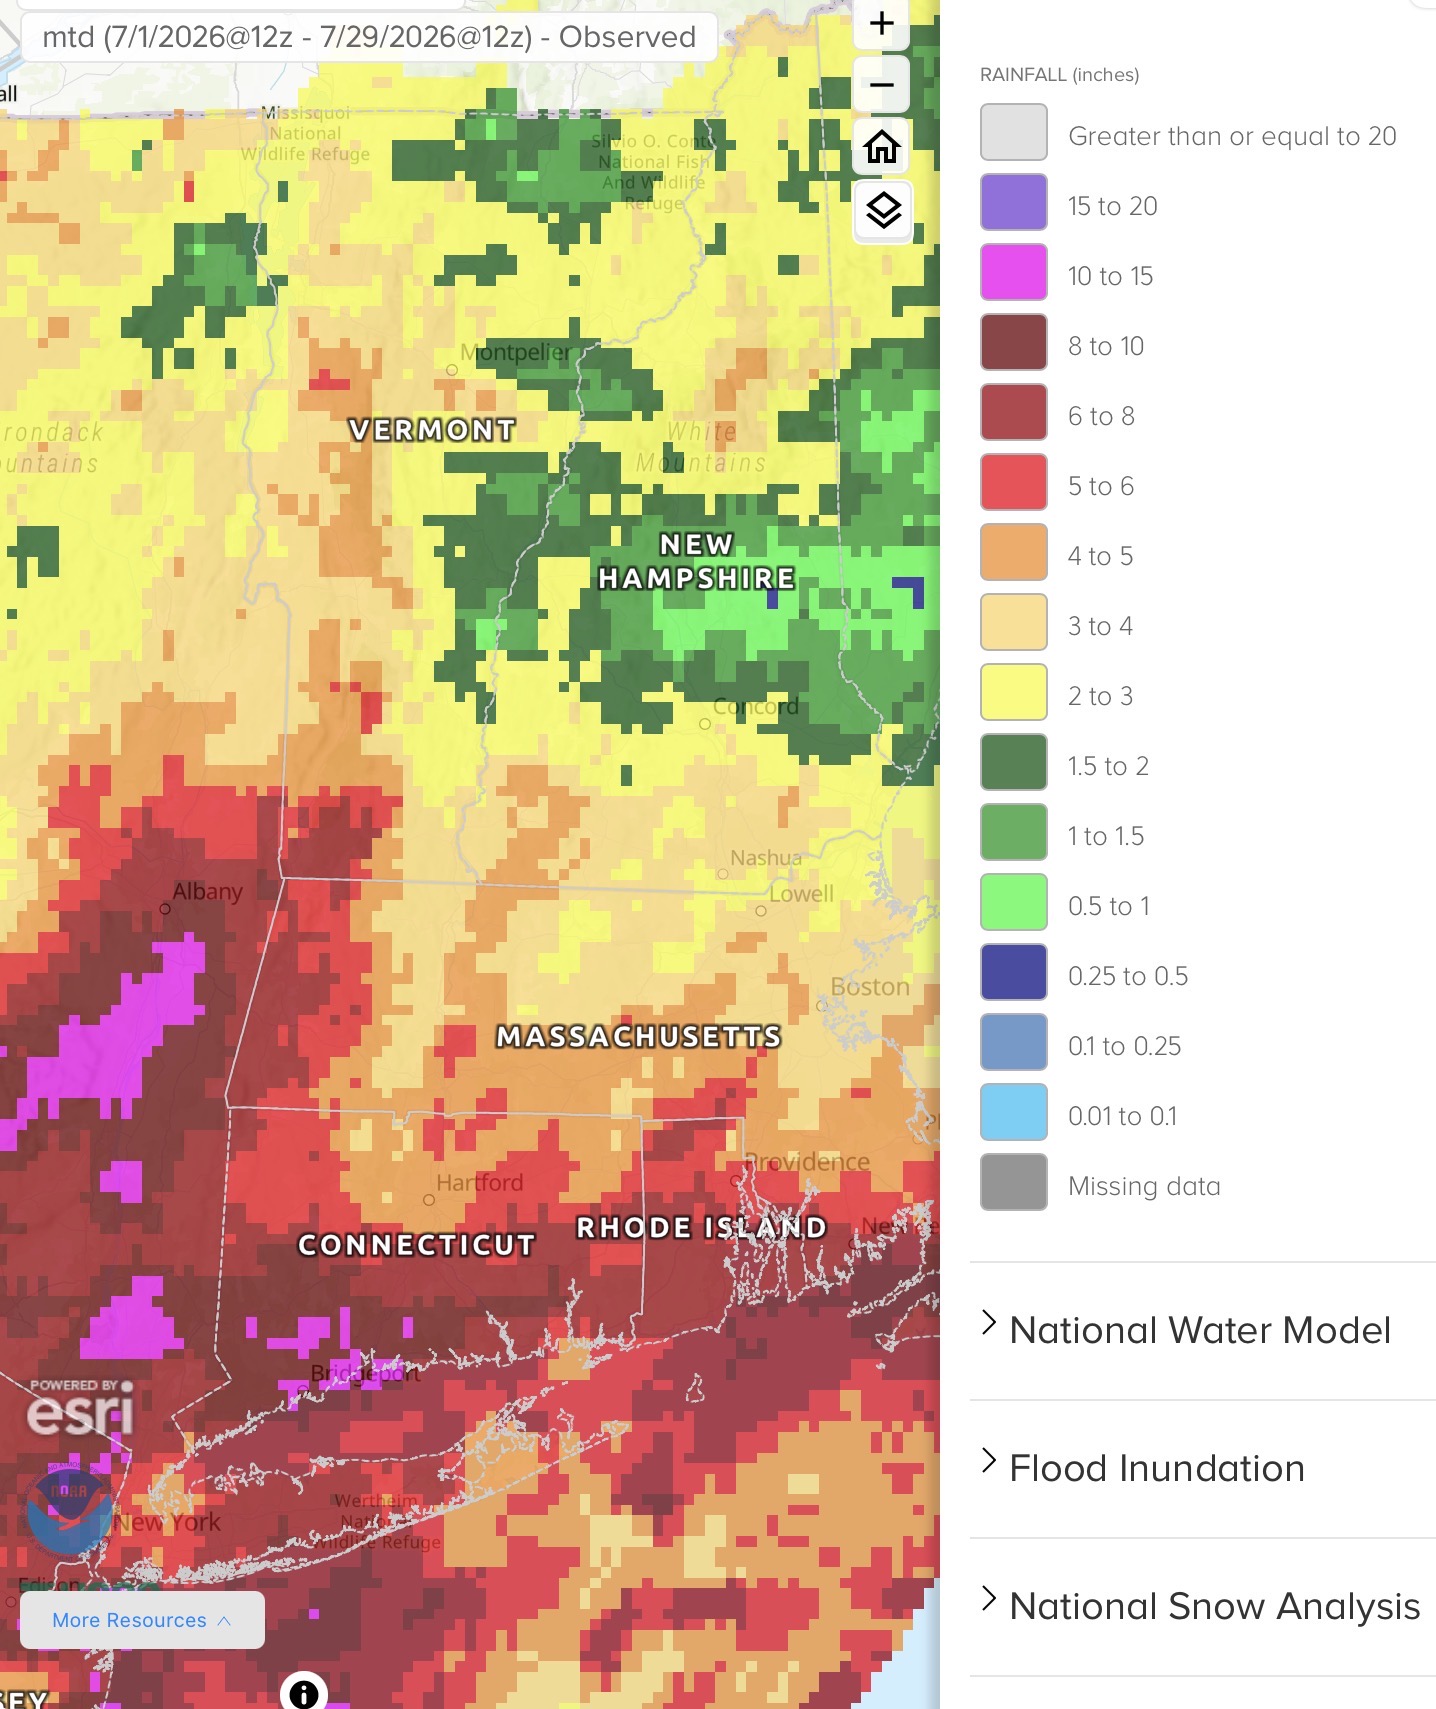
Last year sucked but it was a larger scale drought. We were mostly all in it together. This July has been a personalized Stein boning from here to Winni while I get to watch daily flood pics and record wettest month charts daily.
-
Untrue. Tblizz, ditty, and scoot have historically been rewarded
-
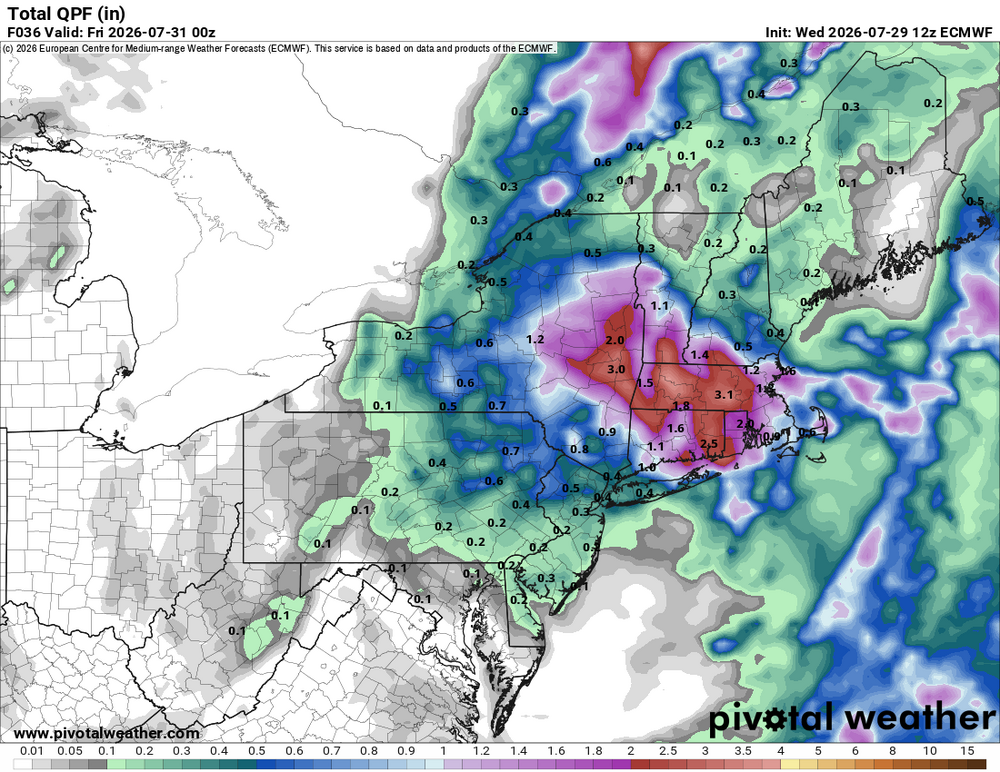
lol euro. Orographic f job
-
10” in a day and I can’t even get 1” in 4 weeks
-
Oops…thanks. Just spot reading posts in reverse chronological order. lol
-
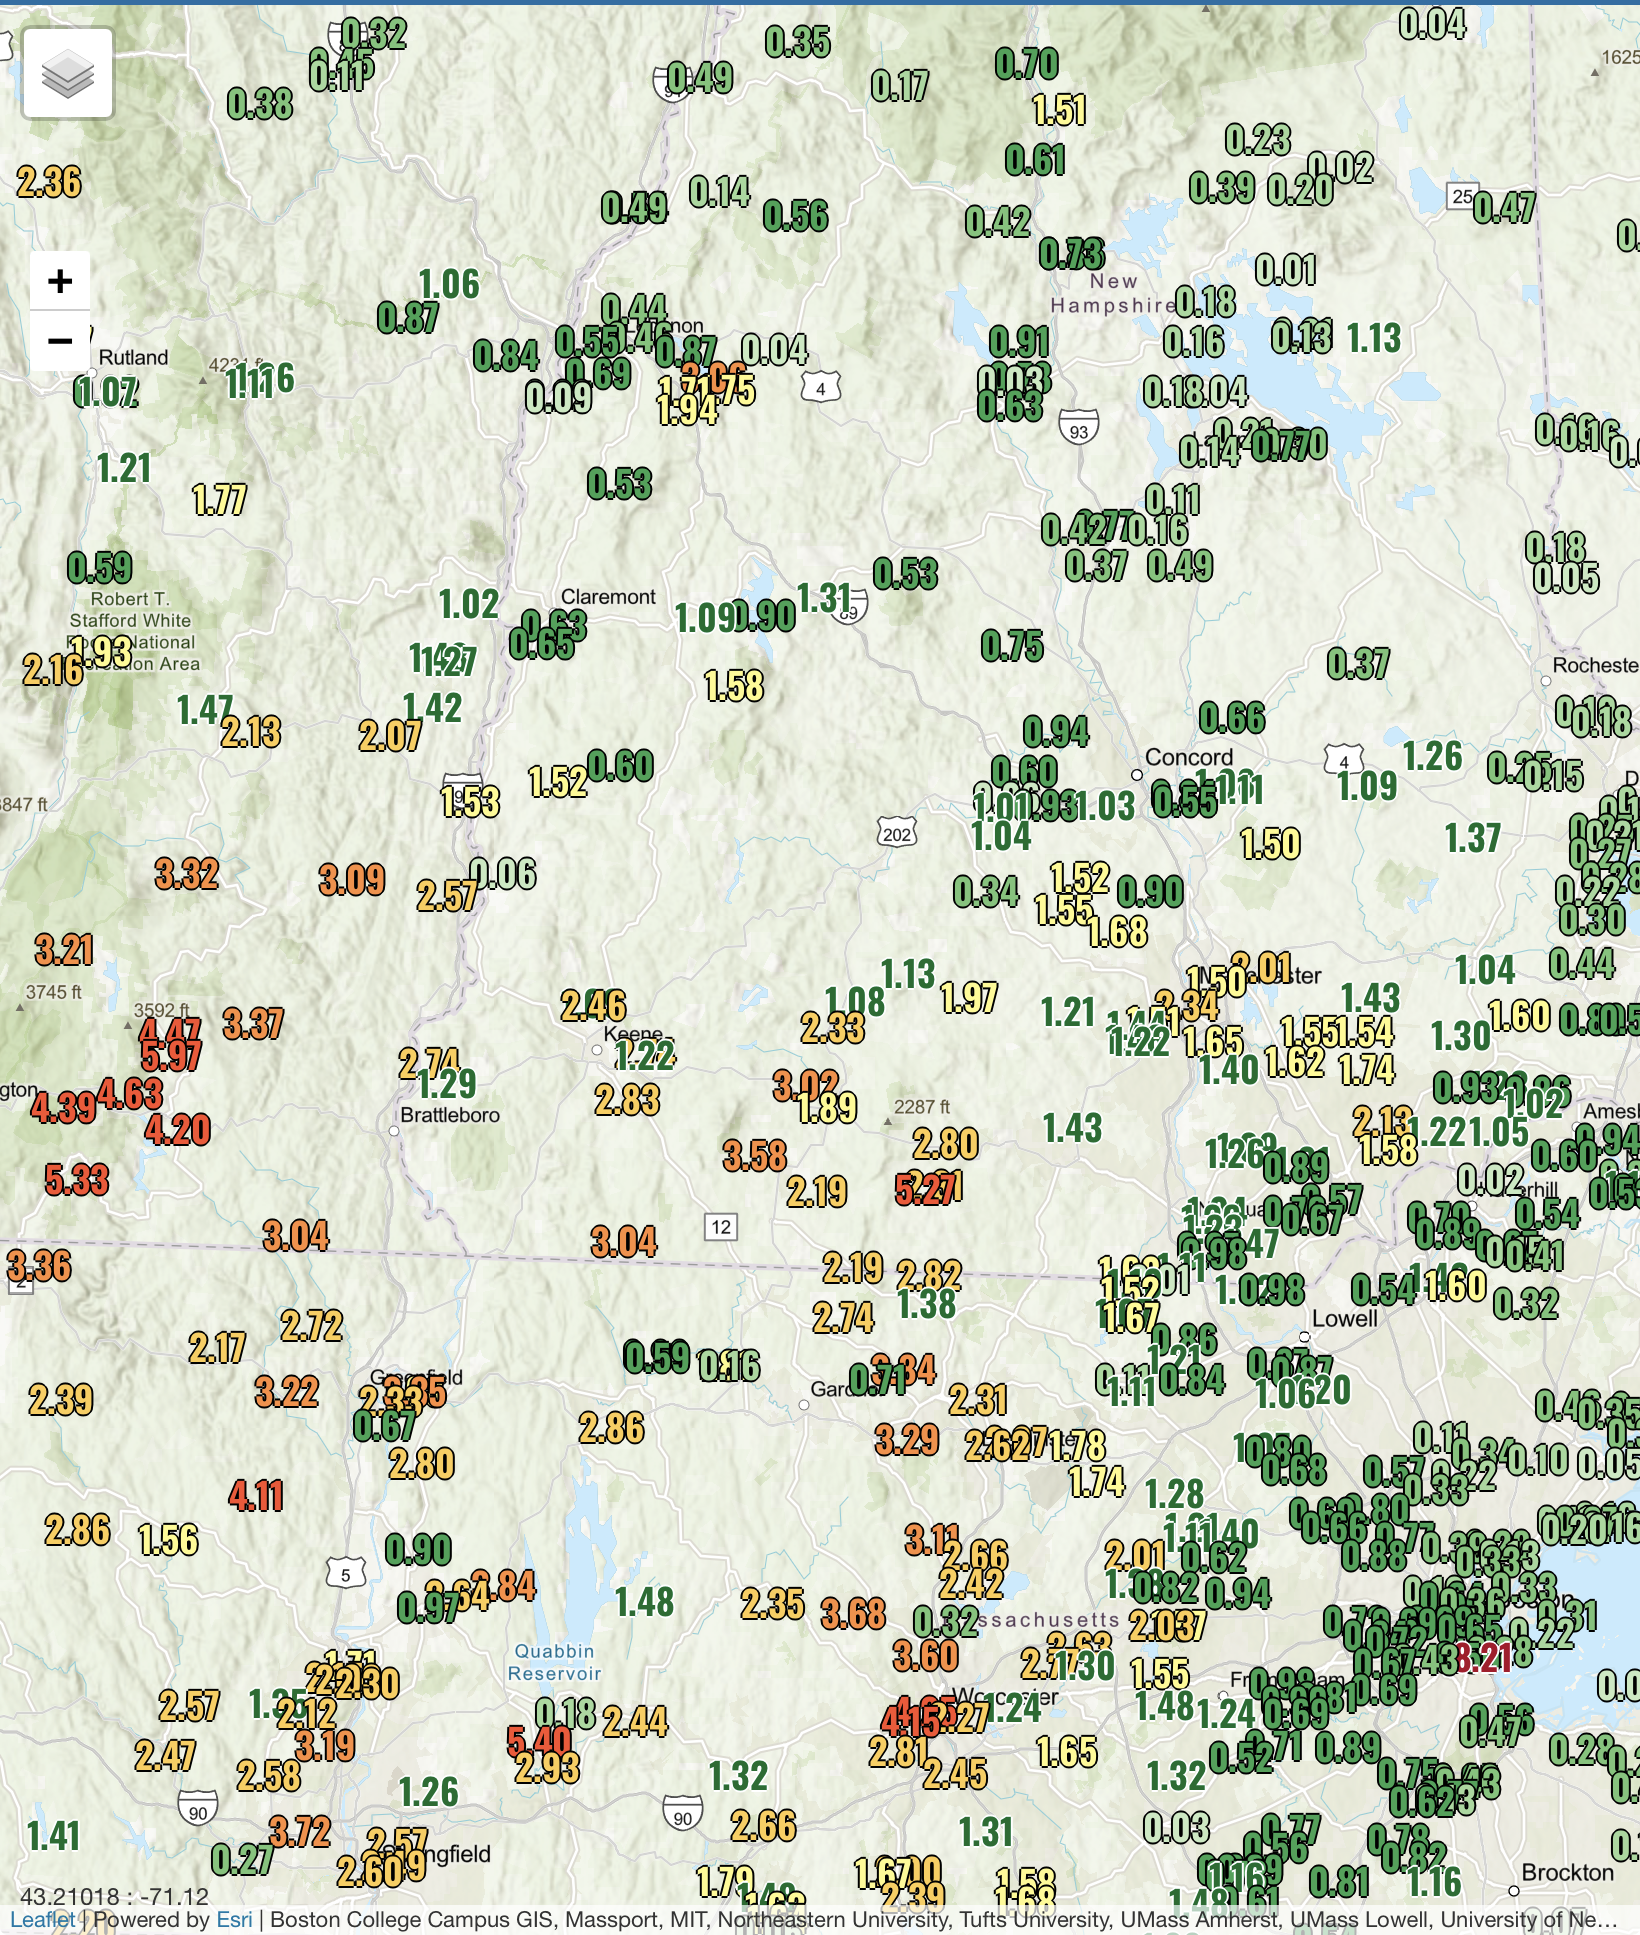
What do they base these on? A specific gridpoint?