NorthShoreWx
-
Posts
5,498 -
Joined
-
Last visited
1 Follower
About NorthShoreWx

- Birthday 02/06/1978
Recent Profile Visitors
9,057 profile views


-
I'm the guest bartender at the St James Brewery this afternoon/evening (fundraiser at the tasting room for my SAR team) and was hoping for nice weather. Instead we got a typical November day. 53° cloudy and windy at 1pm. At least it wasn't last Saturday. PS Stop in and say hello.
-
Only 0.35" here.
-
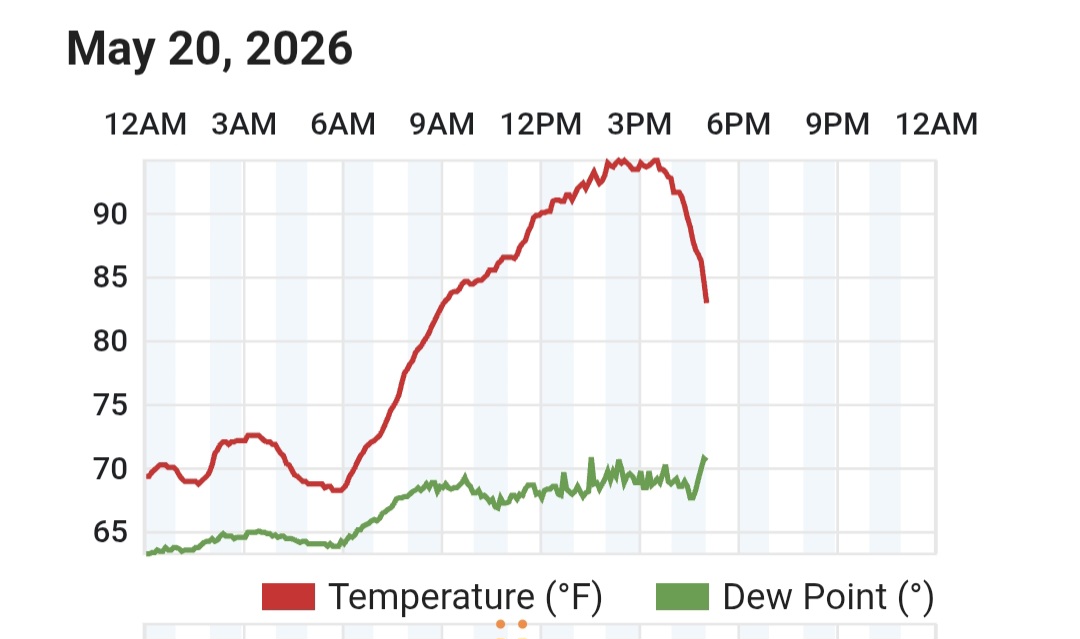
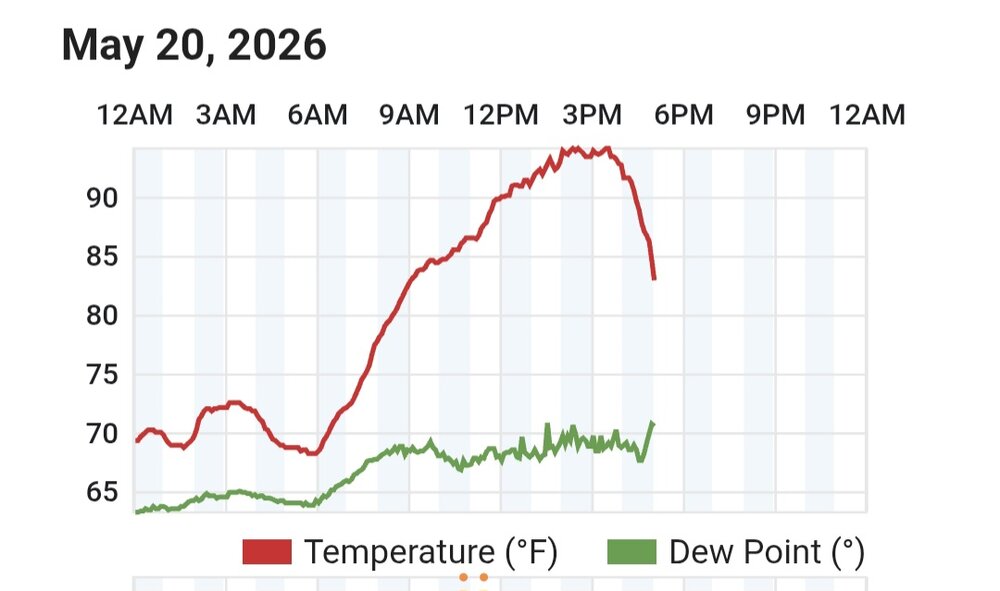
Kind of a fun temperature graph. There was no local storm responsible for the drop, although the nearby ones definitely helped. DP up around 70 though non é buono.
-
That's it. Put that marketing degree to work. Occasional rumbles of thunder here, but only a few moments of insignificant rain so far. We maxed at 94⁰ here. Down to 81 now.
-
Up to 1.46” on the Ambient. Drawn out rain like this is probably about the best way to get an inch and a half on dry ground. 40⁰ and rain continues.
-
It's a balmy 43° here. All things considered, I'll take the rain.
-
30.0⁰ low this am
- 970 replies
-
- 1
-

-
- april showers bring may..
- rain
- (and 2 more)
-
Took the thruway from Kingston around 9pm tonight and got treated to an awesome light show to the south.
-
Low was 27⁰ here with lots of frost.
- 970 replies
-
- 1
-
-
- april showers bring may..
- rain
- (and 2 more)
-
Winter cancelled/uncancelled banter 25/26
NorthShoreWx replied to Rjay's topic in New York City Metro
While I agree in principle, most of the non-native flowering cherries are sterile. Eastern Redbud is a better choice. -
I had a date. We were off from school and took the LIRR to see the circus at MSG. Thundersnow at Herald Square is a cool memory.
- 970 replies
-
- 5
-
-
- april showers bring may..
- rain
- (and 2 more)
-
Down to 54⁰ here now. It's actually turned into a nice afternoon for getting some work in the garden done. It was too warm before.
- 970 replies
-
- 1
-
-
- april showers bring may..
- rain
- (and 2 more)
-
We seem to have topped out at 66⁰ here. Pretty steady around 65⁰ at the moment. It's dropped from the mid 60s earlier to the low 50s around Montauk. The cape is in the 40s. This is very April.
- 970 replies
-
- 1
-
-
- april showers bring may..
- rain
- (and 2 more)
-
It is literally almost 40° colder here than it was at the same time yesterday. I'm good with it. In my family we have a word for this kind of weather. We call it "April"
- 970 replies
-
- 2
-
-
- april showers bring may..
- rain
- (and 2 more)
-
Thanks, that is interesting. For that 20 year period, our average last freeze is April 11. Assuming a similar comparison in the fall, that's at least an extra month of growing season here. Not trivial, especially in the fall, but I'll work those numbers another time. I think the difference in the fall will be even more...it's hard to get to freezing when the LI Sound is still near 60°. Our first fall freeze is sometimes a couple of weeks later than the center of the island, but I don't think there is much difference in the spring.