michsnowfreak
-
Posts
18,449 -
Joined
-
Last visited
Content Type
Profiles
Blogs
Forums
American Weather
Media Demo
Store
Gallery
Everything posted by michsnowfreak
-

2026-2027 Super El Nino
michsnowfreak replied to Stormchaserchuck1's topic in Weather Forecasting and Discussion
One more thing on this...im not a big fan of Cc adjusting because of the relatively minor implications it would have, not to mention its full pf assumptions....but i do feel both 57-58 & 65-66 would be BETTER winters here today than they were at the time. 50s/60s winters as it was were very different from each other (50s much much milder) but both winters saw warm, wet decembers followed by cold/dry. While cold/dry certainly still happens, we tend to get more snow out of it nowadays. And im enjoying summer myself so far. Summer/Fall ahead of el ninos are usually very enjoyable. -
2026-2027 Super El Nino
michsnowfreak replied to Stormchaserchuck1's topic in Weather Forecasting and Discussion
Every El Nino and La Nina is a copy/paste of the same maps. -
2026-2027 Super El Nino
michsnowfreak replied to Stormchaserchuck1's topic in Weather Forecasting and Discussion
You wont find any disagreement from me on expecting a milder than avg winter. Ive said it multiple times, along with the fact that my gut says the 3 main winter months will feature one horrendous month, one good month, and the third month being a wildcard. I do expect early and possibly late snows, and I dont anticipate anything close to the persistence in snowcover we saw the last 2 winters. I cant possibly get more detailed in late June, especially since I dont forecast lol. I also know the history of strong/super Ninos weather-wise here. None are great winters...but not all are bad either, and it seems commonplace here that some pick the worst of the bunch as their "analog" without proper explanation. Whats funny is, Id take 1997-98 over 1957-58, 1965-66, or 1982-83 here. Id take 2009-10 over 1997-98, but I wasnt even remotely suggesting it as an analog. I was merely saying that the map mitchnick posted (which hes allowed to do) looked like it temp wise. Speaking of temps...the fact that everytime the consistently cold cansips is posted, or any other cold map, the poster and all "weenies" get attacked speaks volumes about certain people. I admit, it would be VERY interesting to see the reactions/posts in this thread if those maps were warm and if the other maps were more furnace like (since none to this point are). Suddenly it would be ok to post them! snowman and bluewave often get lumped together for their bias. However, bluewave is a respectful poster and even when others dont agree with what he posts, he does not attack, insult, or go into a rage. Its very easy to see why snowman is post-limited. -
2026-2027 Super El Nino
michsnowfreak replied to Stormchaserchuck1's topic in Weather Forecasting and Discussion
I agree 100%. But actually, at least 1 in here IS implying the lowest snow totals will repeat. Analogs are a tool like models. You could have everything align nearly identical to a previous year and the weather will never be replicated verbatim. Assuming winter is mild overall, there will likely be some significant Fall cold shots and early snows here in the lakes, that is a very common strong nino trait. -
2026-2027 Super El Nino
michsnowfreak replied to Stormchaserchuck1's topic in Weather Forecasting and Discussion
He has "forecasted" 1997-98 for you and looks forward to your suffering. Like i said. Easy as pie. He just goes warmest/least snowy outcome for the east. Without even looking at data that tells me 1997-1998 was the worst strong/super nino of the bunch for the east. -
2026-2027 Super El Nino
michsnowfreak replied to Stormchaserchuck1's topic in Weather Forecasting and Discussion
I consider myself to have a lot of weather knowledge...but i dont forecast. Definitely respect those who do so, particularly without much bias. I have a preference, not a bias. I worry that preference would create a bias if I tried to forecast, so I dont. Say its mid winter and every model shows warmth the next two weeks. I know its going to be warm, so instead of trying to find something to say all models will be wrong, or try to find a reason why it will be warm when i thought it would be cold.....no...im going to deal with it, see if we will squeeze snow out of it, and look beyind the warm spell. -
2026-2027 Super El Nino
michsnowfreak replied to Stormchaserchuck1's topic in Weather Forecasting and Discussion
Exactly. Sometimes the difference between anamolies and absolutes get lost in the translation. A low snow winter in detroit is still snowier than a snowy winter in Albuquerque. -
2026-2027 Super El Nino
michsnowfreak replied to Stormchaserchuck1's topic in Weather Forecasting and Discussion
This is whats interesting to me. I fully expect a milder than avg winter here, as ive said multiple times. However, the fact that a few models are showing cold, and even the milder models aren't anywhere near a furnace, is a red flag for those (we know who they are) who assume super nino means super furnace. Remember, these same models are all showing the strong/super nino, and nino climo is already in these models, are not showing blazing warmthm -
2026-2027 Super El Nino
michsnowfreak replied to Stormchaserchuck1's topic in Weather Forecasting and Discussion
Exactly what I think of you. I typically don't name call though, something you do all the time to people in here. -
2026-2027 Super El Nino
michsnowfreak replied to Stormchaserchuck1's topic in Weather Forecasting and Discussion
Plenty of snowstorms in the lakes in 72-73 & 15-16. 23-24 was the one month winter. Nearly winters entire load blown in January. -
2026-2027 Super El Nino
michsnowfreak replied to Stormchaserchuck1's topic in Weather Forecasting and Discussion
Enso state is irrelevant to what your yearly analogs are. Whatever is warmest and least snowy on the east coast. I dont even live there and I know that. -
2026-2027 Super El Nino
michsnowfreak replied to Stormchaserchuck1's topic in Weather Forecasting and Discussion
There really cant possibly be anyone who's game is as clear as his. -
2026-2027 Super El Nino
michsnowfreak replied to Stormchaserchuck1's topic in Weather Forecasting and Discussion
Lmao. This coming from the person who had to scour the internet and post tweets in Spanish and French last winter to desperately find something showing it wouldnt be cold in the east. Why would i wish cast 2009-10? I live in Michigan, not the Mid-Atlantic. It was an average winter here. Not bad, but sandwiched by 3 excellent winters it was unmemorable here. I just said the map mitchnick posted looked like that. Oh and who suggested cold? You can embed 8 tweets in one post so you fit your daily post limit, but no one else can share something without it meaning they suggest its what happens? Ive actually said multiple times i expect a milder than avg winter here. Again. Michigan. I dont need what you consider below avg or avg temps to get snow. Youre right about one thing though. Your meltdowns/tantrums will be absolutely comical if winter is not a record furnace or if the east gets a noreaster. Like heat miser accusing mother of liking snow miser best. -
2026-2027 Super El Nino
michsnowfreak replied to Stormchaserchuck1's topic in Weather Forecasting and Discussion
Looks 2009-10ish. Interesting both jamstec and cansips are far from a warm winter. -
Very lucky that I will make it to July with hardly any heat this year!
-
Ive heard that about Banff!
-
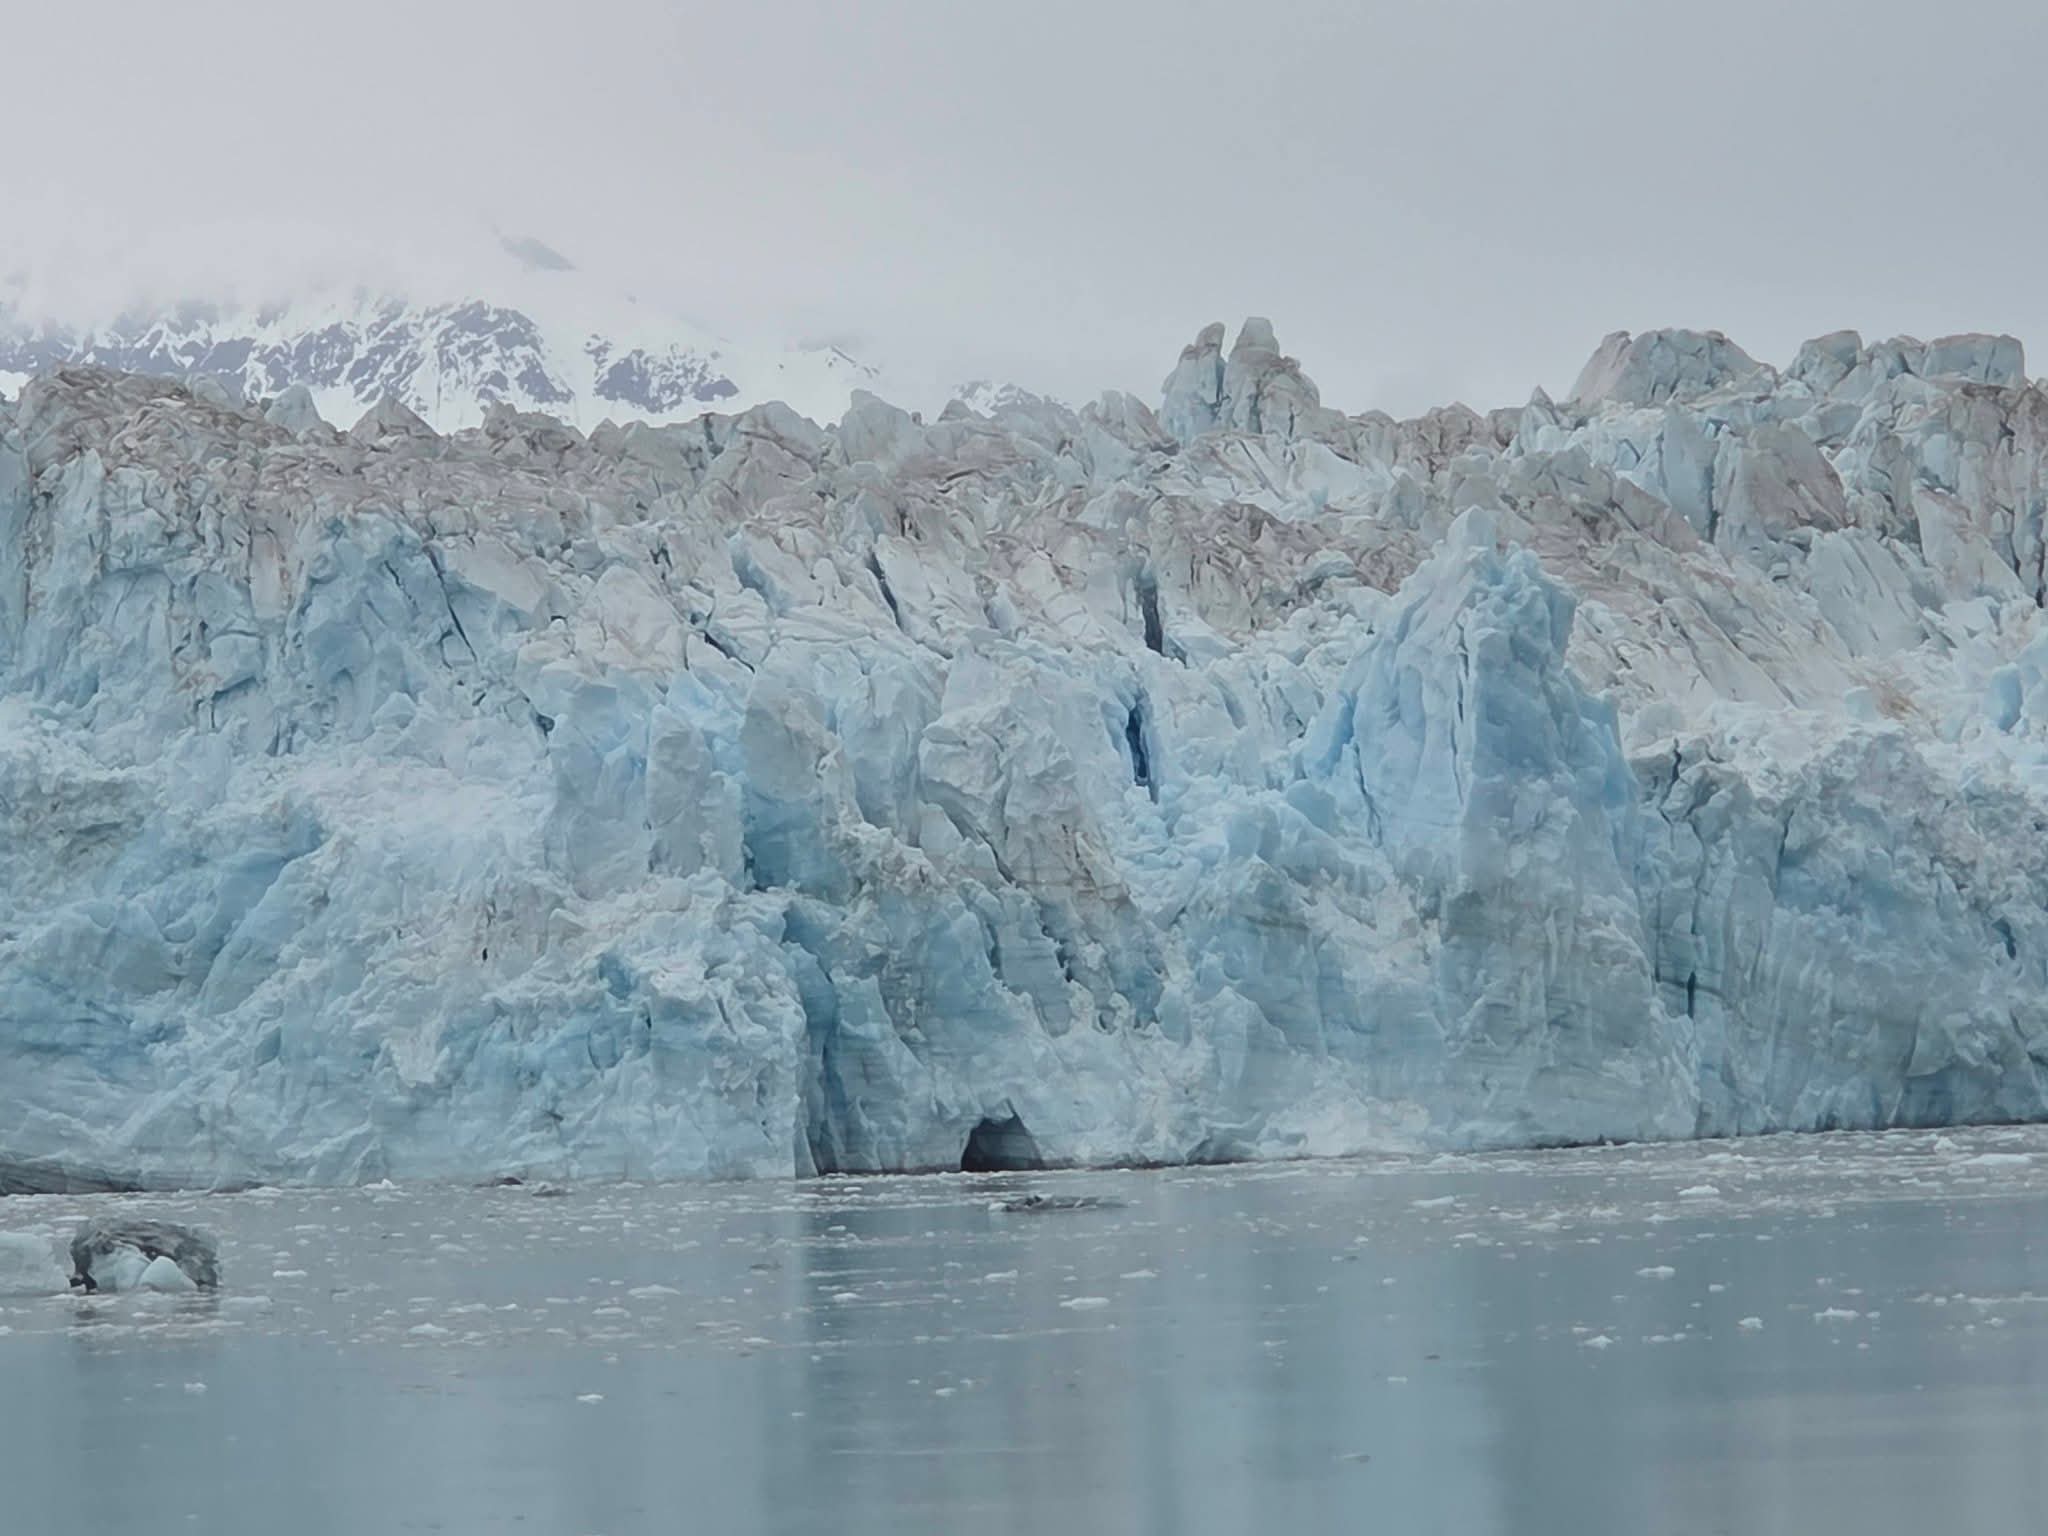
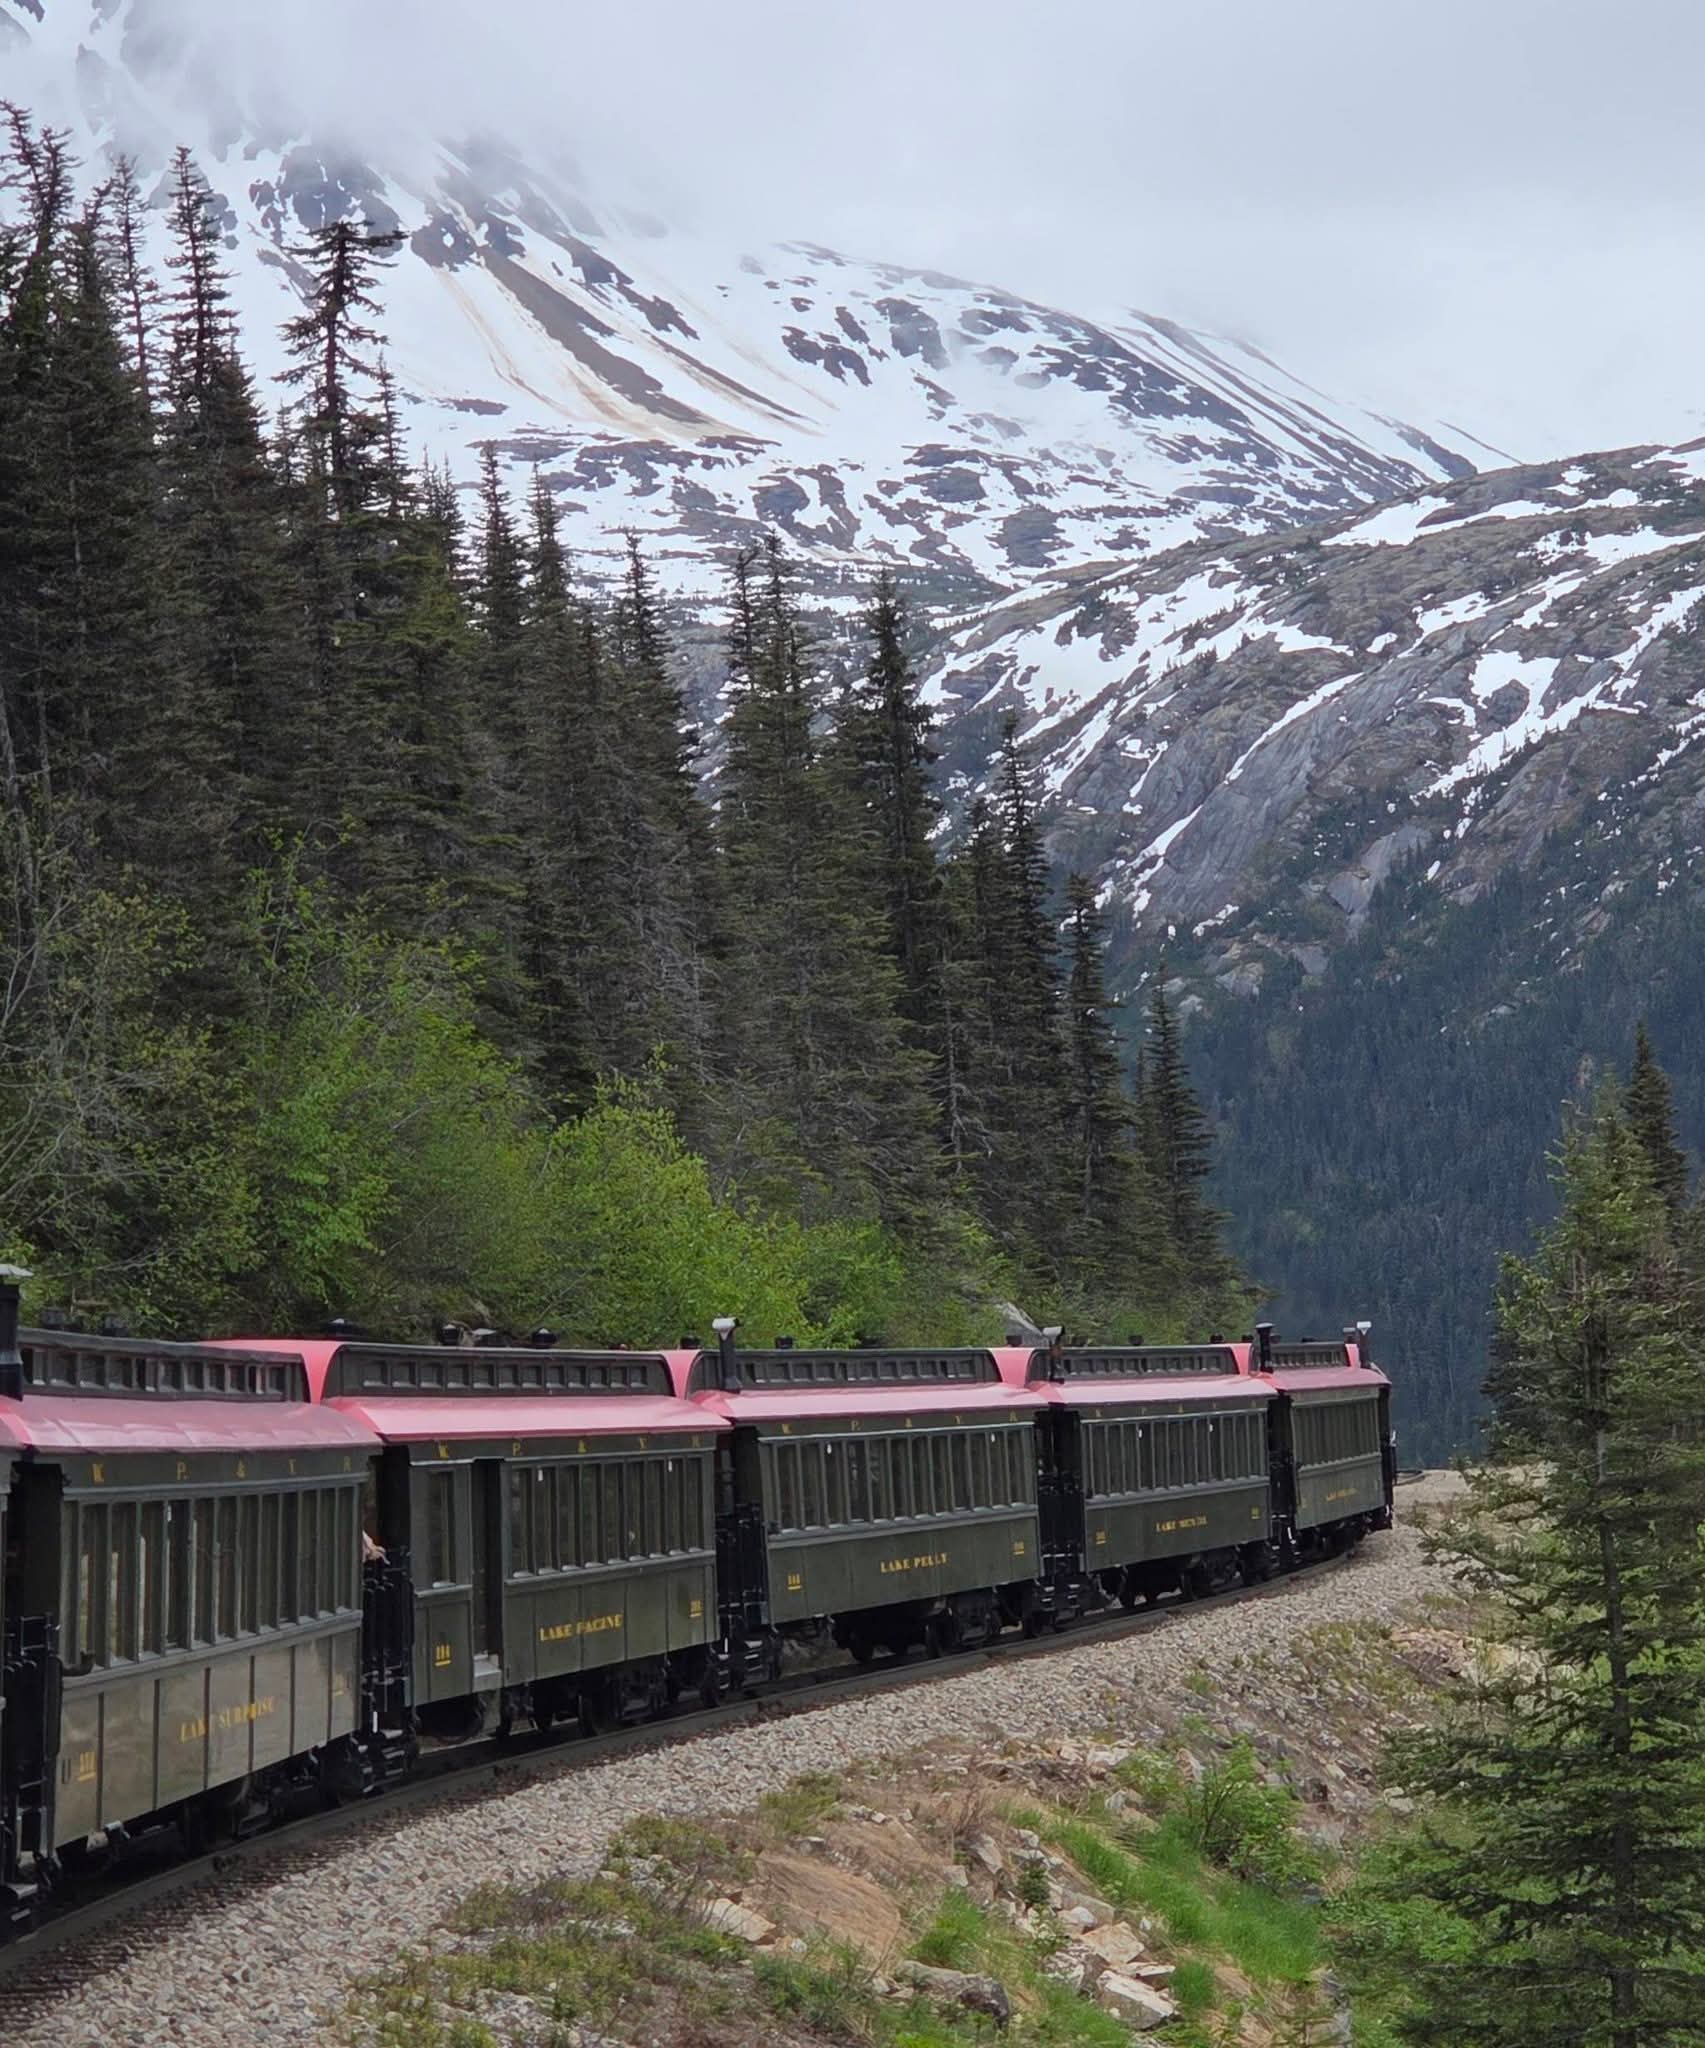
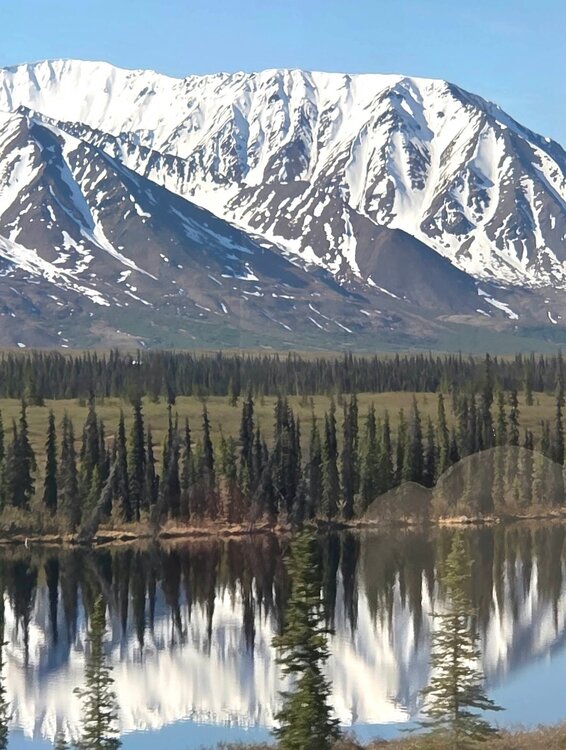
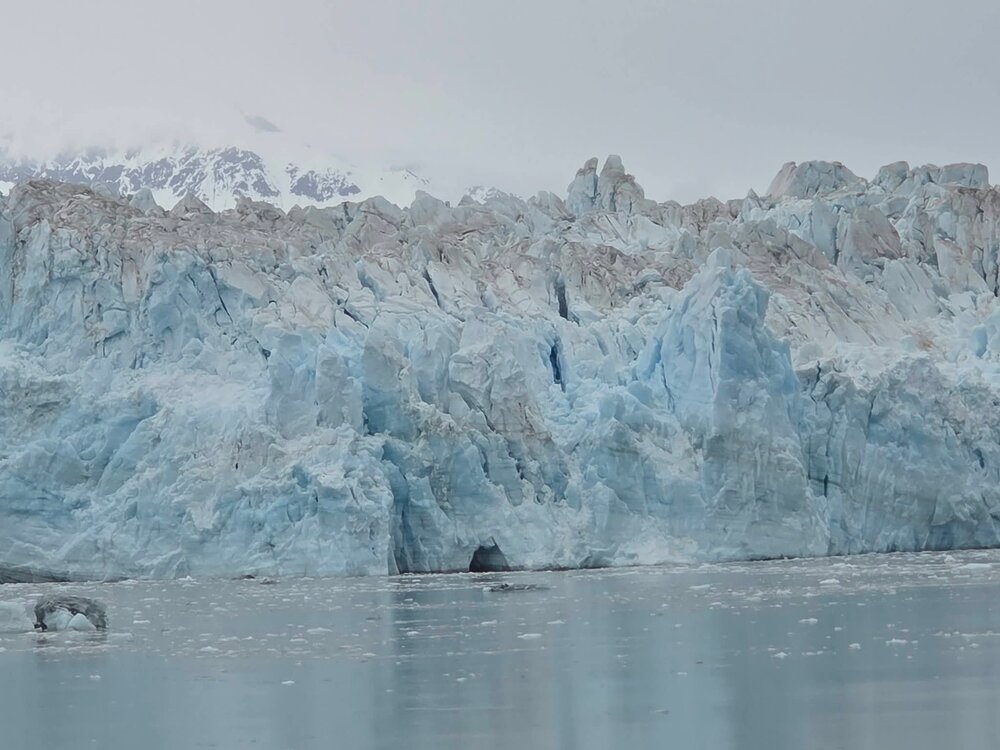
Alaskas beauty was incredible. Highly recommend a visit. They had a very harsh winter so there was still lots of snow left on the higher mountains and I got to enjoy multiple feet drifts haha. Also saw a massive glacier up close. What a way to run summer.

- 183 replies
-
- 17
-

-
2025-2026 ENSO
michsnowfreak replied to 40/70 Benchmark's topic in Weather Forecasting and Discussion
Forecasting a DJF average of milder than average is a no brainer for the northern tier of a strong Nino, but precip/snow is always a wildcard. As Chuck has pointed out, often the strong the el nino, the higher probability of a wetter outcome in areas like the Lakes where the generic El nino map would show dry. -
2026-2027 Super El Nino
michsnowfreak replied to Stormchaserchuck1's topic in Weather Forecasting and Discussion
The scenario you describe (dry during the cold periods) was the big problem in 1982-83 here. I haven't looked up Colombus but in Detroit, still plenty of snow chances. Ironically in 1997-98 Feb was the really bad month here (the rest of winter was ok, including a snowy mid nov to mid dec) but Cincinnati got buried in Feb. All varies. 2015-16 finished just a bit below avg snow wise at Detroit but above avg snow a bit further north near @roardog. -
2026-2027 Super El Nino
michsnowfreak replied to Stormchaserchuck1's topic in Weather Forecasting and Discussion
This is a good point. But even then, its not steady temps across the board. Its still colder in the mean in the north than the south. Which means blues in the south arent necessarily great for snow, but reds in the north arent prohibitive of snow either. -
2026-2027 Super El Nino
michsnowfreak replied to Stormchaserchuck1's topic in Weather Forecasting and Discussion
Going to be a snowy winter in Vegas and Miami! -
2026-2027 Super El Nino
michsnowfreak replied to Stormchaserchuck1's topic in Weather Forecasting and Discussion
Same with Erie. And NYC for that matter. 1990s winters were warmer than 2000s or 2010s winters. The globe may have warmed in that timeframe but winters in the Lakes/Northeast were colder the next 2 decades after the 1990s. So any parallels to the 1997-98 nino I certainly wont be worried about a verbatim weather scenario with temps a degree or 2 warmer, thats not how the weather works. -
2026-2027 Super El Nino
michsnowfreak replied to Stormchaserchuck1's topic in Weather Forecasting and Discussion
But its not apples for apples. The sensible weather will not follow the same exact script. For instance, both 2015-16 & 2023-25 had more severe cold shots than 1997-98. Indeed 1997-98 was a very murky, gray winter so the lows were insane warm even during the colder stretches. Also, 1990s winters here were warmer than both 2000s and 2010s winters. Same at Buffalo (assuming thats near you). -
Love it! Ill be in Alaska
-
2026-2027 Super El Nino
michsnowfreak replied to Stormchaserchuck1's topic in Weather Forecasting and Discussion
Ignorance really is bliss with the trolls.