

Terpeast
-
Posts
5,326 -
Joined
-
Last visited
Content Type
Profiles
Blogs
Forums
American Weather
Media Demo
Store
Gallery
Everything posted by Terpeast
-
3.4” total for August, much better than May-July. But looks dry as far as the forecast can see. Temps at IAD look to finish at 88/66 avg for the month, +1.5 AN
-
I also think we have a higher than normal chance for a big dump. I need to work out the exact stats/probs, but it’s probably something like: Avg climo: 5% chance of one 15”+ hit (in any given winter) This winter: 25% chance (note this still means 75% chance we don’t get a big KU hit)
-
I see a 96 at dca on oct 2, 2019 oct 2018 maxed at 90
-
Sunset was so gorgeous that I forgot to take a pic. Ah well Gonna milk this weather as much as possible before the heat cranks up
-
And it’s not just this month. The WPAC pool is also modeled to warm up as we go into winter months. I wouldn’t be surprised to see forcing go east this fall, then get pulled back west
-
When I look at the sst map, the entire pac is warm. Even off the west coast. While the -pdo was real this past winter and spring, I’m wondering if neg values in the index today are just an artifact since the west coast waters have warmed up. The map looks more neutral to me, but warm everywhere.
-
12z euro shows 98-100 region wide. More realistic
-
This is going to be a particularly difficult winter outlook. My top analogs so far are 1972-73, 1991-92, 2002-03, 2015-16, and a couple of runner ups in 2009-10 and 1963-64. It is a loaded group, but with high bust potential being magnified by a warming world. Only thing I can say for certain is that this won’t be boring.
-
Here are the stats for IAD (only goes back to 1962, so '58 and 61' would not be on this list): 1962 (Dec 26 - Jan 9, max 8") 1966 (Jan 27 - Feb 4, max 14") 1967 (Feb 7 - 11, max 10") 1969 (Dec 26 - 30, max 13") 1971 (Jan 1 - 5, max 15") 1978 (Jan 20 - 25, max 9") 1979 (Feb 13 - 23, max 22") 1982 (Jan 21 - 30, max 9") 1983 (Feb 11 - 18, max 22") 1984 (Jan 20 - 24, max 8") 1987 (Jan 23 - Feb 4, max 19") 1996 (Jan 7 - 18, max 24") 2003 (Feb 16 - 22, max 18") 2009 (Dec 19 - 25, max 18") 2010 (Feb 6 - 20, max 26") 2014 (Feb 13 - 18, max 8") 2016 (Jan 23 - Feb 2, max 28") Notice that even tho we have longer gaps in these occurrences since the 80s, the max #s get gaudier.
-
JFM 23 would be a shade of red with nearly 4C AN. Even with light yellow or slightly AN temps JFM 24, it would feel a lot colder than last winter.
-
I like reading his analyses (as long as I can understand them). It just shows that nobody really knows what’s going to happen next. If we’re going to get a nina pattern this year, better for it to happen now or in the fall than in mid winter. Let’s get it over with.
-
-
Exactly. Beggars can’t be choosers
-
Its gotten better here with around 3.5” MTD compared to 2” in July and 1” June. But we have a long way to go before we dig ourselves out of this hole. I do think we will have a warmer and wetter than normal autumn, though.
-
Just as a watched pot never boils, whenever I track nothing happens. I didn’t track today, and got hosed on with that cell. 0.7” Maybe I shouldn’t track winter storms?
-
95.4 imby. Reminder that it’s still summer
-
Hey it’s all good no worries
-
I want my kid to see some actual snow, too. That actually accumulates! Not just snow TV that doesn't stick. I'm not all doom and gloom yet, I'm actually cautiously optimistic about this upcoming winter. And I've been working on a statistical analysis on what we can expect from future winters, and the picture being painted doesn't seem as terrible as we're making it out to be. I've used 2 methods to arrive at basically the same result, which is a 16% reduction in our average snowfall... even that seems like a lot more than what we've been getting the last 7-8 years. I keep saying that I'll post it this summer, but that's probably going to have to wait until fall. Just don't have the time.
-
Yeah, I didn’t intend for anyone to read as such into what I said about Dec. Nino winters tend to lean backloaded anyway. What does concern me is the warm ssts across the board. Where and how can we get enough cold air if our average 850s is -4 in mid winter, and ssts are +2-4 above normal? Pretty small margin for error there.
-
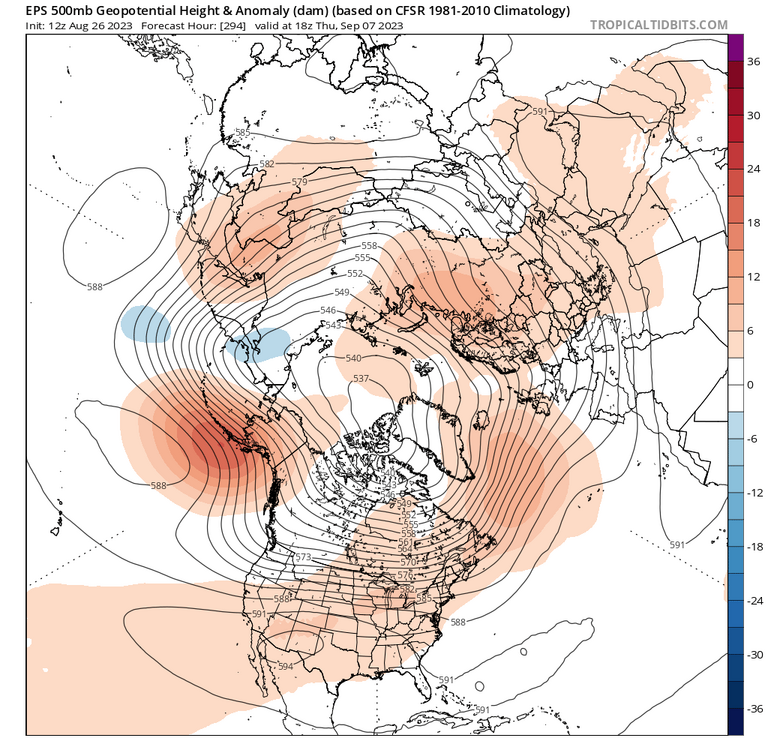
I’m fine with punting Dec to get a good Jan and feb, but this kind of map is exactly what I’m concerned about with ssts on fire
-
yeah, thanks to those pesky volcanoes, we’d lose feb 87 if it happened now
-
A very real possibility. Just look at the northern hemisphere sst map
-
Second animation, thermocline appears to be pushing up in 1+2
-
I think the subsurface has bottomed out for now. It might warm a bit again
-
Winter 2023-2024
Terpeast replied to Stormchaserchuck1's topic in Weather Forecasting and Discussion
Thanks, I see JJ was 0.3 while ONI was 0.8. If it's tracking 0.5 lower, then it should be ~0.8 now while ONI/3.4 are around 1.3. And look how strong the La Nina was last year according to the MEI, it peaked at -2.1. I was amazed at how strong the nina's "grip" on the atmospheric pattern last winter despite the ONI being a pedestrian ~-1.0.


