

Terpeast
-
Posts
5,326 -
Joined
-
Last visited
Content Type
Profiles
Blogs
Forums
American Weather
Media Demo
Store
Gallery
Everything posted by Terpeast
-
Still a large spread only 2 months away from their projected OND/NDJ peak
-
I’m thinking the same. It would be better with a wave diving SE from the pna ridge and track NEward with a core cold air just to the north. Not an omega block like this
-
Yeah, or realistically, this would be a cold rainstorm because the low is tracking due north with the high 500+ miles to the east shredding the mid levels with maritime air. Like 97-98
-
12z canadian trended east, but still gives us 2” area wide. NAM is now the furthest west and wettest solution, EURO driest with nothing W of bay. If this was winter, oh boy
-
Yeah, and that happened a lot during the 1960s. Taking those analogs and warming them up by 3-4 degrees may get us a preview of what’s in store for winter. At least that’s my thinking for now.
-
We don’t. Sample size is tiny.
-
Winter 2023-2024
Terpeast replied to Stormchaserchuck1's topic in Weather Forecasting and Discussion
Same -
Now we know why our winters have sucked lately. They keep jinxing them with these silly weenie forecasts
-
Not just that, but also further north with the SLP position at hr 84
-
I still think the CFS is overcorrecting. It’s very rare for a nino to peak this early. Slowing down? Yes. Instead of warming by 0.3 per month, we may go 0.1/month until november or so. Right now we’re at 1.6, so that takes us to 1.7-1.8. MEI could reach 1.0 give or take, then start decreasing a bit into the winter as the WPAC is projected to warm back up towards neutral or slightly above (right now it’s slightly cooler than normal). My analogs will likely include winters with MEI between 0.5-1, and if they go further back than 1990, I’ll adjust them up by a few degrees.
-
@bluewave True, that Euro forecast for 18-19 was a bust. But there was just enough of a STJ and a negative NAO to keep things interesting for the MA. Also, like I said, temps will not likely be driven by enso. In the case of 18-19, it was the MJO tearing through the MC with impunity. In your RMM chart, the warning sign would have been the mid-November MJO activity. That’s when we should have known the seasonal Euro forecast was in trouble.
-
0.23 for the day
-
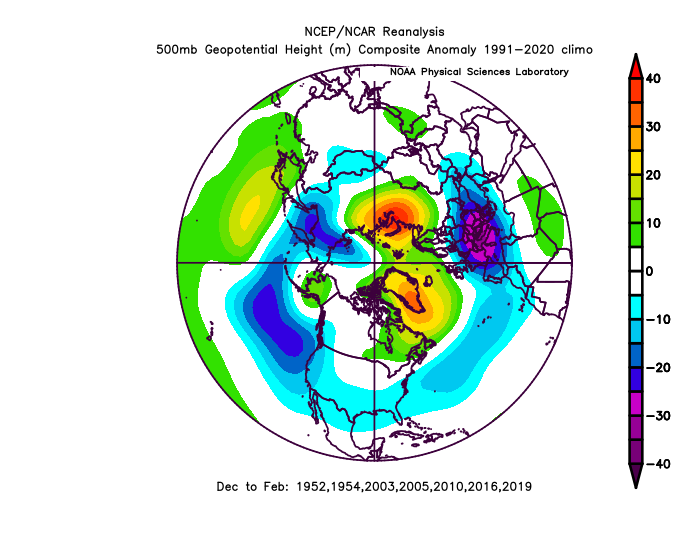
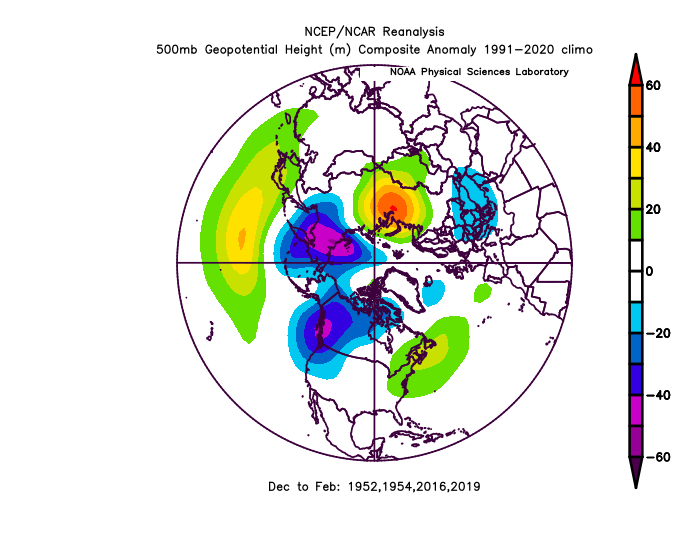
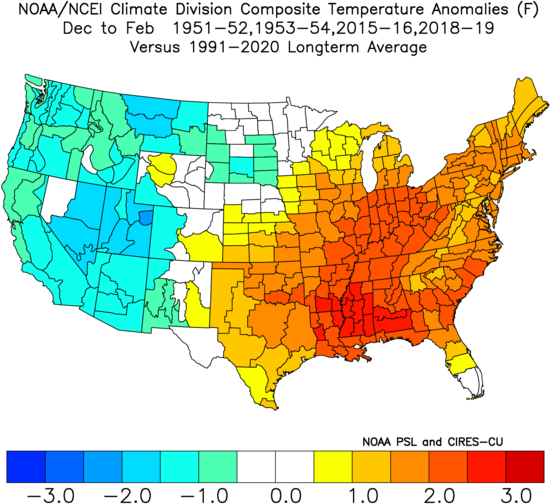
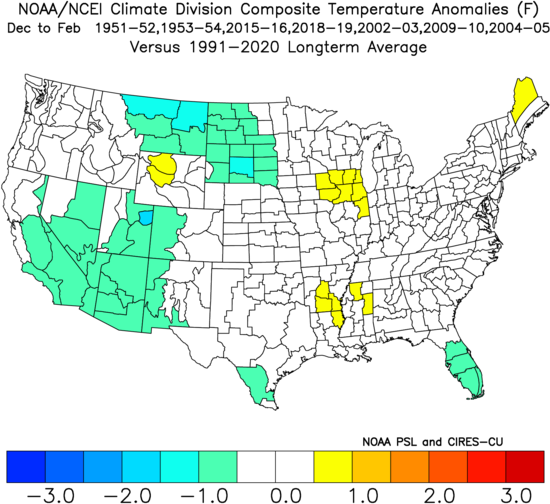
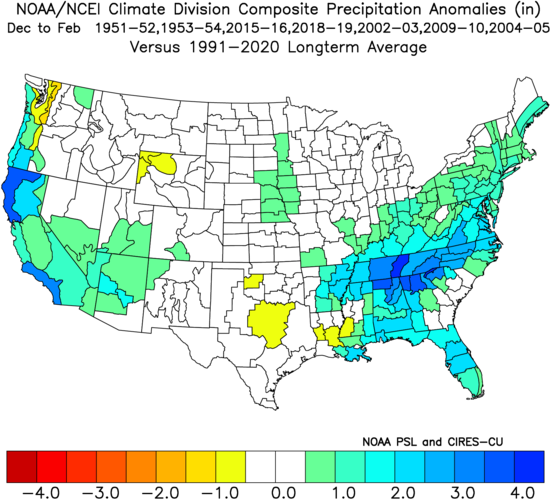
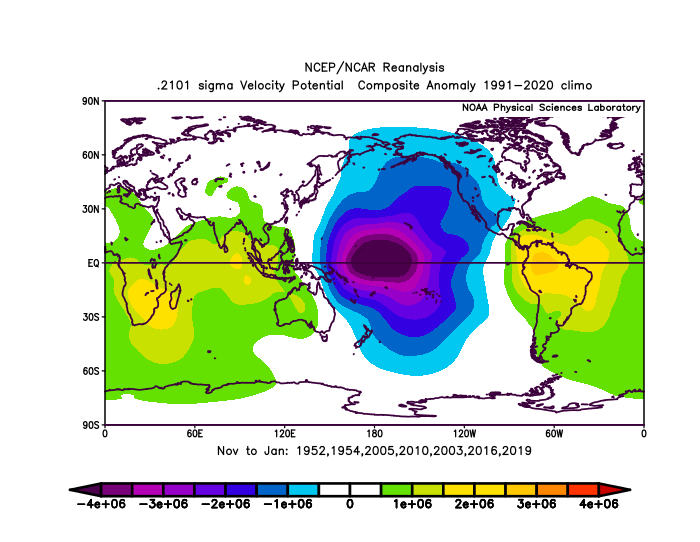
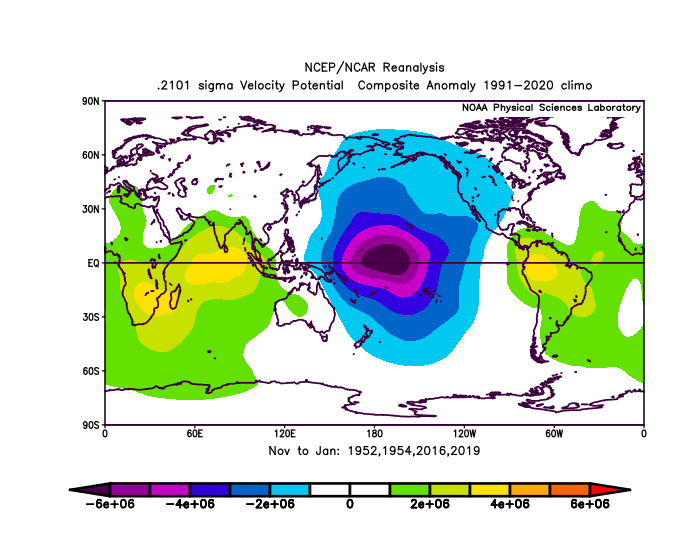
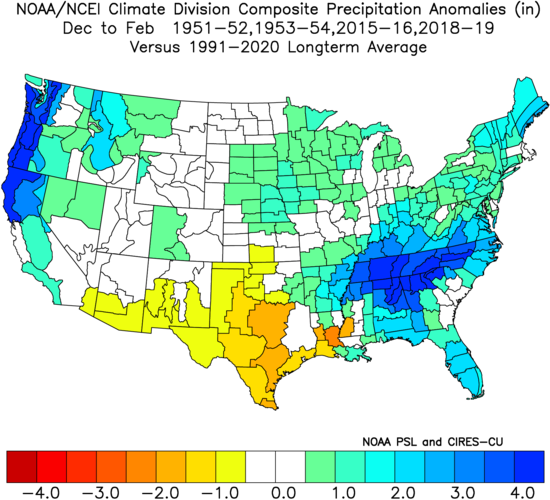
Here are the composite maps comparing between two groups of winters: Group 1: 51-52, 53-54, 02-03, 04-05, 09-10, 15-16, and 18-19 Group 2: 51-52, 53-54, 15-16, and 18-19 Velocity potential: Location of the -VP anomalies between two groups are the same. The good winters in group 1 seem to have had stronger modoki forcing, though. 500mb: Flat N pacific ridging in group 2 seems to be stronger and further east with an extended jet and downstream troughing in the west and ridging over NE and SE Canada, similar to a nina. In group 1 it’s more retracted to the west, giving more room for the STJ. Also worth noting the -NAO really changes the look, and I don’t think that can be attributable to ENSO/MEI. Temp & precip: Obviously group 2 shows a signal for a milder winter, but perhaps not as mild as last year. But in group 1, with the good winters of 02-03, 09-10, and 04-05, the warm signal disappears. Both groups have cold winters in the west/SW. Both groups show a wetter than normal signal for the east. Strong signal for an active STJ. Conclusion: With the MEI lagging behind ONI, it’s possible that VP forcing will take on a modoki look around the dateline, give or take a couple of ticks east or west. The STJ is likely going to be active as well. What’s less certain is temps, though. It could go either way. I don’t think ENSO is going to be the driver of temps, only more on precipitation across the southern US. What will determine the temps will have to come from something else, likely in the polar domain. The lack of coupling in this nino won’t necessarily be the kiss of death for our winter, and we will likely see some form of active STJ when the nino begins to exert some influence starting in December. Temps will then be the biggest wild card, and how cold we get (and how much blocking) will determine whether we get lots of snow… or reach climo with 1-2 events… or mostly rain.
-
Now that I got home, I just did this analysis with correctly aligned (time-wise) ONI and MEI values going back to 1950, and here are the winters with El Ninos of ONI > 0.5 with [MEI - ONI] values < -0.5 (the difference between MEI and ONI where MEI is significantly lower than ONI): 1951-52 (based on MEI v1) 1953-54 (based on MEI v1) 2002-03 (OND only) 2004-05 (DJF only) 2009-10 (NDJ only) 2015-16 2018-19 So as you can see, it's quite rare for the ONI >0.5 with MEI being at least 0.5 lower to happen, but it seems to be happening more frequently since 2002. The only time before that was 1951-52 and 1953-54 based on the original MEI. Between 2002 and 2010, the +ENSO with <-0.5 [MEI - ONI] combination only happened briefly while ONI peaked. Then it happened in 2015-16 for at least 2 months in a row, and again in 2018-19. Now, what I'll do is create: 1) H5 composites over the polar domain, and 2) VP anomaly composites across the EQ domain 3) CONUS temp and precip anomaly maps For 2 sets to compare between: All of the above years, and Only the years with sustained [MEI - ONI] <-0.5 for 2 months or longer, namely 1951-52, 1953-54, 2015-16, 2018-19 Unless anyone can beat me to this... EDIT: Correction made, originally said MEI < -0.5 but I meant the delta value of MEI minus ONI. Sorry if you got confused.
-
Interesting, this despite a strong nina signal in the medium term: -pna with flat aleutian ridge until end of month. Is this a tropical depression or a subtropical low? Worth noting an aleutian low tries to wedge its way in while a hint of STJ shows up in the long term ensembles.
-
Thanks @bluewave. Two things I’d do a bit differently. Instead of pairing Sep 3.4 values with JA MEI, I’d pair Aug 3.4 values instead so they are better aligned in time, not 1-2 months apart. Or better yet, use JJA ONI values with JA MEI. I’d also try using the original MEI dataset to try to get a larger sample size of el ninos with lower MEI values than 3.4. The newer v2 dataset includes OLR, but OLR seems to be more coupled this year than SLP, and the original dataset includes SLP so I don’t think using the old dataset will be a problem.
-
Radar seems more robust than mesoscale models predicted today
-
0.13” so far
-
Map like that, I could see increased high latitude blocking which would be good for us, but at the same time, it’s hard to see how an aluetian low could plant itself there for longer periods of time. Hopefully it’s just the surface and when strong storms go through they’ll erase some of the sst warming. Probably will see an aleutian ridge pop up now and then while that happens.
-
The first thing I’d do is to pull the longest monthly MEI and ENSO records available, calculate the difference between ONI (or 3.4) and MEI. Then I’d list the +ENSO years with the largest differences between ONI and MEI (delta of 0.5 or greater at ONI trimonthly peak), and then create a 500mb reanalysis DJF composite based on those years. I’m on mobile, so I can’t do it now. If someone else can do this, I’d greatly appreciate.
-
Low of 50.2
-
Same - I’d take near normal in the MA and run to the bank as fast as I can
-
Thanks. I was expecting 0.5, so tracking a bit behind
-
Was there a september update of MEI? Want to see how the JA value compares with 0.3 in JJ.
-
Hard to say. Very small sample size, nino + neg qbo is a rare combo. Last time it happened was 2009-10, and before that 86-87 and 91-92. Two big winters, and one ratter. The ratter may be an outlier because of pinatubo. From my research notes: Qbo and MA snowfall correlation is much weaker than expected, but could make the case that -QBO leads to more blocking + biggest KU snowstorms. But a +QBO doesn't necessarily mean lack of snowfall especially if it's not a nina.


