snowlover91
-
Posts
1,277 -
Joined
-
Last visited
Content Type
Profiles
Blogs
Forums
American Weather
Media Demo
Store
Gallery
Everything posted by snowlover91
-
Yeah forky’s stuff belongs in banter but mods won’t do anything about it. Hard to have intelligent debate and discussion with things like that going on.
-
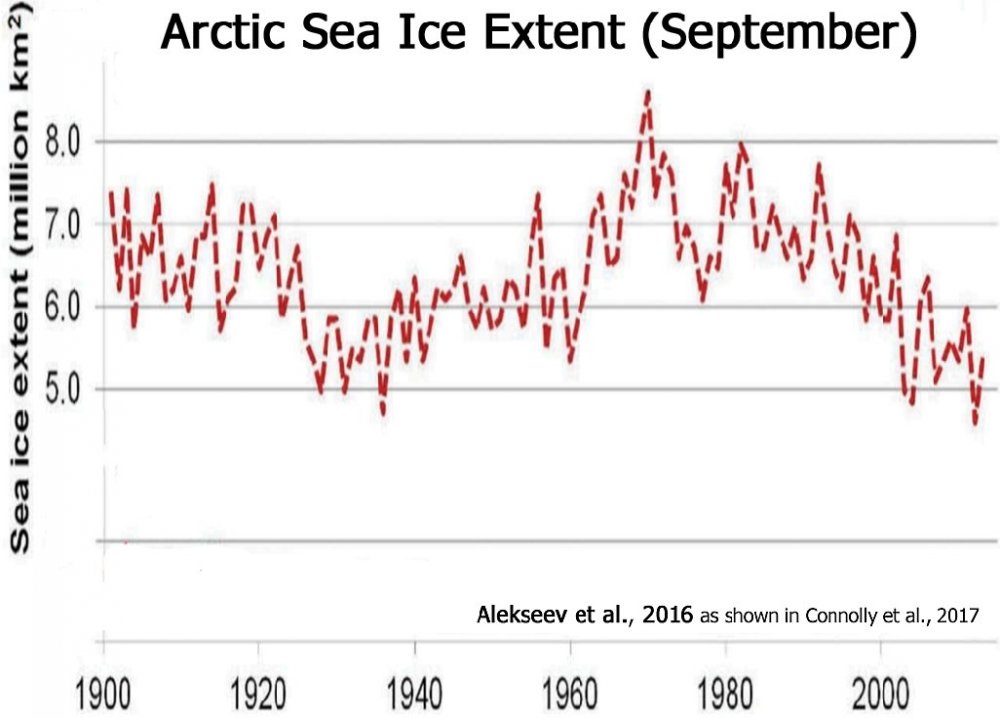
And here's a longer term reconstruction. It's interesting that the satellite era happened to occur right around a peak according to this study. Also note that anything pre-satellite era is prone to large errors but it gives an idea of the possibilities based on various reconstruction proxies which are the best we have to work since satellites weren't around prior to the 70s.

-
Moving the goal posts again I see. You do realize anything prior to the 1970s is going to be much less reliable and a very rough estimate right? You obviously did not even bother to read the article by Judith Curry I posted which addressed issues with ice data prior to the 70s. There have been a wide variety of studies conducted using the same data as NOAA did in theirs with different results and conclusions that conflict with them based on the same data. You should read the link I posted. It goes through exhaustively a wide range of reports, graphs, data sets, their flaws and strengths, etc and analyzes them in detail. To make it easy for you I'll post part of the abstract and let you decide if you're going to do any digging into the details... so far you refuse to do so. "In trying to determine the true extent of sea ice during the period we run the risk of comparing apples-physical observations, and oranges- satellite altimetry, and the different methods employed over the years creates uncertainties over whether each accurately picked up what is ice, what is water covered ice and what is open water. This makes it difficult to determine how modern ice extent compares to the past with any certainty. This paper provides evidence that supports a conclusion that the official sea ice data bases covering 1920-1945/50 appear to very substantially overstate the ice area extent. Some of the thinning of the ice and reduction of glaciers noted today appears to have had their genesis in the period." https://judithcurry.com/2013/04/10/historic-variations-in-arctic-sea-ice-part-ii-1920-1950/
-
Last I checked I was the one posting peer reviewed and scientific articles concerning the subject and you weren't... so who is really posting based off "emotion" right now? You're just like all the rest, you blindly accept AGW and then when challenged to defend your belief you use commonly used, logically fallacious reasons for not debating the topic rather than providing the scientific data to assert your view. I can respect someone who disagrees with me and provides scientific articles to read concerning why they believe what they do but I have no respect for someone who has nothing to go on except the news media reports they hear and what they consider the scientific consensus and fails to do any deep digging on their own.
-
There is plenty of research out there that suggests the arctic ice extent we see today is something that is cyclical and was also seen in the 1920-1950 period. My original statement was also correct; 2007-2018 has seen no discernible changes/trend in ice extent and recent years have seen slight increases compared to the 2007-2012 averages. People such as yourself take 30-40 years of data and assume that CO2 is responsible for everything we see without acknowledging or engaging in intelligent discussion of alternative possibilities that could explain some or all of the changes being seen. You said my 11 years of data is too short term and yet you want to take 38 years of data as sufficiently long enough? Ok then, double standard much? Here's a VERY detailed article listing an abundance of information that indicates the ice levels in this period (1920-1950) were probably similar to what we see today (but not as low as 2007 and 2012). In other words, historically we may have seen ice levels nearly identical to what we are seeing now when the CO2 levels were much lower. This certainly indicates there are natural cycles and variations ongoing, contrary to your flawed assumption that CO2 must be the only possible explanation. https://judithcurry.com/2013/04/10/historic-variations-in-arctic-sea-ice-part-ii-1920-1950/ Reconstructions of the Arctic ice levels indicate some interesting details as well... but sure go ahead and ignore this scientific research since it obviously must be wrong since it disagrees with "consensus science" as you would say. According to this new dataset, the recent period of Arctic sea ice retreat since the 1970s followed a period of sea ice growth after the mid 1940s, which in turn followed a period of sea ice retreat after the 1910s. Our reconstructions agree with previous studies that have noted a general decrease in Arctic sea ice extent (for all four seasons) since the start of the satellite era (1979). However, the timing of the start of the satellite era is unfortunate in that it coincided with the end of several decades during which Arctic sea ice extent was generally increasing. This late-1970s reversal in sea ice trends was not captured by the hindcasts of the recent CMIP5 climate models used for the latest IPCC reports, which suggests that current climate models are still quite poor at modelling past sea ice trends. Nor is it described in previous Arctic sea ice reconstructions such as the Walsh dataset or the widely used HadISST sea ice dataset, although some recent studies have noted similar reversals, e.g. Pirón and Pasalodos (2016) and Alekseev et al. (2016)." https://www.tandfonline.com/doi/pdf/10.1080/02626667.2017.1324974
-
Your posts are on the level of a 2 year old if that. Pretty sad.
-
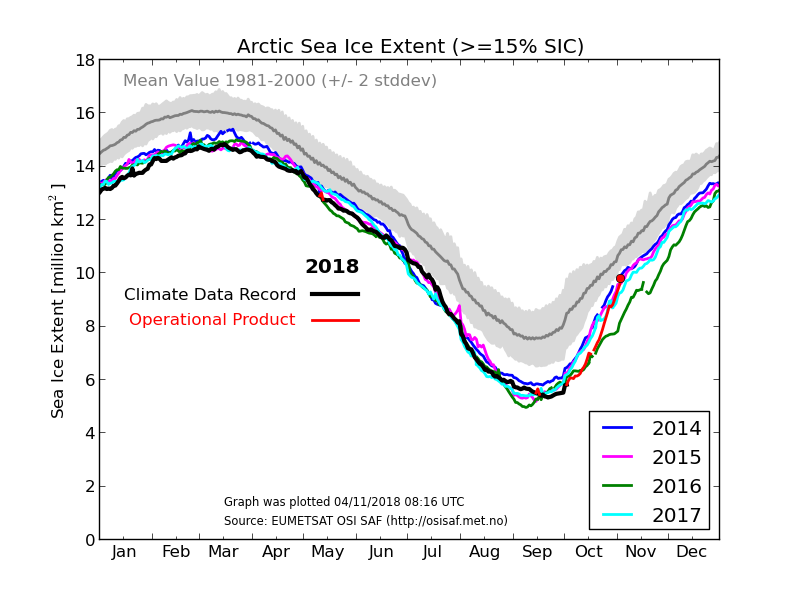
Try reading my post where I explained it.. you seem to have a reading comprehension issue. I said the past 11 years have demonstrated stable ice extent numbers and if anything they've increased slightly. The NSIDC official September average ice extent numbers are listed below. The average September extent has been stable with a slight increase over the past 11 years. The September extent averaged from 2007-2012 was 4.54 and averaged from 2013-2018 it is 4.85, a 6.3% increase. Let's look at it another way and exclude 2012 as a low outlier. Adding up 2007-2011 and averaging them you get an extent of 4.73. Now add up 2013-2018 but exclude 2014 as high outlier and you get 4.78, again a stable but small increase in extent. Add the numbers up these years and see for yourself like I did... https://nsidc.org/cryosphere/sotc/sea_ice.html 2007 - 4.27 2008 - 4.69 2009 - 5.26 2010 - 4.87 2011 - 4.56 2012 - 3.57 2013 - 5.21 2014 - 5.22 2015 - 4.62 2016 - 4.53 2017 - 4.82 2018 - 4.71
-
And yet the September average sea ice extent is up 6.3% over the 2013-2018 period (compared to the 2007-2012 average) despite all this record warmth. Why is it increasing?
-
Typical response of someone who blindly accepts what they consider a "consensus" when there is plenty of research by well respected scientists out there who are saying otherwise or questioning things. Those who pursue science should be willing to change their minds if the evidence and research leads another direction, to ask questions and investigate the unknown. Unfortunately the hindrance to scientific advancement is people like yourself who blindly accept what they consider to be a consensus view and fail to ask the hard questions that might lead another direction. At times significant scientific progress or breakthrough's have been achieved by a minority who went against the "consensus" despite the ridicule they received for questioning the consensus view. Here's a great example below. "Moir’s experience is notable, however, because it shows that, even as one potential Alzheimer’s drug after another has failed for the last 15 years (the last such drug, Namenda, was approved in 2003), researchers with fresh approaches — and sound data to back them up — have struggled to get funded and to get studies published in top journals. Many scientists in the NIH “study sections” that evaluate grant applications, and those who vet submitted papers for journals, have so bought into the prevailing view of what causes Alzheimer’s that they resist alternative explanations, critics say. " https://www.statnews.com/2018/10/29/alzheimers-research-outsider-bucked-prevailing-theory/
-
So other factors that are well known, such as strong winds breaking up the sea ice in the summer, are not factors in the reduced sea ice? The NSIDC disagrees with you along with plenty of other sources. "The spring and summer weather conditions play an important role in the minimum extent and the spatial distribution of ice at the end of summer, and help determine if a particular year will be a record low. For example, in 2007, persistent winds through the summer helped to contract the ice to a new minimum record. In 2012, conditions were less favorable to ice retreat through the summer, although a strong cyclone in early August helped break up the ice and enhance melt. Regardless of weather patterns, the Arctic September ice extent shows a consistent downward trend in extent and thickness over the satellite record." https://nsidc.org/cryosphere/sotc/sea_ice.html Furthermore we only have reliable satellite data going back to the 70s. You can't make an accurate assertion that the reduced sea ice since 1979 is entirely CO2 related or even correlated with it. If we had reliable satellite data for over a century or more than maybe but the truth of the matter is we only have about 40 years of reliable satellite data to go on. Also studies done on the Arctic indicate, based on limited information available such as ship reports, ice charts, local observations, and a blend of other data, that ice coverage in the 1920-1945 period may have been similar to what we see now before increasing and peaking in the 60s and 70s and then heading back to levels seen in the 1920-1945 period. IF one assumes that to be accurate, what is truly "normal" for the Arctic ice extent over a centennial or longer scale and not just a short term one like most people use? See the NSIDC official September average ice extent numbers below. The September extent has been stable to a slight increase over the past 11 years. That's hardly what I would call rapidly decreasing sea ice. If it was rapidly decreasing I would expect these numbers to be around 3.5 or below consistently but they aren't. Also let's do a bit of math here. The September extent averaged from 2007-2012 was 4.54 and averaged from 2013-2018 it is 4.85, a 6.3% increase and far from "rapidly decreasing" as you claim. Sure, there has been a significant drop from 1979-2006 but now things appear to be stabilizing and if anything increasing again. Research indicates the same thing happened with significant ice loss in the 1920-1950 period (similar to the 1979-2006 drop) before stabilizing and then increasing in the 50s-70s. Here's a VERY detailed article listing an abundance of information that indicates the ice levels in this period were similar to what we see today (but not as low as 2007 and 2012). In other words, historically we may have seen ice levels nearly identical to what we are seeing now when the ppm levels were much lower. This certainly indicates there are natural cycles and variations ongoing, contrary to your flawed assumption that CO2 must be the only possible explanation. https://judithcurry.com/2013/04/10/historic-variations-in-arctic-sea-ice-part-ii-1920-1950/ 2007 - 4.27 2008 - 4.69 2009 - 5.26 2010 - 4.87 2011 - 4.56 2012 - 3.57 2013 - 5.21 2014 - 5.22 2015 - 4.62 2016 - 4.53 2017 - 4.82 2018 - 4.71
-
I think it’s relevent here since the CO2 relationship is an important aspect of the discussion and no one really is posting much about sea ice right now since it’s about on pace with recent years so far. I’m not really a fan of starting new threads personally.
-
You would be better off to read more from people more knowledgeable than yourself and post less.
-
@bdgwx Have you had a chance to read this yet regarding CO2? What are your thoughts?
-
@chubbs I'm still waiting.
-
Do you believe that temperatures in the Holocene were lower than today or higher? My intent with reference to the Holocene ice levels was set in the context of stating that the article previously linked (Electroverse) had research and data that corroborated the claim made. Someone was claiming that the content of the article was not accurate and the Holocene studies I cited, among others, would argue that at the very least it's plausible to assert that ice levels in recent decades are higher than during the Holocene. There are tough questions that need to be asked in regards to ice extent. For example, there are periods in the history of the earth where the CO2 concentration is far higher than anything we have today and also periods where it is believed by some that the Arctic was entirely ice free. What natural process caused this to happen and why? Since all the "tipping points" were hit and brought about a warmer climate and ice free Arctic (assuming one believes in the accuracy of the studies), what process reversed things? These are areas of study that I find very little research on which is disappointing because understanding these natural processes are important to a better understanding of our climate and how it works. Regarding CO2 there is plenty of interesting research out there questioning exactly how much it contributes to warming and the best way to measure the effects of the increased CO2. Judith Curry has a very intriguing article dealing with some of these quesitons and need for further research. " "Physics shows that adding carbon dioxide leads to warming under laboratory conditions. It is generally assumed that a doubling of CO2 should produce a direct forcing of 3.7 W/m2 (IPCC-TAR, 2001), that translates to a warming of 1°C (by differentiating the Stefan-Boltzmann equation) to 1.2°C (by models taking into account latitude and season). But that is a maximum value valid only if total energy outflow is the same as radiative outflow. As there is also conduction, convection, and evaporation, the final warming without feedbacks is probably less. Then we have the problem of feedbacks, which are unknown and can’t be properly measured. For some of the feedbacks, like cloud cover we don’t even know the sign of their contribution. And they are huge, a 1% change in albedo has a radiative effect of 3.4 W/m2 (Farmer & Cook, 2013), almost equivalent to a full doubling of CO2. So, we cannot measure how much the Earth has warmed in response to the increase in CO2 for the past 70 years, and how much for other causes. Looking at borehole records and proxy reconstructions (figure 103), it becomes very clear that most of the acceleration in the rate of MGW took place between 1700 and 1900, when very little human-caused GHGs were produced. The rate of warming has changed little in the 20th and 21st centuries, despite the bulk of GHGs being emitted in these past 70 years. However, if the increase in global average temperature over the past 7 decades was mainly a consequence of the rapid increase in CO2, the rate of temperature change should show dependence on the rate of change of the natural logarithm of CO2 concentration. This is because the proposed link between CO2 and temperature is based on a molecular mechanism where every added molecule has slightly less effect than the previous. Even accounting for the logarithmic response of global average temperatures to CO2, the curves for proposed cause and effect are clearly diverging (figure 111). The global temperature anomaly between 1950 and 2017 is not significantly different from a linear trend. On the other hand, atmospheric CO2 increase has been so fast over the 1958-2017 period that the rate of change of its logarithm displays a pronounced acceleration (figure 111). Figure 111. The difference between temperature increase and CO2 increase. Thick black curve, HadCRUT4 13-month centered moving average surface temperature anomaly, relative to 1961-1990, from 1950 to 2017 (November). Source: UK Met Office. The thin continuous line is a linear trendline of the temperature data. Thick red curve, the natural logarithm of the 1958-2017 annual atmospheric CO2 concentration (ppm). Source: NOAA. Thin black dotted lines, visual aid showing the effect of the rapid increase in CO2 concentration on its logarithm. It is proposed that the increase in the logarithm of CO2 is causing the increase in temperature, yet the curves diverge." "The lack of MGW acceleration despite the rapid increase in CO2 over the past 7 decades only has two possible explanations. The first is that the ongoing increase in the proposed anthropogenic forcing exactly matches in magnitude and time an ongoing decrease in natural forcing (figure 104). The second is that MGW responds more to natural causes, and only weakly to anthropogenic forcing. The first explanation constitutes an “ad hoc” match of hypothesis to evidence, requires an unrelated coincidence of decadal precision within a multi-century process (natural cooling started just when we started our emissions), and it is disavowed by the IPCC, that considers natural forcing over the 1950-2010 period too small to have contributed to the observed temperature change in any direction (figure 113). That natural forcing has had no role over a 60-year period is hard to believe. Figure 113. IPCC proposed contributions to observed surface temperature change over the period 1951-2010. IPCC assessed likely ranges (whiskers) and their mid-points (bars) for warming trends over the 1951–2010 period from well-mixed greenhouse gases, other anthropogenic forcings (including the cooling effect of aerosols and the effect of land use change), combined anthropogenic forcings, natural forcings and natural internal climate variability. The observed surface temperature change is shown in black, with the 5 to 95% uncertainty range due to observational uncertainty. The attributed warming ranges (colours) are based on observations combined with climate model simulations, in order to estimate the contribution of individual external forcings to observed warming. Source: IPCC. 2014. AR5. Synthesis Report. Summary for policymakers. Figure SPM.3 p. 6. The second explanation requires only an insufficient knowledge of the response of the climatic system to CO2, and an insufficient knowledge of natural forcings and climate feedbacks. That our knowledge is insufficient is clear and demonstrated every time the “argumentum ad ignorantiam” that “we don’t know of anything else that could cause the observed warming” is used. New research into solar variability mechanisms (see: Climate change mechanisms) has produced hypotheses that indicate that solar forcing is probably not adequately represented in models, and the cloud feedback is essentially not understood yet." "The CO2 hypothesis proposes that changes in atmospheric CO2 levels are the main driver of Earth temperature changes (Lacis et al., 2010). It is based on the spectral absorption and radiation properties of certain gases, of which water vapor is by far the most abundant, and CO2 is a distant second. Water vapor levels are locally determined and highly variable due to condensation. CO2 levels are global, as it is a well-mixed gas that does not condense, and before industrialization it changed very slowly over time from natural causes. CO2 hypothesis considers that water vapor changes are not the driving factor, but a feedback, proposing without clear evidence that the relevant causal relationship is CO2 –> temperature –> water vapor. Past water vapor levels cannot be determined, but in the distant past, cold periods of the planet (Ice Ages) were associated to lower CO2 levels than warm periods, and this is the supporting evidence offered by proponents of the CO2 hypothesis. The interpretation of this evidence, however, is far from straightforward, as changes in temperature also lead to changes in CO2, from huge ocean carbon dioxide stores, because the gas solubility is dependent on temperature, and in well resolved records, changes in temperature generally precede changes in CO2 by hundreds to thousands of years. Another problem with the hypothesis is that it is generally accepted that a progressive decrease in CO2 levels has taken place for the past 550 million years (the Phanerozoic Eon), from ~ 5000 ppm in the Cambrian to ~ 225 ppm in the Late Pleistocene. This decrease does not appear to have produced a progressive decrease in temperatures, that display a cyclical range-bound oscillation (Eyles, 2008; figure 115), alternating between icehouse and hothouse conditions over the entire Phanerozoic. Figure 115. Phanerozoic Eon conditions don’t support the CO2 hypothesis. Schematic representation of glacio-epochs during the past 550 million years in Earth history, and their relationship to phases of supercontinent assembly and break up. Glaciations are indicated and represented by the blue area above the scheme. Estimated global temperature trends (red graph), and variations in atmospheric carbon dioxide (green graph), are indicated, with their general trend as a dashed line. Surce: N. Eyles. 2008. Palaeo3 258, 89–129. The CO2 hypothesis is not new, and can be traced to Arrhenius in 1896, however it did not become the dominant hypothesis to explain temperature changes until the last warming phase of MGW started in the late 1970’s, and temperature and CO2 were both increasing. In the 20th century, while MGW was taking place, humanity embarked in the ultimate experiment to determine the validity of the CO2 hypothesis and set about to burn huge fossil fuel natural stores while industrializing, to raise CO2 levels beyond what the world has had in perhaps millions of years. After 70 years with CO2 levels increasing faster than ever recorded, and above any previously recorded level for the Late Pleistocene, it is time to analyze the results. The world has continued warming as before. The warming during the 1975-1998 (or 1975-2009) period is not statistically significantly different from the warming during the 1910-1940 period (Jones, 2010). The temperature increase since 1950 shows no discernible acceleration and can be fitted to a linear increase. The logarithm of the CO2 increase, however, displays a very clear acceleration (figure 111). A linear relation between supposed cause and effect cannot be established. Sea level has continued rising as before. Its acceleration is not responding perceptibly to the increase in anthropogenic forcing (figure 114). The cryosphere shows a non-cyclical retreat in glacier extent with evidence of acceleration (figure 107; Zemp et al., 2015). The reduction of the size of ice shelves is also unusual (figure 109). The evidence supports a cryosphere response to the CO2 increase. Despite CO2 levels that are almost double the Late Pleistocene average, the climatic response is subdued, still within Holocene variability, below the Holocene Climatic Optimum and below warmer interglacials. Lack of support for the CO2 hypothesis from Antarctic ice cores (figure 110), and from results 1-3 has forced the proponents of the hypothesis to make numerous new unsupported assumptions. They assume that all warming since 1950 is anthropogenic in nature (IPCC-AR5, 2014, figure 113). That past recorded temperatures must be cooler than previously thought (Karl et al., 2015). That the oceans (Chen & Tung, 2014), and volcanic eruptions (Fasullo et al., 2016), are delaying the surface warming and SLR. And essentially concluding that more time is required to observe the warming and SLR acceleration. All these might be true, but the simplest explanation (Occam’s favorite) is that an important part of the warming is due to natural causes, and CO2 only has a weak effect on temperatures. If after 70 years of extremely unusual CO2 levels, a lot more time is required to see substantive effects, then the hypothesis needs to be changed. As proposed it does not call for long delays, due to the near instantaneous effect of the atmospheric response to more CO2. The CO2 hypothesis is at its core an atmospheric-driven hypothesis of climate. There is a significant possibility however that the climate is actually ocean-driven, directly forced by the Sun, and mediated by H2O changes of state. The high sensitivity of the cryosphere to the CO2 increase might actually be an argument for a reduced sensitivity by the rest of the planet. The air above the cryosphere is the coldest of the planet, as it is not warmed much from below, and therefore it has the lowest humidity of the planet. The ratio of water vapor to CO2 in the air above the cryosphere is the lowest and the one that changes the most with the increase in CO2. There is the possibility that air dryness, and the low capacity to produce water vapor in response to warming might be the reasons why the cryosphere is particularly sensitive to CO2, but it implies the rest of the planet is less sensitive. If CO2 sensitivity is highest over the cryosphere (except Antarctica), and lower over the rest of the planet, this points to a negative feedback by H2O response, in its three states, to temperature changes. Antarctica doesn’t show increased sensitivity because it has not been warming through the entire MGW, regardless of CO2. There are multiple possible H2O temperature regulatory mechanisms, and the proposition that H2O only acts as a fast-positive feedback to CO2 changes is too simplistic. The huge water mass in Earth’s oceans and its slow mixing, add a great thermal inertia that resists temperature changes. Atmospheric humidity determines how changes in energy translate into changes in temperature, as humid air has a higher heat capacity and responds to the same energy change with a lower temperature change than dry air. Atmospheric humidity responds very fast to temperature changes through evaporation and condensation. This mechanism is proportional to water availability, and works better above the oceans than over land, and very little over the cryosphere, inversely correlating to MGW temperature changes, that are highest in the Arctic (polar amplification), and lower over the oceans than over land. To that we must add other region-specific temperature-regulating mechanisms by H2O. Deep convection is a tropical atmospheric phenomenon that takes place when the surface of the tropical ocean reaches 26-30 °C. The ocean flips from absorbing energy to releasing it, and convection takes the energy very high in the troposphere, cooling the ocean (Sud et al., 1999) and effectively limiting its maximum temperature. Polar sea ice is a negative feedback that releases heat when it forms in the autumn, then absorbs heat, when it melts in spring, and it acts as an insulator preventing ocean heat loss during winter. Ice-albedo effect is a positive feedback, in that a decrease in ice reduces albedo, driving further ice loss. But ice-albedo feedback is ameliorated because ice extent moves opposite to sunlight (maximum ice coincides with minimum albedo when it is darker), and by the high inclination of the Sun’s rays at polar latitudes, making water more reflective. So the albedo effect is not driving Arctic sea ice melting as demonstrated by the 10-year pause in summer Arctic sea ice loss, after losing 30% of its extent the previous 10-year period. Due to its huge thermal inertia, changes in its three states, cloud condensation, humidity regulation, and effective saturation of IR absorption, H2O is a good candidate to explain the observed resistance of planetary temperatures to increasing CO2 forcing. Only in the cryosphere, where humidity is very low and sublimation a very ineffective change of state, CO2 increase, helped by the albedo effect, is likely driving a non-cyclical melting that affects sea level rise. Conclusions 1) Modern Global Warming is one of several multi-centennial warming periods that have taken place in the last 3000 years. 2) Holocene climate cycles project that the period 1600-2100 AD should be a period of warming. 3) A consilience of evidence supports that Modern Global Warming is within Holocene variability. 4) Modern Global Warming displays an unusual non-cyclical cryosphere retreat. The contraction appears to have undone most of the Neoglacial advance. 5) The last quarter (70 yr) of Modern Global Warming is characterized by extremely unusual and fast rising, very high CO2 levels, higher than at any time during the Late Pleistocene. This increase in CO2 is human caused. 6) The increase in temperatures over the past 120 years shows no perceptible acceleration, and contrasts with the accelerating CO2 forcing. 7) Sea level has been increasing for the past 200 years, and its modest acceleration for over a century shows no perceptible response for the last decades to strongly accelerating anthropogenic forcing. 8) The evidence supports a higher sensitivity to increased CO2 in the cryosphere, which is driving unusual melting and a small long-term sea level rise acceleration. The rest of the planet shows a lower sensitivity, indicating a negative feedback by H2O, that prevents CO2 from having the same effect elsewhere." https://judithcurry.com/2018/02/26/nature-unbound-viii-modern-global-warming/ What are your thoughts on her analysis, questions and conclusions?
-
Scientific study and research in search for the truth is what changed me from an AGW believer to one who is more on the skeptical side. You consistently moved the goal posts and never actually dealt with the main point I originally made which was that the assertion in the article (ice levels in recent decades are higher than they were in the Holocene) was an accurate/plausible statement based on what the research they posted (and other studies) have concluded. If you have evidence that points to more ice in the Holocene vs what we've seen from the 1970s-present than I would be interested in seeing that data, links to the articles, etc. All you've responded so far is with a random graph that doesn't go back to the Holocene and other data that did not directly discuss the time period I was talking about. I'll ask again, can you provide scientific publication links/research that indicates the ice levels in the Holocene were higher than what we've seen in recent decades (including the 1970s)? If you can I would be interested in seeing them, why you think they are correct and discussing the data. So far you haven't provided anything relevant to discuss.
-
Typical response of someone who has lost the debate and has nothing further to add... sad. It's obvious you aren't searching to answer the difficult questions that are raised by scientific research that doesn't agree with the AGW view or that raises important questions worthy of discussion. That's the problem with this thread and a lot who post here. They are all in on the AGW train and any shred of data they can find that seems to corroborate their claims they post but any person who questions it or would provide scientific research indicating otherwise is immediately labeled a denier, singled out and then weak claims/excuses are given when those people no longer can provide a well reasoned, intellectual and compelling argument for why they believe what they do. If you disagree with the research I posted above I challenge you to post some scientific studies that conclude otherwise and why you think they are right. I can appreciate that much more than the cop out response you gave.
-
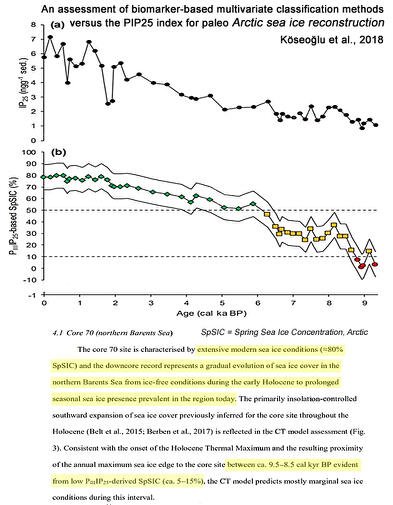
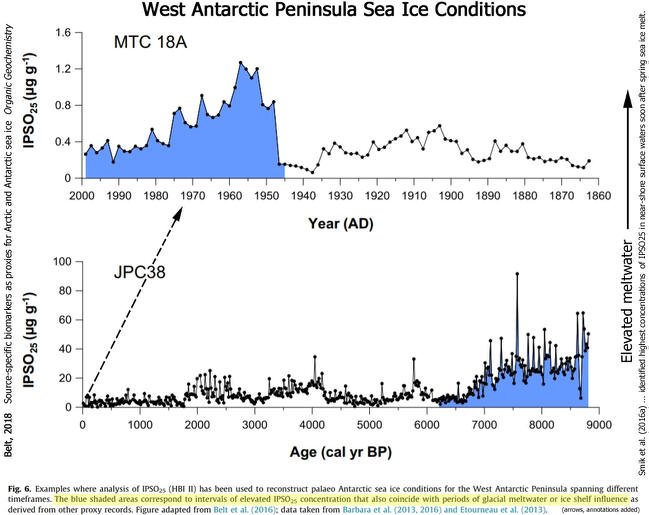
Let's break this down because you've missed the entirety of the original discussion and point I was making and have shifted to something else. You said "First of all your article is advocacy, designed to mislead and not inform." Sorry I didn't post this article and never advocated for this website as a reliable source. What I did say is that the content of the article and the assertion they make is quite plausible based on what we know about the Holocene. Yes, the article title was clickbaity and could be a bit misleading but if a person reads what they actually said in the article it's obvious they are comparing the past few DECADES of ice coverage (which would go back even to the high levels of the 70s and 80s) and saying the past few decades have higher levels of ice in the Arctic and Antarctic than there has been for nearly 10,000 years. Here is their exact quote for reference and context, "It is often claimed that modern day sea ice changes are unprecedented, alarming, and well outside the range of natural variability. Yet scientists are increasingly finding that biomarker proxies used to reconstruct both Arctic and Antarctic sea ice conditions since the Early Holocene reveal that today’s sea ice changes are not only not unusual, there is more extensive Arctic and Antarctic sea ice during recent decades than there has been for nearly all of the last 10,000 years." Now let's examine the bolded portion and let's assume one accepts biomarker proxies as valid. You specifically point out the one location, the Barents Sea proxy, and say that this data cannot be used to compare current conditions to those in the past. With the understanding that the article was specifically talking about RECENT DECADES than the 1981-2010 years would certainly fit into that context since those are recent decades and the data from that study did indeed indicate ice-free conditions in the Holocene vs recent decades of ice data where the average is much higher. Additionally in the context of their original quote the electroverse artice doesn't limit biomarker proxy data to just one single proxy. There have been plenty of other biomarker proxies done at various sites across the Arctic circle corroborating the unusually low or non-existent ice during part of the Holocene. There are plenty of studies with biomarker proxy data that lend credence to this view. Whether you choose to accept them or offer alternative views from the same period is another discussion; the point is there is evidence that within the context of their statement lends plausibility to what they claimed. Your second statement and proceeding argument is also incorrect because you are arguing something that I never claimed. You are assuming that I am saying 2018 sea ice is higher than the Holocene and that it's at record high levels. I'm not. I said within the context of the original statements in the electroverse article, ie the past few DECADES of sea ice, the Arctic and Antarctic have been at levels much higher than the Holocene if one accepts those studies as valid. They were comparing the past 30-40 years of sea ice levels to that of the Holocene, period. Here is their statement again for reference from the article, "It is often claimed that modern day sea ice changes are unprecedented, alarming, and well outside the range of natural variability. Yet scientists are increasingly finding that biomarker proxies used to reconstruct both Arctic and Antarctic sea ice conditions since the Early Holocene reveal that today’s sea ice changes are not only not unusual, there is more extensive Arctic and Antarctic sea ice during recent decades than there has been for nearly all of the last 10,000 years." Notice the key in their argument, again, is recent decades. I can't stress that enough because in your argument you are saying 1981-2010 ice levels have no relevance when the article itself was saying that recent decades, which would include 1981-2010, have ice levels that are higher for nearly all of the past 10,000 years. The context and specific wording of this article is important to read and not just the headline and then making assumptions. Plenty of people read the headline of an article and then make assumptions without bothering to read the context and content in which the article is set. I'm not advocating Electroverse as a newsworthy or reliable site. The purpose of my argument is that the original article posted about the Greenland SMB gain is quite accurate and can be easily verified. The bit of info they included about how blocking changes during solar min and periods of cold is interesting and something that can be debated. The second article that had the clickbait title about the Arctic and Antarctic is, within the context of the article, one that is entirely plausible based on biomarker proxy data and other studies that show significant melting during the Holocene and significantly reduced to ice-free levels that occurred during it. The past few decades, including the 70s and 80s, would have much higher ice levels than this period of the Holocene if one accepts the validity of the biomarker data and other research that has been proposed in various studies. Here's a bit of info from other studies that would lend support to the idea below. "Arctic Ocean sea ice proxies generally suggest a reduction in sea ice during parts of the early and middle Holocene (∼6000–10,000 years BP) compared to present day conditions." https://www.sciencedirect.com/science/article/pii/S0277379113004162?np=y Studies done in the Swiss Alps found this "The 10Be concentrations measured in eight new samples from proglacial bedrock indicate that this area close to the current glacier terminus was ice-free for at least ~5000 years during the Holocene." https://agu.confex.com/agu/fm18/meetingapp.cgi/Paper/360791 Mapping of northern Greenland concluded the following, "The climate in the northern regions has never been milder since the last Ice Age than it was about 6000-7000 years ago. We still don’t know whether the Arctic Ocean was completely ice free, but there was more open water in the area north of Greenland than there is today,” says Astrid Lyså, a geologist and researcher at the Geological Survey of Norway. http://www.ngu.no/sciencepub/eng/pages/Whatsup_20_10_08.html A study in the Alps found the following, "Subfossil remains of wood and peat from six Swiss glaciers found in proglacial fluvial sediments indicate that glaciers were smaller than the 1985 reference level and climatic conditions allowed vegetation growth in now glaciated basins. An extended data set of Swiss glacier recessions consisting of 143 radiocarbon dates is presented to improve the chronology of glacier fluctuations. A comparison with other archives and dated glacier advances suggests 12 major recession periods occurring at 9850- 9600, 9300-8650, 8550-8050, 7700-7550, 7450-6550, 6150-5950, 5700-5500, 5200-4400, 4300-3400, 2800-2700, 2150-1850, 1400-1200 cal. yr BP. It is proposed that major glacier fluctuations occurred on a multicentennial scale with a changing pattern during the course of the Holocene. After the Younger Dryas, glaciers receded to a smaller extent and prolonged recessions occurred repeatedly, culminating around 7 cal. kyr BP. After a transition around 6 cal. kyr BP weak fluctuations around the present level dominated. After 3.6 cal. kyr BP less frequent recessions interrupted the trend to advanced glaciers peaking with the prominent ‘Little Ice Age’. This trend is in line with a continuous decrease of summer insolation during the Holocene." http://journals.sagepub.com/doi/abs/10.1191/0959683606hl964rp Or this paper which blends a wide variety of study material to reach this conclusion, "The combined sea ice data suggest that the seasonal Arctic sea ice cover was strongly reduced during most of the early Holocene and there appear to have been periods of ice free summers in the central Arctic Ocean. This has important consequences for our understanding of the recent trend of declining sea ice, and calls for further research on causal links between Arctic climate and sea ice." https://www.sciencedirect.com/science/article/abs/pii/S0277379110003185 Again these are just a few examples. There are plenty out there indicating the Holocene ice levels were much lower than what we've seen in the past few decades including the 70s and 80s when ice was higher than it is now. My view is that earth is bound by cyclic changes that occur over time similar to what is thought to have occurred in the past with periods of higher and lower ice levels. Furthermore based on some of the data we have out there, the present day ice levels in the Arctic may have had similarly low levels back in the 1920-1945 period and it then subsequently stabilized and recovered in the following decades before another period of ice loss started around 1980 or so. Since CO2 was much lower in the 1920-1940s, what explains the significant reduction in sea ice in the Arctic (not to mention the brutal heat waves the US saw in the 1930s that still haven't been matched today with far higher CO2)?
-
Here's the problem I have, the original electroverse article cited was discussing the significant increase in Greenland SMB and normal summer 2018 melt. It then discussed the possible relationship between a solar minimum, blocking and how cold is distributed along with blocking highs/warmth that forces this cold to the south. I really didn't see any issues with that original article cited by warm nose and it was an interesting read. The second article that you linked did have a clickbait title. However upon reading the content of the article, the papers linked do indicate ice levels we see today are likely higher than what occurred during the Holocene. Some scientific studies even posit that the Holocene was ice-free for a time or had minimal levels of ice. Considering how warm scientists think periods of the Holocene were it's not hard to believe that. I don't know who runs the electroverse site and have never heard of it before until this thread but my main point was that the Greenland SMB article had accurate information and there was no need for someone to attack it simply because the website itself has some questionable tactics or info in other places. Hopefully that makes sense.
-
For me personally I believe everything here on the earth operates in cyclical periods of decades, centuries and millennia in which a combination of various atmospheric cycles, tipping points and other phenomena combine to push the earth either significantly warmer or colder. It is certainly possible that manmade CO2 is enhancing these cycles as well but at the end of the day shifts in the ice could be predominantly explained by some natural cycles. There are various postulations as to what, why and how natural cycles affect ice growth over extended periods that are quite interesting and worthy of further research. The problem is so much attention is given to AGW that many may be missing the real drivers for important aspects of our climate in the process. IMO far too much research is being devoted to AGW as the sole cause and not enough exploration into alternative possibilities.
-
And the charts I posted that were referenced in the study both showed the past few decades have higher ice extent than any other point in the past 10k years. So which chart is right and which is wrong and why? One study doesn’t prove something as correct or incorrect. The evidence presented by the two papers that the article cited do in fact indicate the ice extent of the past few decades is greater than any period in the past 10k years or so. Whether you choose to accept them or offer up alternative views is up to you but simply put the article you cited does in fact offer a plausible scenario.
-
What are you even trying to prove with this graph? You do realize your graph doesn’t include the Holocene period we are talking about, right? I’ll make it easy for you. Here’s the graphs cited in the electro article or the one they linked. Their assertion is that in recent decades the ice levels are higher than they were during the Holocene. The research done by the scientists who made this graph would indicate their claim is plausible.
-
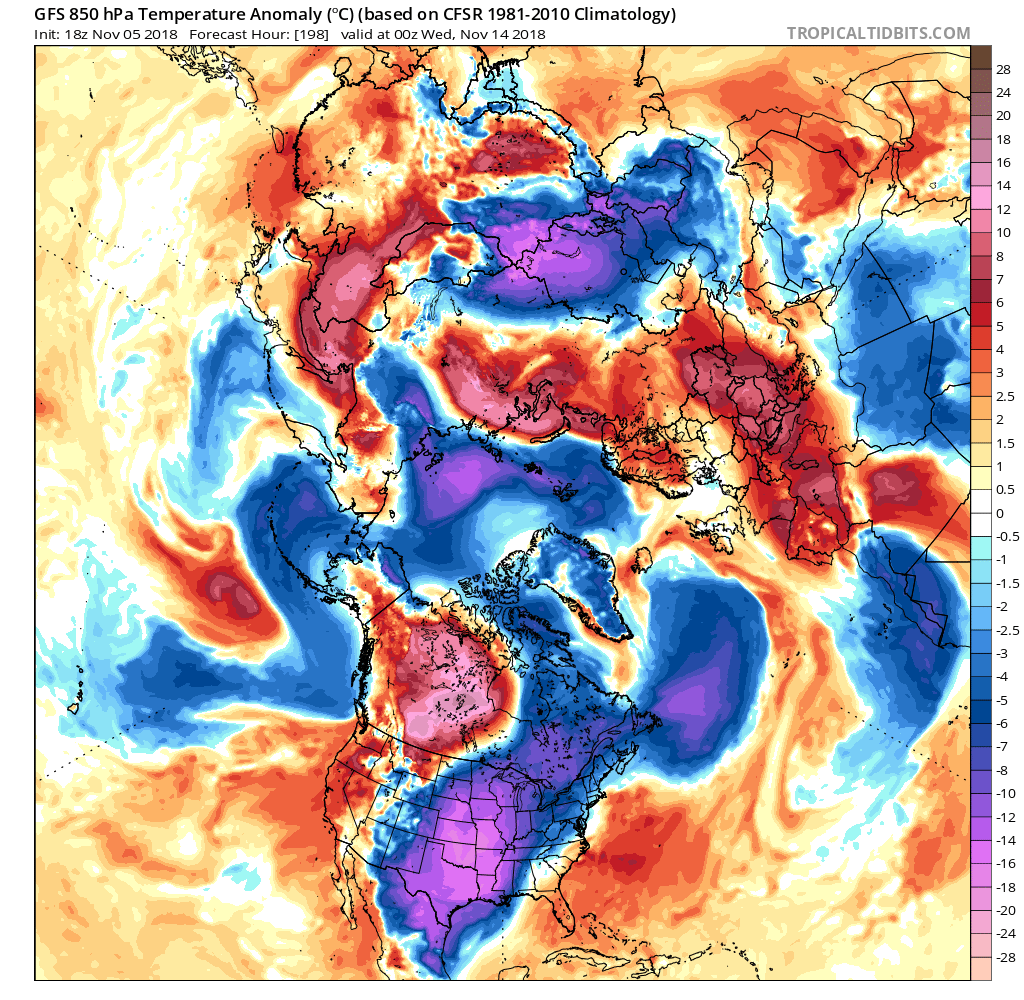
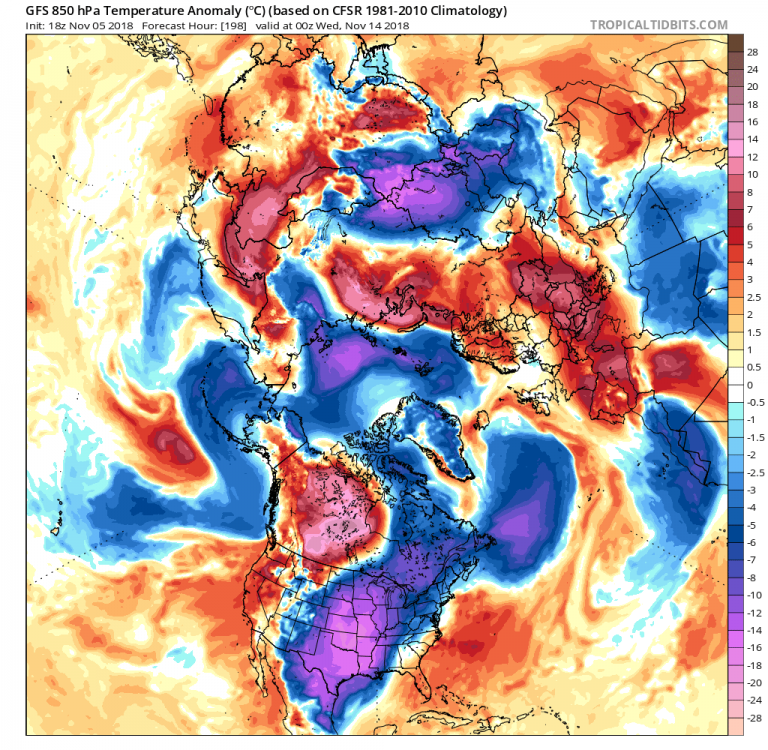
What’s amazing to me is how active this thread was as we neared the bottom of sea ice levels in the Arctic but now with the ice extent rapidly rising it is rather quiet. FWIW we are about to pass both 2014 and 2015 for Arctic ice extent and this will likely continue as models actually indicate some normal to BN temps over the arctic circle in the coming days. 850s are forecast to cool well BN across most of the Arctic circle in the coming days.
-
Again you failed to read the context of the article. It states this at the beginning to provide the CONTEXT for the headline which is key. "It is often claimed that modern day sea ice changes are unprecedented, alarming, and well outside the range of natural variability. Yet scientists are increasingly finding that biomarker proxies used to reconstruct both Arctic and Antarctic sea ice conditions since the Early Holocene reveal that today’s sea ice changes are not only not unusual, there is more extensive Arctic and Antarctic sea ice during recent decades than there has been for nearly all of the last 10,000 years." At the end of the article it links to an article with a fuller explanation with various studies. https://principia-scientific.org/arctic-antarctic-sea-ice-now-at-historic-high-levels/ Notice the entire context of this article is set in "recent decades" in contrast to the past 10,000 years. Within this context, assuming one believes the studies that indicate much less ice in the Holocene period, the current ice levels of recent decades are indeed much higher than in the past warmer periods like the Holocene. Yes the headline is a bit of "click bait" but when you read the article and the CONTEXT in which it is set it actually does make sense.
-
Yep there are various views on why the Antarctic has overall been stable to gaining a small amount in regards to the ice extent. The most popular view I've seen argues for ozone depletion but no one really knows for sure especially since climate models have completely missed these changes. The year 2014 we saw a big peak with the ice extent here and then things have dropped off a bit from there. It remains to be seen if these are just cyclical changes or what exactly is driving them but overall from 1979-2017 the trend has been for a slight increase in ice extent gain.