Jump to content

psuhoffman

Members
  • Posts

    27,457
  • Joined

  • Last visited

Everything posted by psuhoffman

  1. Thank you. 2 thoughts wrt what you noticed (I noted it also). First it's hard to draw conclusions about that because what those numbers don't show is the frequency of those patterns. If a pattern is more rare it might be the best pattern but have less instances of snow simply because there were less opportunities compared to a more common but less productive pattern. That said, I do think there is also a bit of "too much of a good thing" going on with a -EPO/+PNA full latitude ridge. In a vacuum a -EPO/+PNA/-AO/-NAO are the best phases of each of the 4 major indexes. But when in combination it's not always that simple. When we have a really strong -NAO for instance, some of our biggest snowstorms happened with an unfavorable PNA/EPO combo, but in reality that "unfavorable" pattern out west trying to force ridging into the cold locked into the northeast is what created the big storm. Without that we would have been cold/dry with a weak wave running off the southeast coast. Time of year also matters...we typically need the epo/pna more early in the season and the nao more late. Without any NAO help...by far our best look is that east based EPO ridge nosing over the top creating a broad flat trough under it across the lower 48. The NAO changes the equation. The more blocking (especially later in winter) the less we need EPO/PNA help. Enough blocking later in the season and we actually dont want a big wester ridge. So there really is no one perfect look that is universal across the whole winter season. That study I did was just step one is a larger plan. Right now I have no time for anything. My less frequent posting lately is not just because the weather sucks... its more that this is a busy time of year for me. December/January I have a lot of free time. Between Holidays, end of semester and PD breaks there, and testing I have a solid 2 months with not much going on other than my normal teaching duties and even those...I only have a normal class to plan for or stuff to grade about half the time. Right now is one of the times of year I am slammed with observations, curriculum planning meetings, summer school planning, bridge project scoring, Test prep planning, debate events... I just don't have time. But I have way more in the plans. I just found out I might be getting a rather significant increase in my responsibilities wrt to my summer position so I may not get to all of this but I should still have more time to at least start this list. In addition to what I did in December, I want to do a similar study for our area. Then I also want to look month by month and break down the dominant patterns from 1950 on to see the frequency of each pattern. I also want to break down those splits by month to confirm which patterns work best by each month. Once done I would be able to determine what the odds of snowfall in any given pattern are (roughly) by month. That would make what I posted here a lot more useful. But that will take a lot of time I don't have right now. If I don't get it finished this summer I probably will next December during my next "down time" period.
  2. @Maestrobjwa CCB refers to the cold conveyor belt. I think to fully explain this I should do a quick overview of how most mid latitude cyclones work First of all low pressure typically forms along the boundary of cold and warm air...as air moves across the boundary to try to bring equilibrium to the imbalance. This movement of air creates lower pressure where the air is vacating faster than it is filling in. A low can really intensify when an area of divergence in the upper levels crosses over the surface area of lower pressure. These areas of divergence are typically found in front of either long-wave troughs or Rossby waves or smaller shortwave troughs embedded in the flow. This divergence aloft creates lift below it to "fill" the void and this lift (rising air) from the surface lowers the pressure as the lift outpaces the rate air is filling the surface void. On top of that the rising air cools and condenses causing precip but that process creates latent heat release which causes more lift (warm air rises). This creates a feedback loop that intensifies low pressure. Early in the life cycle of a developing low pressure area they are typically just waves along the temperature boundary Precipitation breaks out along the boundary where the flow ahead of the developing low pressure begins to cross the "boundary" to the north of the wave. The warmer air crossing the boundary has to rise over the denser colder air and this lift creates WAA (warm air advection) precipitation. (rising air cools and condenses creating precip) Showery precip usually exists along the cold front to the south of the low where cold air is undercutting the warmer air cause it to rise...but since this displacement happens much faster the precip there is sometimes more intense (thunderstorms or convective showers) but short lived. Many waves never make it beyond this stage if there are factors inhibiting their intensification. But if a low can amplify and deepen it will develop a circulation at several different levels As it develops this structure...the cold conveyor belt begins to bring moisture that is to the east of the low from the warm conveyor belt to the west of the low. As this happens the storm will begin to develop the classic comma head structure seen below. That precip to the west of the low track is often commonly called the "CCB" since it is a function of a healthy system developing precip in response to the cold conveyor belt transport of moisture west of the low track. Additionally the precip to the west of the surface low track is not driven by WAA as much as other forces and so can have a colder thermal profile, especially in marginal events. Seen above there the dry conveyor belt begins to cause the "dry slot" that you often get near the track of the surface low pressure. Below I have zoomed in on what is going on in the "CCB". This region in the "CCB" develops a deformation zone...a region where the atmosphere is being pulled in different directions at different levels. The convergence of the DCB, CCB, WCB, as well as the sheer at different levels created by the mid and upper level low pressures creates instability in this area. Where the moisture convergence from the CCB bringing moisture in off the WCB meets this instability you can get intense snow bands. This is what they call the "deform" band. One of the best examples of a deform band was from the February 2006 storm. This radar is from the NYC area but this same band impacted our area...I think the Columbia MD area got 20" because they were under this band for several hours. You can see on the radar loop the forces I described above at work. Later in the life cycle of a mid latitude cyclone, because the cold air often outpaces the advance of the warm air...the cold catches up and the low ends up cut off from the warm air advection...at this point we say it has occluded and it looks like this. At this stage the intensification period is over and the storm typically begins to weaken. But during this stage you can often see snowfall wrapped up even under the surface low instead of displaced to the NW of it. Hope this helped some. You can ask any follow up questions also...others feel free to add anything to this.
  3. It’s pretty obvious that storms like Feb 83, Jan 96, Feb 03, Dec 09, Feb 10, Jan 16 are roughly our max potential. (And a potential of 24-36” region wide is nothing to scoff at). There are lots of colder places that would be envious of our top end potential. The exact placement of the snow max will depend on meso banding but those storms were all examples of max potential around here. 2003 was the oddball in that it lacked blocking but it had a monster 50/50 to compensate. The rest had blocking.
  4. A little but it wasn’t that far off from the pna ridge/+AO/NAO composite look. We definitely got lucky that a nice vort was passing at exactly the right time given how transient the pna ridge was. Our window was like 12 hours. But there were only 6 of those type storms so it’s not a high probability look but not unheard of. Of course yesterday’s storm wouldn’t show up in my sample because it wasn’t significant in the cities. In our areas we can luck our way to some snow a lot easier in flawed setups.
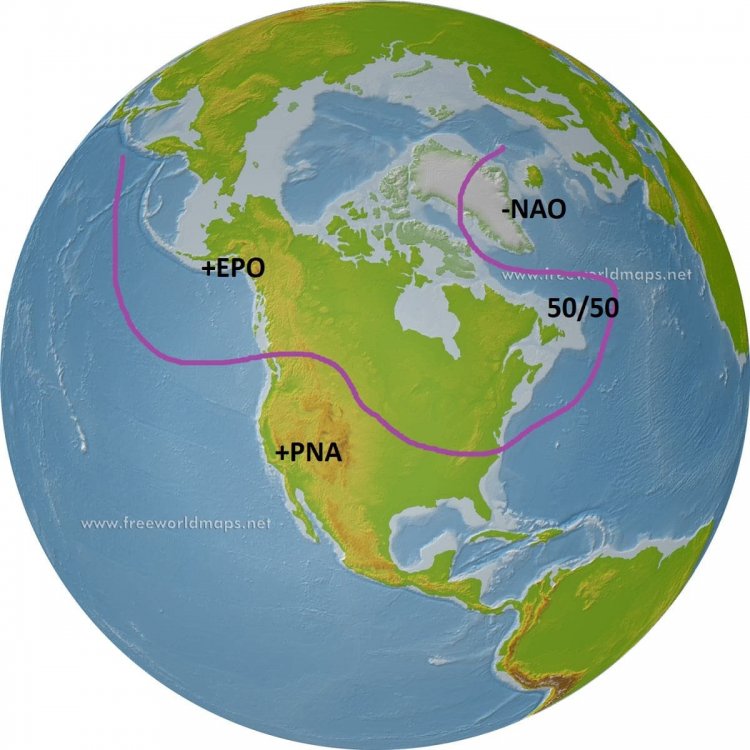
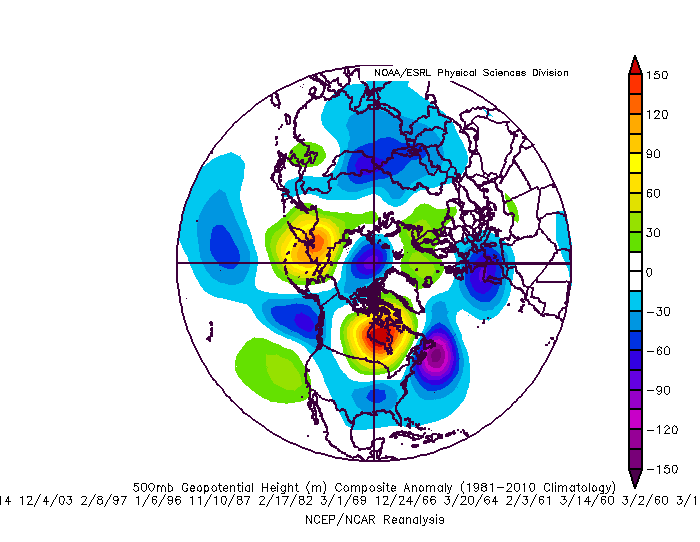
  5. Sure but I am not going to spend as much time studying our fail patterns as I did our winning ones. I just don't hate myself that much. But I know off the top of my head what years and patterns really suck balls and put together a quick profile of some of the worst ones. First of all... while we can score a fluke snowfall in many patterns...the truth is there are way more looks that just don't work out often then there are ones that do. We are south of the mean northern stream jet in winter most of the time. It takes an anomalous pattern to get snowfall. The warm wet cold dry thing is real. Often in winter the only time the cold boundary gets south of us is after a wave passes and the flow behind it presses the boundary south. But without a favorable pattern the return flow ahead of the next wave is likely to press the boundary back to our north before it gets here. Basically the average storm track is to our north. But most patterns with some luck and some bootleg factor (like a Hudson ridge) working for us we can occasionally get snow. But most patterns without luck we can easily go with no snow as well. Bad Luck On top of that...sometimes we can just get unlucky in a perfect pattern. A storm gets suppressed, the next one is just slightly too warm, another develops off the coast...next thing you know we wasted a 2 week perfect pattern. The winter of 2007 would fall into that category. Look at this H5 pattern for Feb March was pretty good also for a good portion of it. THe first half was pretty crappy and I will use December 2006 as an example of a crap look later but even with a wasted Dec into Jan if you told me that would be our look for Feb and Mar I would take my chances. ANd while we did get some snow...we didn't cash in on the full potential and so the winter went down as a below avg snowfall year. There were 2 blockbuster coastals that year...one in Feb and one in Mar and both were just SLIGHTLY too warm at the mid levels and the big snowfall ended up a little NW of us. THere was one storm that had big potential but a PV lobe at the wrong time squashed it. And a couple others just failed to reach potential and ended up minor snowfalls. We mostly wasted a really good pattern. That has happened other times as well. On top of that, even more common, we waste a look that is OK, not great but definitely not awful and end up with a really bad result. YOu can look at the H5 for a year like 1981 and say...that looks ok. Not epic but you wouldn't think a horrible dud winter was coming, but it was. Truth is snow here is anomalous and luck wrt timing and discreet features that fall under the pattern level have a LOT to do with our results. Call it luck or chaos but pattern is only half the fight. So all that said I will focus on a couple patterns that just really really really suck and give us almost no chance for a significant snowfall, luck be damned. Some general observations First of all, any pattern that features a +NAM state without either a perfectly placed east based EPO ridge...or a really favorable PNA ridge is a fail pattern. We can score in a +NAM pattern but only with pacific help. If the AO/NAO are both awful (like right now) and the pacific inst in a very favorable state...that is a total fail pattern. That is because anything that pumps a SE ridge without resistance up top will not end well here. Additionally there is seasonal variance. The NAO is way more important later in the season. As the temperature profile tends to get colder across N. Amer later in the season and wavelengths start to shorten in Feb, and water temperatures cool along the coast, blocking on the atlantic side can influence and overcome the pacific pattern more. Early in the season we really need pacific help to have a good chance. But bad looks can be very temporary or transient so what patterns tend to give us that and lock in for an extended period of time. I assume that is what you mean because we can have a bad week even in the best winters...but what looks spell doom for a really long time and eat up a big chunk of our winter window. AK Vortex Pattern The first is an AK vortex pattern. This one is especially a killer early in the season. It can be overcome from Mid Jan onward but only with NAO blocking. Early it tends to be a problem even with blocking. Without blocking this look is a total fail pattern all winter long. You pointed out earlier that 2012 was a good example. December 2006 was also a perfect example. The last 10 days also featured this problem. I have the h5 below...the issue with this pattern is the flow under the AK vortex floods the continent with warm pac air. Without ideal blocking on the NAO side that mild air will flood across and not only will we be warm but there won't be any cold air anywhere near us. This pattern can take a LONG time to recover from. Even once the pattern improves we can waste a week just getting cold back onto our side of the hemisphere. Dec 2006 January 2012 Last week... Pac Ridge +NAM pattern The next one is the one we are about to go into according to all guidance. How long it lasts is yet unknown...but this is the absolute worst pattern we can possibly ever get into in winter, both because of how bad it can be...numerous examples of completely snowless months with this pattern...but also because of how stubborn it can be. Frankly this is the most common season destroyer of all the patterns. This one accounts for the majority of our total fail winters. This is the composite of many of our total fail years that fit this description, the Jan/Feb of 1950, 1951, 1959, 1973, 1989, 1990, 2002, 2008, 2013. All of these were single digit snowfall years at BWI except 1990 but all the snow fell that year BEFORE the pattern set in early January. look familiar? This one is real simple...that pac ridge digs the trough out west...which pumps the ridge in the east. Simple wave physics. Without extreme blocking to offer resistance that will push the thermal boundary well to our north. The reason this pattern can be so stubborn is an anomalous central pac ridge is usually a primary effect not a secondary effect. Meaning usually it is being driven by the tropical pattern in the central pacific and Maritime Continent regions. It's not a result of something that caused something that caused something...and so on. It is the direct result of a very major driver of the global pattern. IF that driver doesn't change...that ridge can park there for months. And that ridge loads a wave pattern over north america that sucks for us. It can only be overcome with extremely -NAM state to suppress the SE ridge. Too much of a good thing The last one I will cover that has accounted for some total crap years is the "too much of a good thing" pattern. I almost didn;t include this one as its a weird anomaly. This one is rare, usually only happening during a super nino. And if you just glance at the h5 it doesn't look that bad. And...it does increase the potential of a blockbuster storm. We had this pattern a few times and sometimes we get lucky and time up just enough cold to get a HECS. But if we dont....we can go long stretches simply too mild to get snow. The best examples are 1983 and 1998. Yea we had the HECS in 1983 but imagine if that one storm had not hit. The rest of the prime part of that winter was a total wasteland. Basically like 1998. The issue is hard to see just from h5 but its kinda there. The super nino. That pac trough is actually a bit much...if it was a little less anomalous and near the Aleutians not so expansive it would be perfect, and that is the typical moderate nino look. But in this case that extreme trough in the pac is flooding the CONUS with mile air. THe trough over the gulf is the juiced up STJ but the flow under the pac trough combined with the ridging across the US/Can border has flooded the US with mild air and cut off any cross polar flow to press cold into the pattern. The result is just a mild pattern with a good storm track that yields cold rain. It's not a mild look. Just not cold enough to snow. Pretty miserable really. This one suck but its not that common so I wouldn't worry too much. Plus it gives us the best chance of all the fail patterns at a fluke storm, and a BIG one at that. But since 1998 was one of our worst winters I figured I would throw in an explanation of why. There are other fail patterns...pretty much any look with a SE ridge and no blocking... but those first 2 are the main ones that can last a long time and wreck months or even a whole season. If anyone wants to add more great but I am depressed enough now so have a good night. Hope this was what you were looking for.
  6. As CAPE said this is a great look for the west. Cold and snowy. Could be too cold for the northern ski resorts but places like Colorado when it’s sunny isn’t that cold. I skied Stramboat when it was -25 with the sun out and it actually felt ok. During a storm with wind at -25 though...forget it. But Alta in Utah is already up near 200” on the year with 20-30” expected in the next 72 hours. Yes they get a lot of snow but that’s still a great start with their snowiest months yet to come. I know Revelstoke was doing pretty good also last time I checked. I’m heading out there either the last weekend in January or the first 2 weekends of Feb and I’m salivating already. With this pattern they should be found great with all backcountry chutes and bowls open. ETA: you have to get pretty far north in the east for that to be a good look. Depending on how much the boundary can press and where the TpV near Greenland is it CAN be a good pattern for the mountains in northern New England. Northern NY Vermont and Maine. But if the TPV isn’t far enough south this can be a rain pattern even up there. I was up around Quebec City in the winter of 2008 (comp year to this coming pattern) and it rained all the way to where I was near Le Massif at 3000 feet elevation 40 miles north of Quebec City in mid winter. That’s about as rare a feat for them as a warning snow is for us.
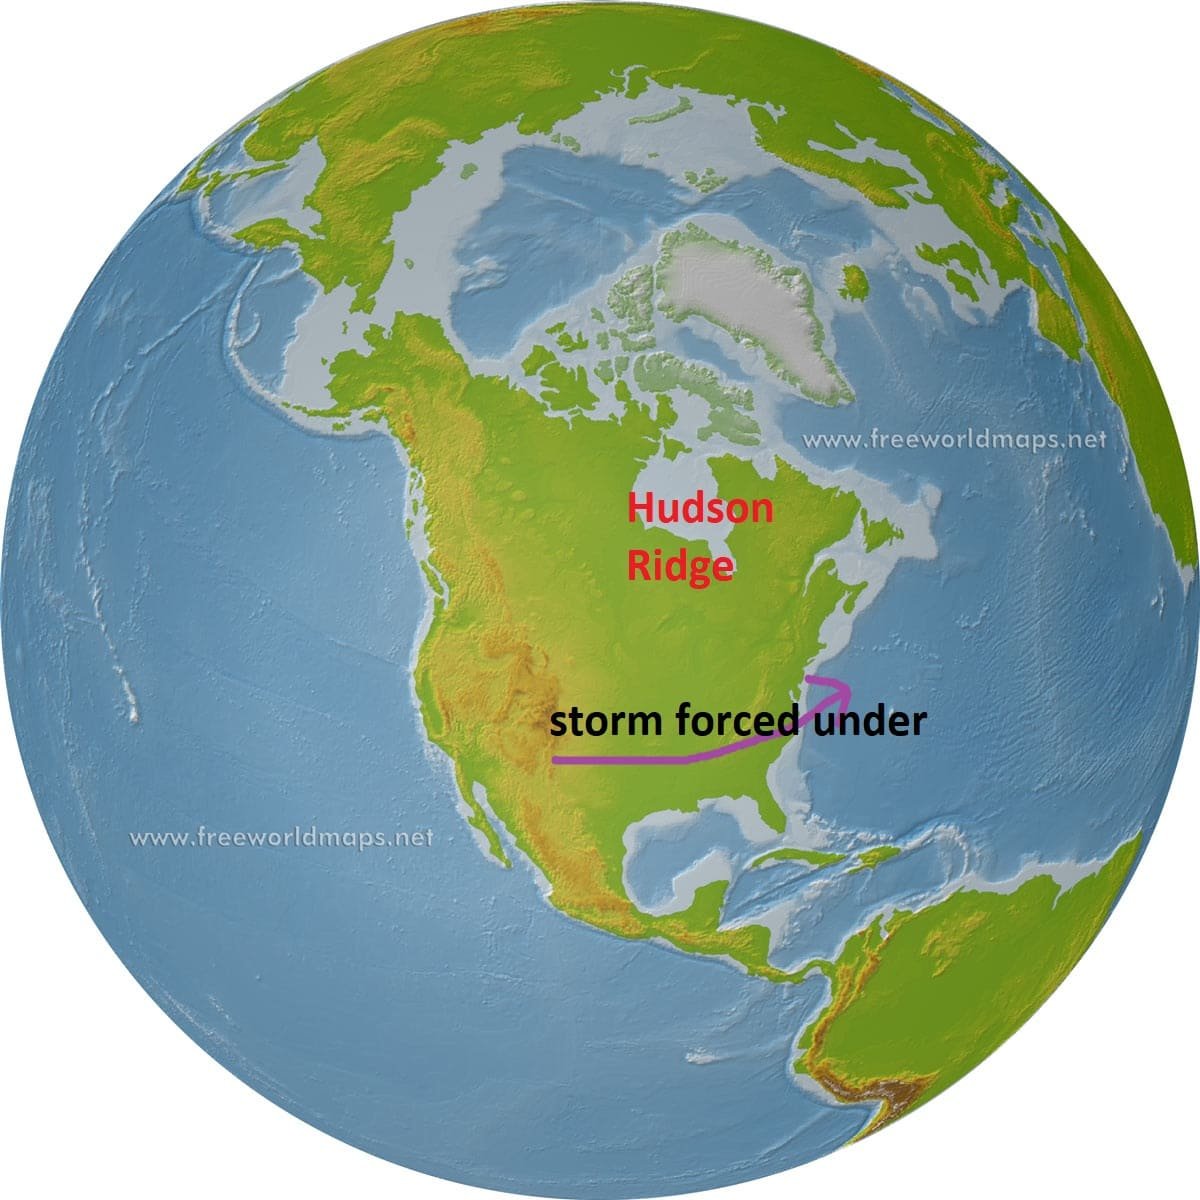
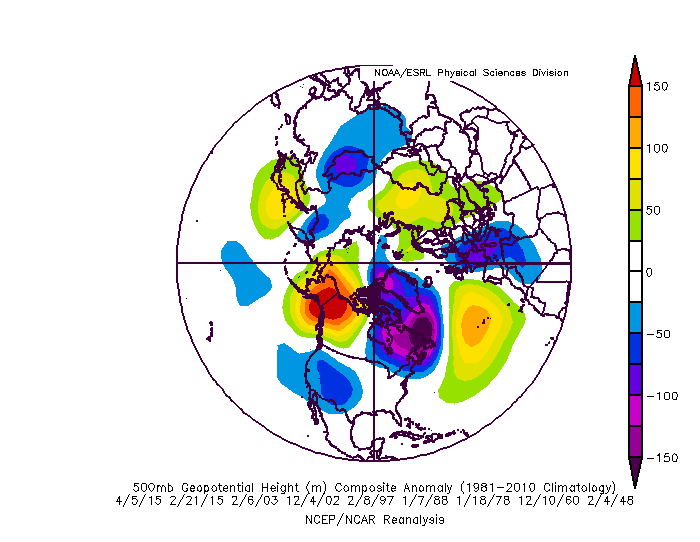
  7. PNA RIDGE Snowfalls +EPO/+PNA/+AO/+NAO snowfalls 6 I only got one more profile done today but figured I would add a PNA ridge pattern snow composite since that seems to be what we are working with for our only real shot at snowfall next week. These were the 6 storms where the only thing really working for us was an ideally placed PNA ridge. This composite is centered for the day the storm was starting. You can see the ideal placement for a PNA ridge there can sometimes overcome what is otherwise a pretty craptastic pattern there. I did notice the ridge axis is slightly west of what is common for snowstorms when we have some blocking. THat is likely because without any NAO blocking the pattern is more progressive and we want the PNA ridge slightly west of where we normally see it in most snow events. It's not that far off...normally it would be closer to Boise then Tahoe but still its noticeable. I guess with the coming "threat" if we want to call it that...if we see a ridge looking like that out west at the perfect time it COULD be a legit threat.
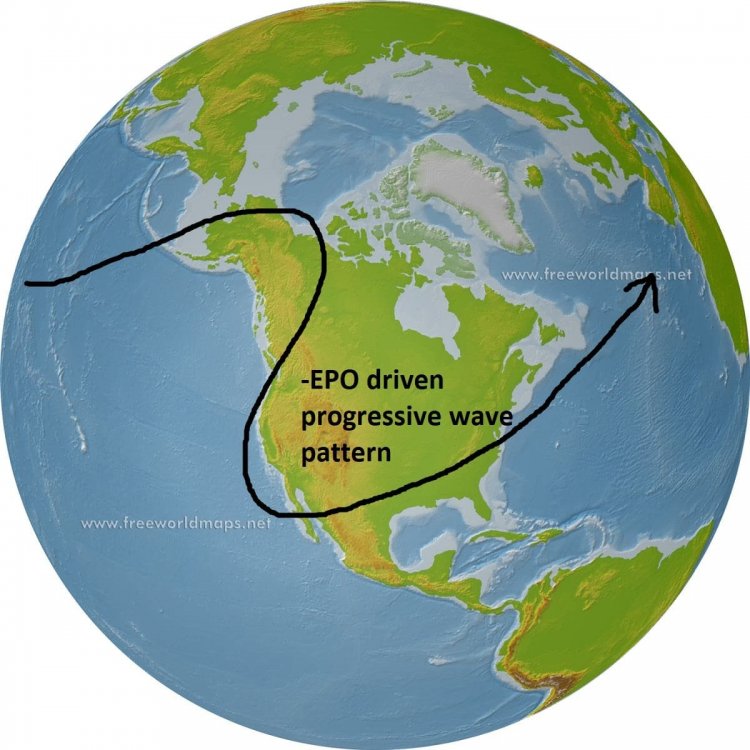
  8. These are some examples of warning events with a ridge bridge
  9. I remember the exact conversation you are talking about. It is possible to get a ridge across the entirety of the EPO/AO/NAO domains...and yes that is commonly called a ridge bridge...and when it happens it is extremely good for our snow chances. But it is very rare. So the fact that there are not more snow events with both a -NAO and -EPO is simply because that combination is less common not that it isnt a good pattern. But the reason our absolute biggest storms are usually associated with a +EPO is mostly because they are also associated with the most anomalous west based NAO blocks. Typically a block that strong cut off over greenland makes it even harder to have a strong ridge in the EPO domain. Frankly if we did it would probably be too much of a good thing and might flood the CONUS with so much cold it would just be a uber cold dry look. Think January 1977 \ Brutal cold but not much snow.
  10. 1) that will be easy. I’ll work on that either tonight or tomorrow. The hard part was compiling the data set and examining the pattern for each one. You can’t just look at the numerical indexes. Often an important feature is hidden. A Hudson Ridge often wont show up. Some west based NAO blocks don’t really show up well if the eastern NAO domain near Iceland isn’t impacted or there is a trough near the Azores. An east based epo ridge can sometimes show as neutral if there is an Aleutian low encroaching on the western epo domain. There could also have been blocking days before the event that by the time of the snow relaxed and the NAO flipped positive. Only looking at the day of the storm you would miss it. Now that I have that data sorting it in different ways is easy. 2. I can easily do that but the day of a snow will obviously show a correlation to cold since it has to be below avg to snow. During the storm it’s very likely near or below freezing. A better study would be to look at temps the day before and after. That would be harder. I would have to go back and look it up. I could give you the dataset and you could do it. But even then you will clearly see a correlation to cold. What you might not see is a high correlation to arctic cold. A lot of the events had temps near freezing. A lot were mixed events where 1.3 QPF lead to 6 or 8” of snow with a high of 34. That was a pretty common thing in the set. Pure snow warning events were rare. But that’s not shocking. The all snow zone on a lot of storms is relatively narrow. And most storms in the mid latitudes ride the boundary between warm/cold. We aren’t far enough north to often get a storm that’s riding the arctic boundary or a storm that’s late in its cycle and no longer pressing WAA north. You have to either have elevation or more latitude to get a lot of those.
  11. I will do some more profiles tomorrow... others feel free to ask questions or add information to this thread. Goodnight
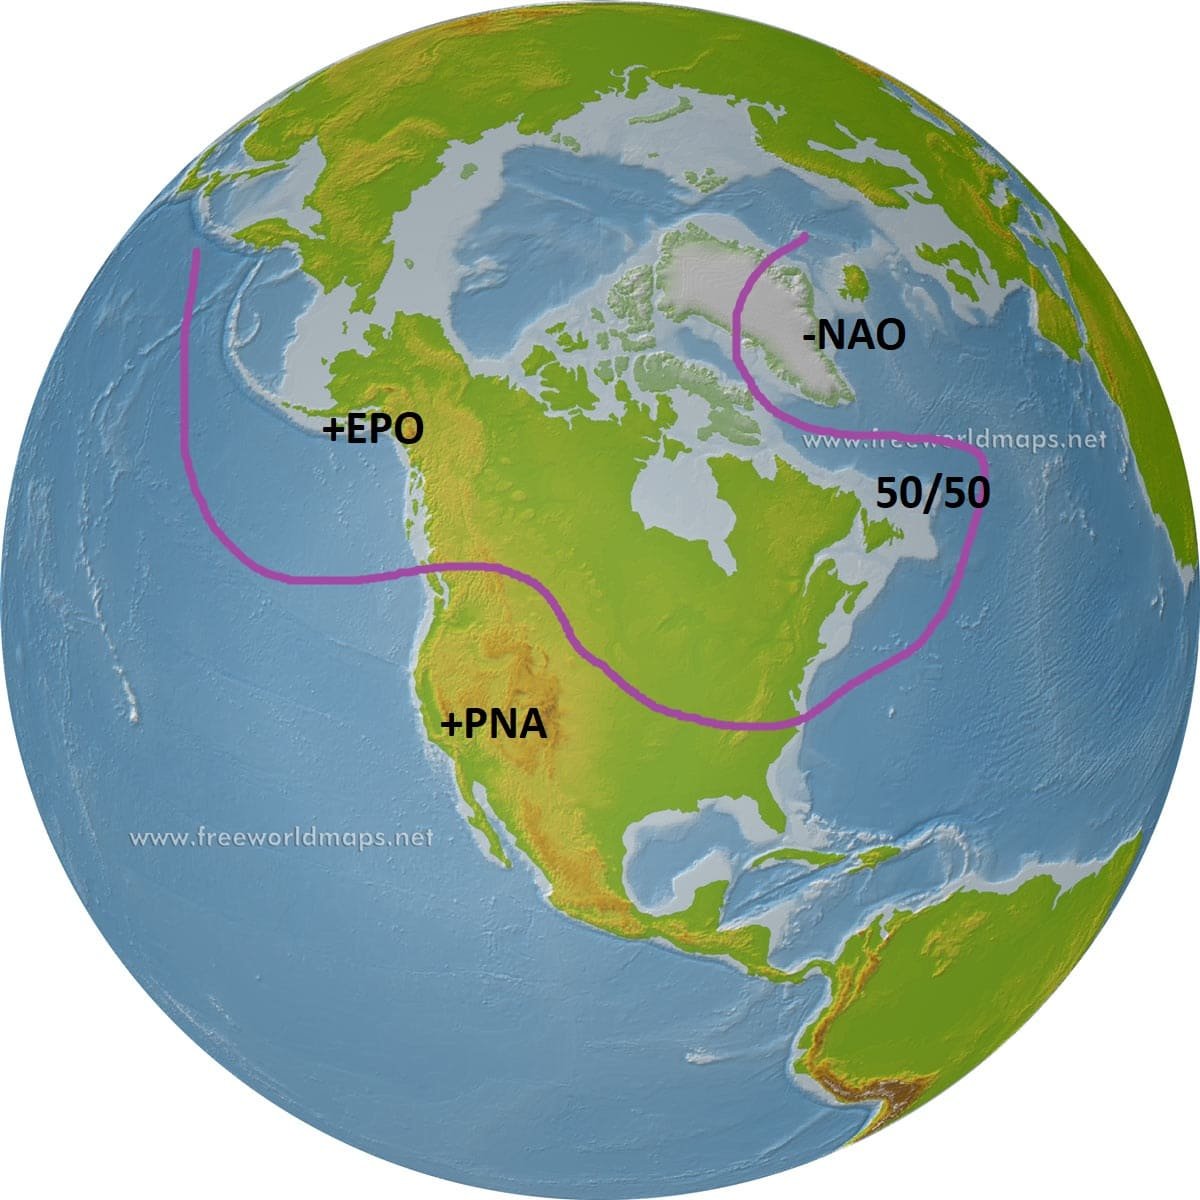
  12. The Money Look HECS Storms This is the common look for our big ones. Almost all of our 20" plus events fit this mold. The only exception is PDII. That storm was pure lucky timing with a cold airmass and a 50/50 low. But all our other HECS storms fit this pattern. Obviously the NAO block with 50/50 low is the prominent feature. The PNA ridge also helps to get a system to dig into the east and cut off. THe EPO is actually typically positive during these events. It is hard to have extreme blocking on both sides.
  13. Scand Ridge w/50/50 Pattern 10 storms Another singular factor that showed up in many storms that seemed not to fit the profile of our typical snow events (10 storms) was a Scandinavian ridge that is encroaching into the eastern NAO domain. That feature when combined with a 50/50 low can work out even in an otherwise flawed pattern.
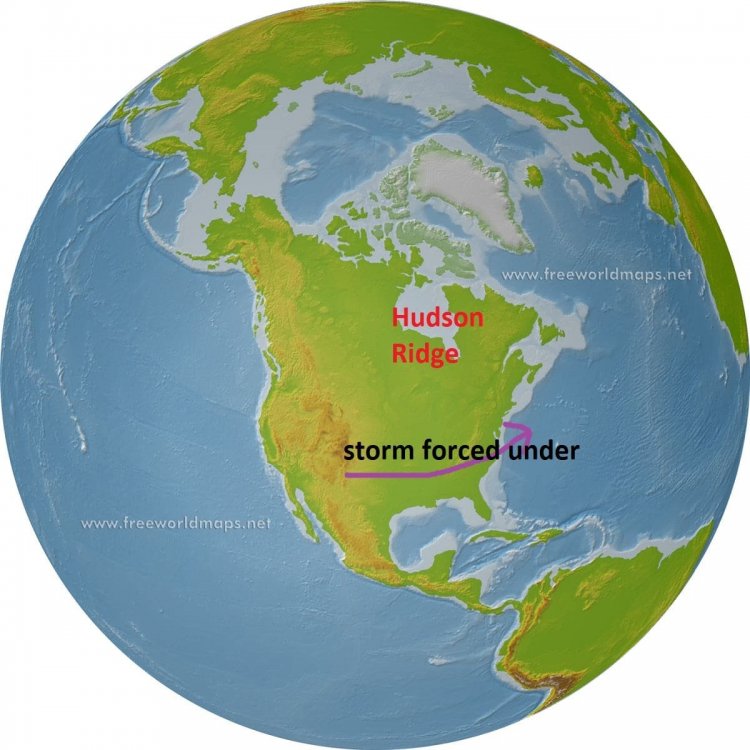
  14. Hudson Bay Ridge 16 Storms This was the single biggest factor able to equalize a crap pattern. A lot of our "fluke" snows in otherwise bad patterns came because of this feature. Basically a ridge near Hudson Bay is perfectly located to force a storm under us even without much else right. Actually if other features are lined up right a hudson ridge would probably suppress a storm way to our south. We would want the block much further north normally. But in an otherwise crap pattern that feature has saved us often. THis is the composite of those events. Seeing a ridge centered near Hudson Bay can indicate we have a shot...even if the pattern is otherwise crap
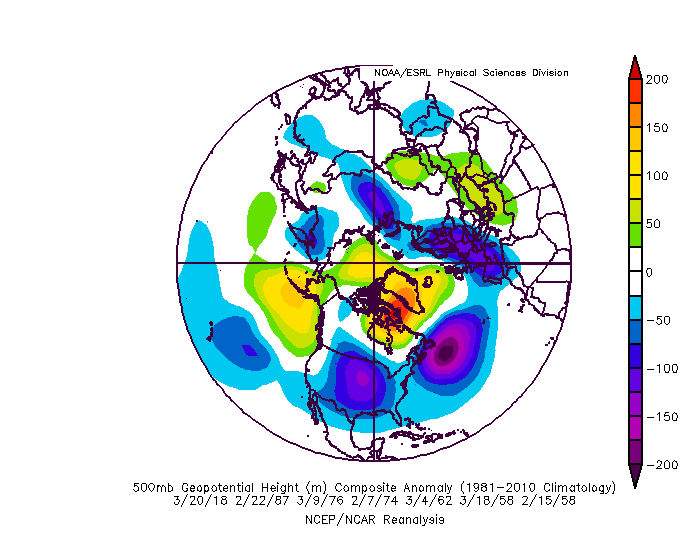
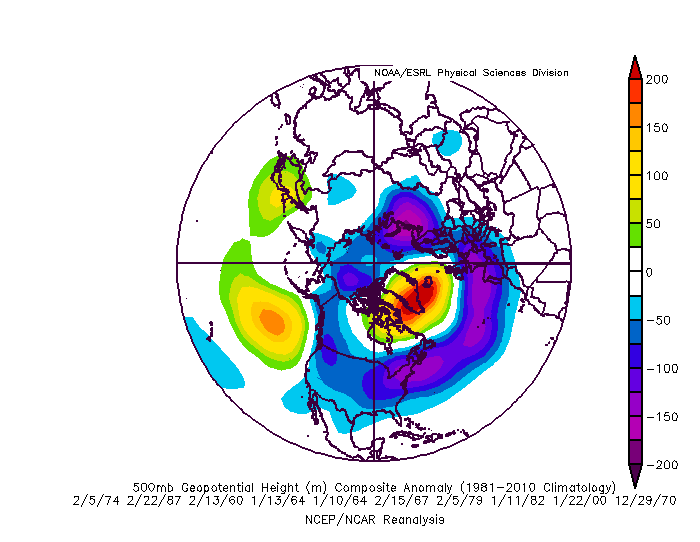
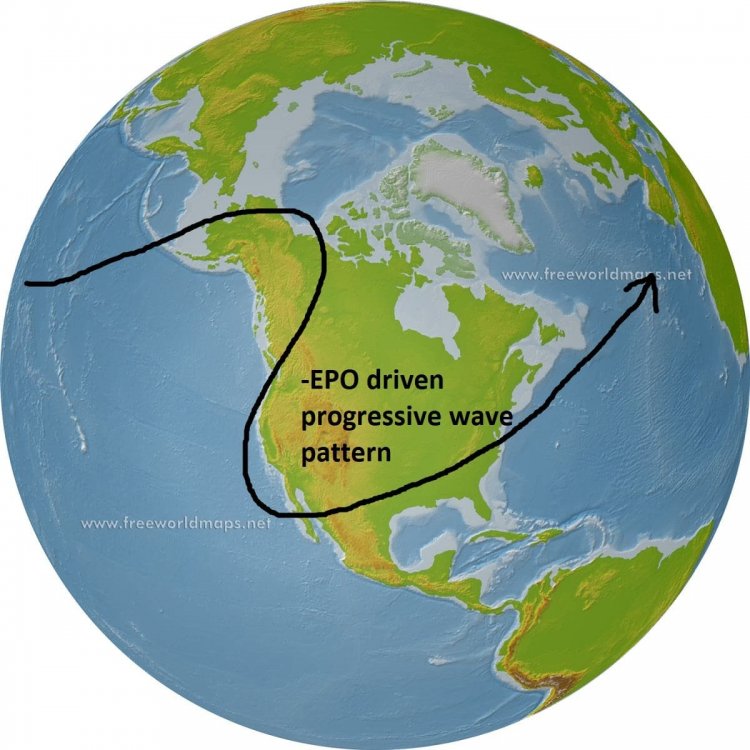
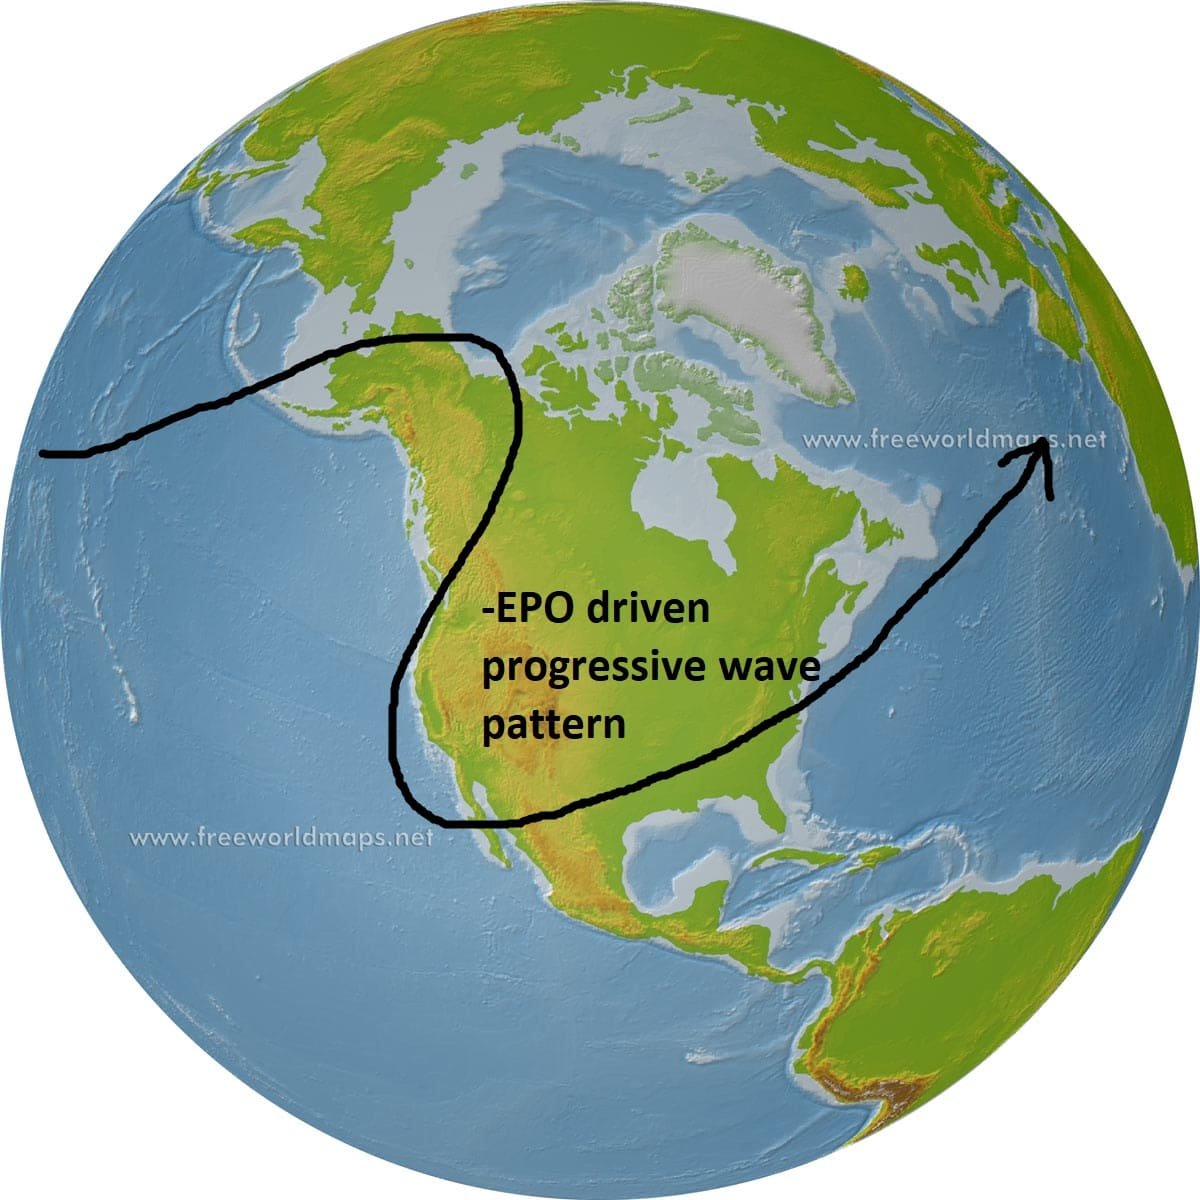
  15. EPO Ridge Snowfalls I will start with the EPO dominant storms since we have been talking a lot about the EPO lately. This explains an EPO ridge some The EPO ridge shown there is a central (or even west based) EPO. Those don't do us much good without some HL blocking. The ridge shown there would likely lead to the storm track in red on the map. IF...we had some HL blocking to suppress the flow and hold high pressure in then the track in purple is more likely. Without any HL blocking...the EPO actually is almost equally able to bully the pattern into a snowy one as much as the NAO...9 events to 10 with only those factors in favor...but it has to be a specific type of EPO ridge. Below is the loading pattern for each of the 9 EPO driven snowfall events absent atlantic help You can see we need the ridge to be centered into northwest Canada NOT out over the PAC. That configuration can create a pattern favorable for progressive waves that get under us. We actually want the PNA negative for this to work. A full latitude ridge with no atlantic help just is cold and dry. The western trough with an EPO ridge over the top leads to a pattern like this... If the EPO ridge is a west based EPO then we need at least SOME atlantic blocking help. These all feature a -PNA also because a western EPO ridge almost always leads to a -PNA. There were no examples of a west based EPO ridge without any blocking help. Since we are starting a central PAC ridge in the face right now on guidance I will include those analogs. The ridge north of Hawaii is really a WPO ridge more than a EPO although the two overlap some but a ridge centered there can only work with extreme NAO blocking. There were no examples of a snowstorm with a ridge there without NAO help. This is the composite from those snow events.
  16. Snowfall Study 5"+ events at BWI since 1948 88 Events studied For my snowfall study I looked at every warning event (5"+) at BWI going back to 1948 (that is when the upper air data is available). I know some of those events happened over a longer period than 12 hours and might not technically be a warning event but I thought 5" for the whole event was good enough. I used BWI because I feel like it is a bit more indicative for the urban corridor than DCA. If you live on a slab of concrete on an island in the Potomac south of DC...I apologize to you...and I feel bad for you, but oh well. I also included 3 events that fell just shy (they were all 4.8 or 4.9" at BWI but were significant events for a large portion of our area. That might be cheating but its my study and I can do what I want. Perhaps one of these events didn't hit your exact location the same...but when a storm misses by 200 miles its the pattern...when it misses by 20 miles its bad luck. So the patterns that caused these storms show potential, even if a particular event wasn't as good at your house as BWI. I then looked at the upper level patterns. For each storm it took a bit of analysis because sometimes I had to go back over the week leading up to determine what the predominant pattern or feature that lead to the storm was. Sometimes the key to a storm is something that happened the week before, and if you just look at the day of the storm you can't tell why the pattern was right for a snowstorm at all. So some of this is a bit subjective...the index might have shows something different on the day of the event...but if you look at the week leading up to it the pattern was in a different state. Also some h5 features key to a snowfall here can be invisible on the indexes. A Hudson Bay ridge might now show up. An extremely west based NAO Block can be muted by a trough in the eastern NAO domain or a trough near the Azores. An east based epo can be hidden by a trough in the western epo domain. I wanted to identify what features at h5 really indicate snow potential. So with that out of the way... There were 88 warning level events going back to 1948 Looking at each index on its own The NAO was the most important single index for predicting snow 58 of the storms featured a -NAO 3 were neutral 27 were positive The AO was second most predictive 54 featured a -AO 9 neutral 26 positive The EPO was evenly split 42 -EPO 4 neutral 42 positive The PNA surprisingly had more events in the negative phase (however most of our really HUGE snowstorms did features a +PNA ridge) 44 negative PNA 5 neutral 39 positive This was the breakdown for the index combinations and snowstorms for each combo the order for the chart is EPO/PNA/AO/NAO - - - - 16 + + - - 13 - + - - 11 + - - - 10 - - + + 9 + + + + 6 - + + + 3 Some take aways from the chart... the most common snowfall combo is a pattern driven by a -EPO ridge in conjunction with atlantic blocking. The next most common is a +PNA ridge with atlantic blocking The 3rd most common is a combo EPO/PNA ridge with atlantic blocking. So....atlantic blocking with ANY pacific help from either the PNA, EPO, or both...accounts for 40 of the 88 storms. After that we are left with storms when only ONE factor was working in favor of it. For those.... 10 were purely a function of High Lat blocking overcoming a crap pacific 9 were purely from an EPO ridge with no PNA or High Latitude Help (All of them were an east based EPO ridge) 6 were purely from a favorable PNA ridge and no other help Only 3 came from a combo EPO/PNA ridge with no blocking. So for everyone that throws around 1993....that was one of only 3 storms that hit with that look. A huge EPO/PNA ridge with no blocking is just cold/dry and progressive. Usually a quick cold shot then a warm up. One last note... by far the single biggest factor if we had to work with only one thing to get snow...is the Hudson Bay Ridge. We had 16 storms where the only really positive feature working in our favor was a Hudson Bay Ridge. Most of those storms don't show up on the chart because that feature often falls in between the typical index domains and in a lot of those storms all the other factors looked like crap. Apparently a Hudson Block is a local enough phenomenon to overcome pattern issues in a lot of other areas. It was by far the biggest way we got a snowstorm in an otherwise crap pattern. Also there were no cases with a -AO as the ONLY factor working in favor. That is not because the AO isnt important its just really hard to have a -AO without there being an EPO or NAO ridge because there is some overlap of those domains. It's also hard not to have EPO or NAO help...since the TPV being located near one usually opens the door to ridging near the other. And if we did have lower heights all across both domains the AO would likely be very positive. I will show some of the common composites to these patterns in following posts
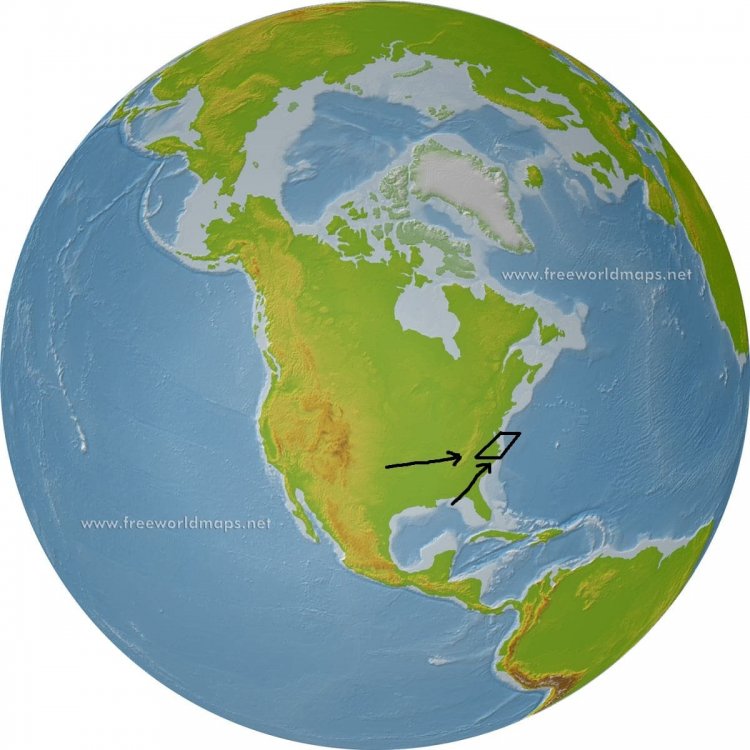
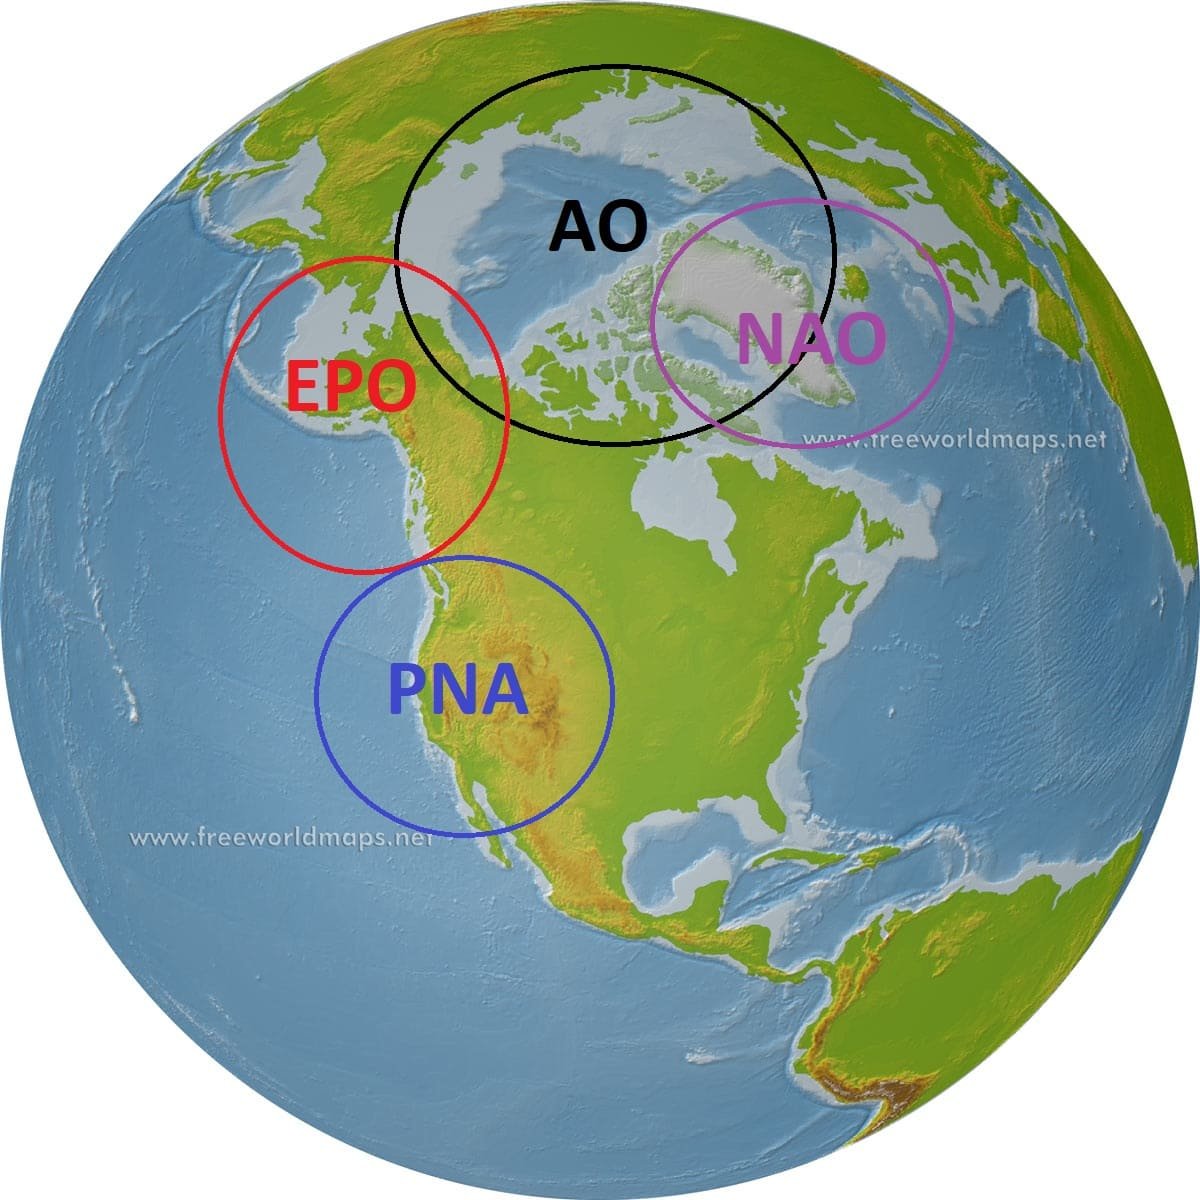
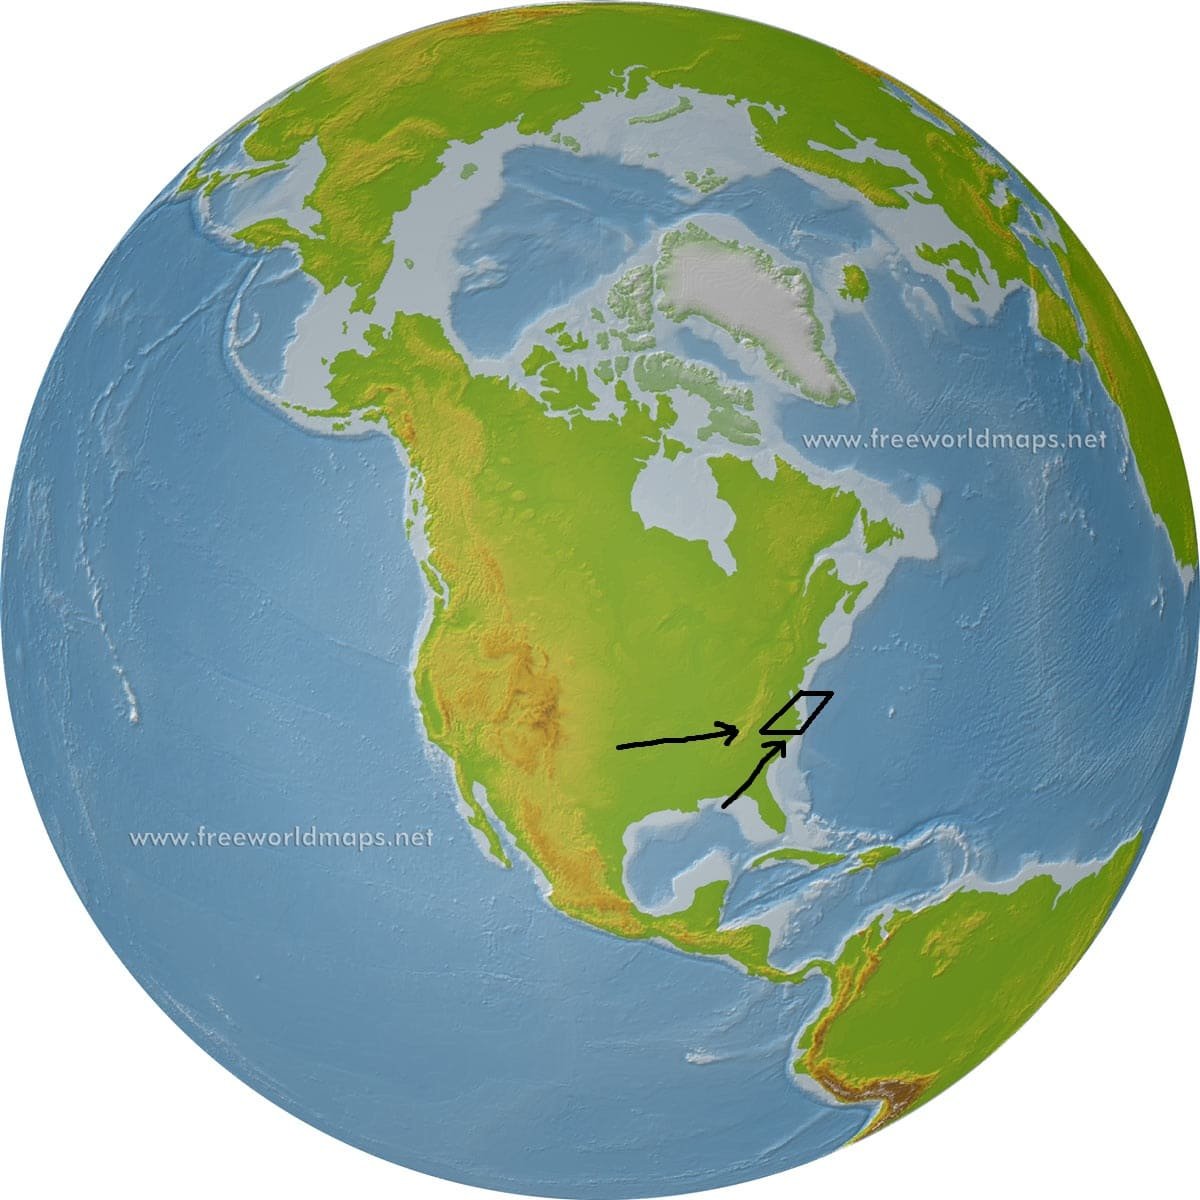
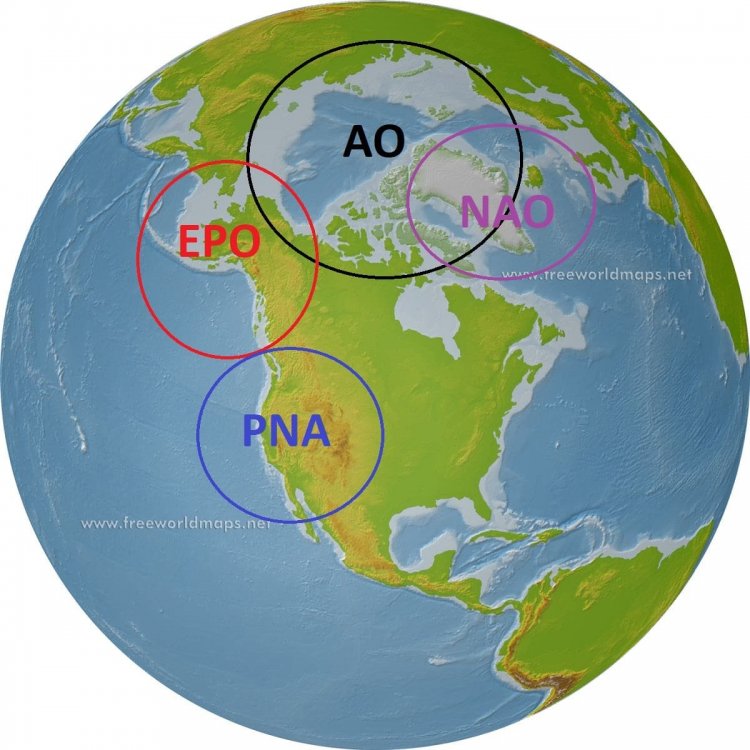
  17. I have been seeing some of the same questions posted wrt patterns lately and been getting some PMs about it so I thought I would post some stuff I have been working on for a while wrt snow climo and patterns. Others can add to this also. I did a study of all warning level snowfall events at BWI going back to 1948 and I will post the results below but first I thought I would give some info. One disclaimer: most of this research and information is focused on warning criteria snowfalls. We can fluke our way to a minor advisory level event in almost any pattern during mid winter. It really muddies things if we include a lot of 1-3" type events. But there are clear patterns if we exclude minor events and only look at what patterns are right for 5"+ events. I am not dismissing minor snowfalls but its really hard to identify patterns for a 1-2" snowfall. Some common pattern driver indexes we reference The colder phase of these indexes are -EPO (ridge), +PNA (Ridge), -AO (weaker TPV over the pole), -NAO (ridging). But colder doesn't always equal snow. There is no one pattern for snow. The trick is getting the jet right so that we get a storm into our "box". The most common tracks to get a significant storm into that box are shown. But there are a variety of pattern combinations to get the jet wavelengths right. Changing one factor can change what we need from another. But the key is getting the jet aligned for the track of storms to end up just to out south or southeast. For example...most of us know about the idea -NAO pattern... But...a -EPO pattern can work too or a Hudson Bay Ridge I will go into specific patterns and what percentage of our warning criteria snowfalls came from those patterns in the next few posts
  18. Yep...it was an attempt to corral all the dumb into this one thread. ETA: just so a debate doesn't start up I know when this thread started it was dry...and it was worth noting it...but it was fairly typical variance that happens a couple times a decade and not the emergency situation worth derailing EVERY discussion in every thread one person was making it out to be.
  19. it seemed like such a dire thing .. its not like typical cyclical climate variance could have solved such an emergency situation
  20. You're welcome. As for deer my wife knows a trick using Irish spring soap. Seems the deer don't like the smell. She puts it up at the corners and they have not been a problem.
  21. More recent pic...I need to catch up on weeding but have a 2 month old and I've been working long hours helping run a summer learning program.
  22. I put a fence up around the garden. I lived the bottom foot with chicken fence to keep the smaller vermin out and then tucked the fencing underground about 6" for a foot to keep groundhogs from burrowing under. I also build a cage with bird netting for the strawberries. We haven't had an issue with the other berries. You can see in the background the strawberry cage. These are old from right after I finished laying out the garden and putting down the boxes and stone walkways. What is now the pumpkin patch is in the background.
  23. Oh I know. I have a pretty large garden. Tomatoes, carrots, corn, peppers, raspberries, blueberries, watermelons, zucchini, green beans, snap peas, and 3 kinds of pumpkins. It's a pain when I have to water it all. But it's normal. There is a dry stretch almost every summer. Also sucks for my 2 acre lawn but there is nothing I can do about it. No way I am wasting that much water and overusing my well pump. Just have to hope it recovers when the rain comes again.
×
×
  • Create New...