

psuhoffman
-
Posts
27,419 -
Joined
-
Last visited
Content Type
Profiles
Blogs
Forums
American Weather
Media Demo
Store
Gallery
Everything posted by psuhoffman
-
It’s rare but sometimes just the 300 feet between my ridge and the valley below matters. In the zoomed in you can really see the difference.
-
First snow day for the kids
-
Finished with just under 3". Went down to pick up a work packet from my son's school, which we can literally see in the valley about 300 feet below us from our backyard...and there was visibly less snow. Crazy...
-
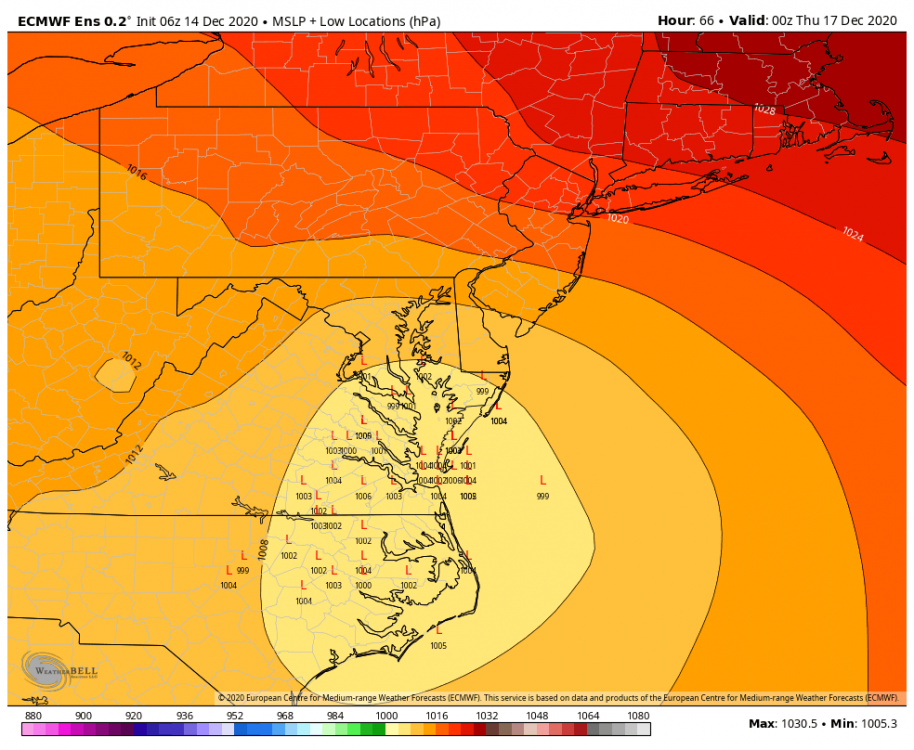
Wanted to point something out when watching the details on the op runs. It’s not just the track of the surface low but also how much of an inverted trough feature there is. 12z euro track was slightly west but it was colder because there was less inverted trough and primary remnants. That trough prolongs and enhances the easterly fetch. We want the coastal to close off a circulation at low and mid levels as quick as possible. A stronger inverted trough delays that some and kills us with an inside ideal track.
-
I dunno what the meltdown was about the navgem track looks perfect!!!
-
it was really coming down the last hour https://ibb.co/TPfQhmZ https://ibb.co/pQk4vCX https://ibb.co/Lk327YX
-
Naw when things are going sideways you hug whatever you can.
-
The GFS is by far the lowest. It will adjust. Every other model has a qpf max of 2”+. There will be 20” totals from this storm it just won’t be over us. The Max is likely up in PA. That’s our problem...not qpf.
-
Driveway caving
-
I’m so close to cool
-
Heavy snow. Ground caving.
-
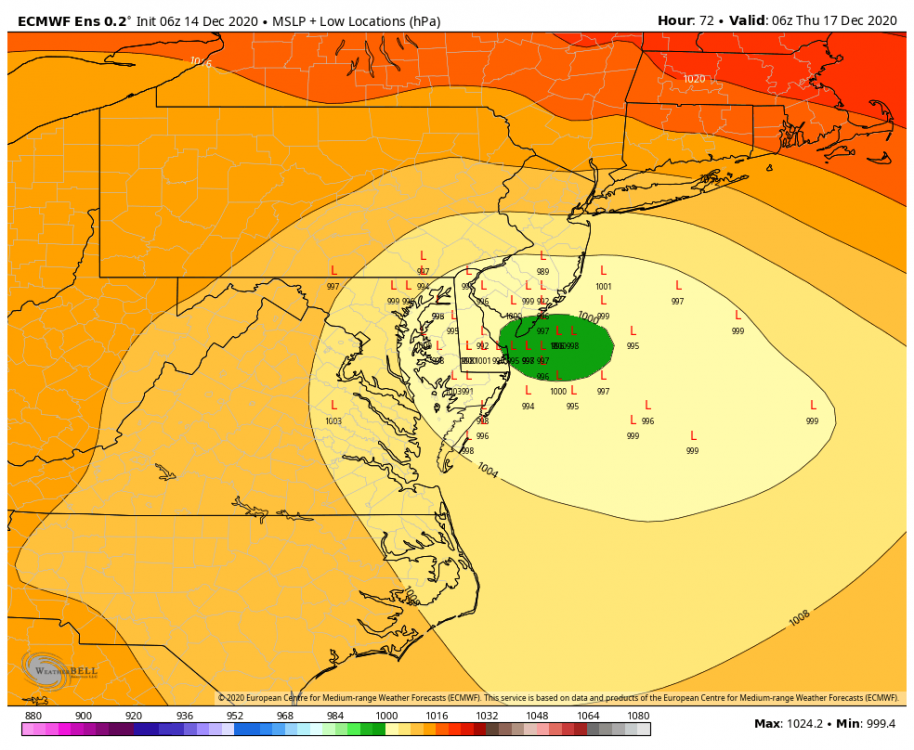
I thought the 6z op run was ok but the eps was kinda ugly. A LOT of inside runners that track the low pretty far up the bay before the turn east. This was the first ensemble run where I cringed when I looked at the slp plots.
-
All snow here now
-
Slush bombs mixing here. 35
-
I wouldn’t worry about the NAM. I can’t tell you how many times in the past few years at 36+ hours it’s given me snow on the back end of a storm that ended up no where close because the system was way more progressive. Gonna get some sleep.
-
SREF looks good lol...I mean if were going to bring up a bad NAM run at range...might as well mention a good SREF
-
The main globals have been crazy consistent with only slight adjustments given the time scale for the last 3 days. Some of the meso models will bounce around like this at range. Now...if the globals were to shift to a NAM like inside cutter...that would be a major jump.
-
lol its pretty much a non event for our area. Even up here its about 1" of snow to rain to dryslot. It mixes almost to state college lol. Be honest...it does bother you just a little to see it go that far west lol. I am not overly concerned by an at range NAM run...but I would rather see it going the right way then the wrong way.
-
Can you just make 6-12 8-12. Sounds better You see where the lines are...your closer to the 12 than the 6...call it whatever helps you sleep
-
my best guess
-
One is avg precip rate over the previous 6 hours and the other is instantaneous rate (or like a radar depiction).
-
@osfan24 @Ji everytime in the last few years the GFS was significantly less qpf then the other globals it eventually caved. I’m way more worried about track then meso scale features that will determine 10 v 20”. Unless we see all guidance shift that way I’m just happy to have a solution that doesn’t go towards my fail scenario. And for me only getting 10” isn’t a fail.
-
So that’s why it suddenly gets colder right after...makes sense. Perfect correlation.


