psuhoffman
-
Posts
26,285 -
Joined
-
Last visited
Content Type
Profiles
Blogs
Forums
American Weather
Media Demo
Store
Gallery
Everything posted by psuhoffman
-
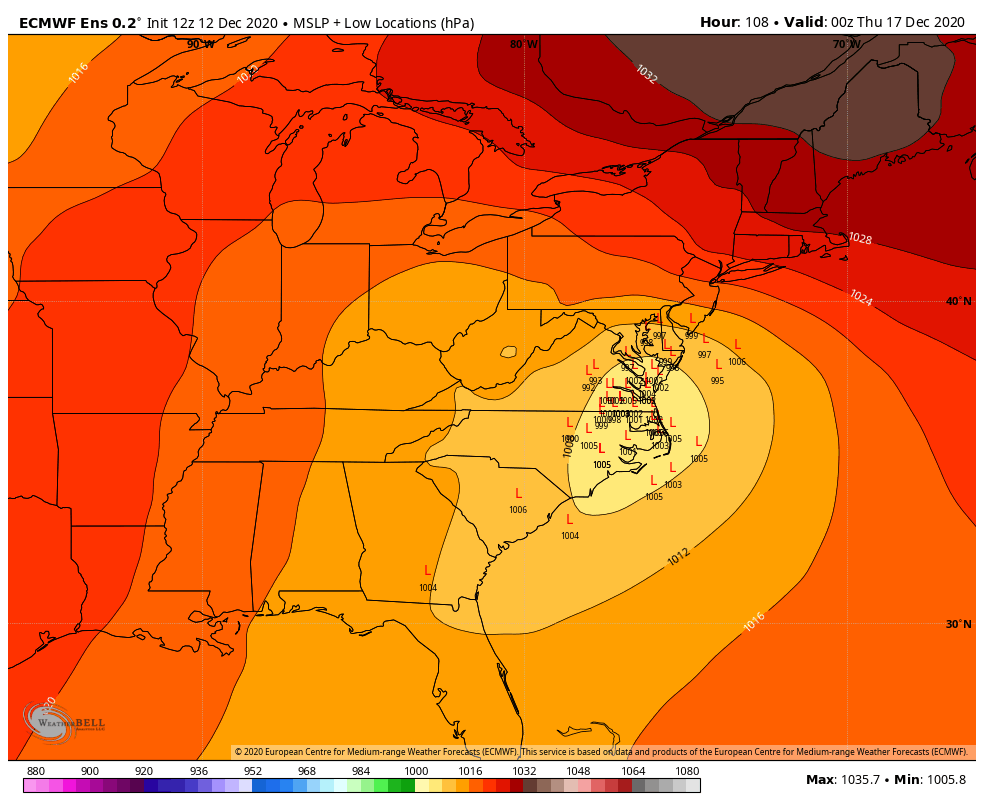
I guarantee you places west of the fall line are getting WAY over 10-1 in that band. If in a heavy band that’s likely very wet (very low ratio) bombs. It helps that the lift is crazy in the DGZ. I am so sorry. As a parent the crippling fear from just the thought of that is agonizing. There are no words. I truly hope you find some peace and get through your pain. The more I dig into the GFS and GEFS the more I like it. Those in trouble know it. There isn’t an Arctic airmass in place, it’s mid Dec, and the SST are scorched. SE of 95 is gonna be a struggle. But for everyone along and NW of 95 this run implies a lot of fun. Perfect placement of the surface mid and upper level features. fgen. Crazy lift in the dgz. Everyone except Ji would be satisfied imo. Even in the cities I think they do pretty good if...big if...this run is representative of the reality.
-
I haven’t seen the soundings for this run yet but the gfs has been aggressive punching a surface or near surface warm layer right up the Potomac. More so then any other guidance when compared to track. It’s there on other guidance but not as aggressive. It’s fairly short lived once the low starts to turn NE and bomb and the CCB deform takes over and heights crash under the upper level Centers. Maybe it’s overdone. I’ve seen the GFS run warm near the surface. We also know how DC rolls though so I never assume.
-
It’s a crazy dump before dryslot north of DC and NW of 95 though.
-
One last comp 0z v 6z EPS >6”%
-
You have been a rockstar. Thank you! I have zero cushion bro... You know better. It might seem that way by acreage but you know geography and climo. There is a world of difference between seeing that shallow warm boundary layer punch up the Potomac and Bay to the fall line and seeing it penetrate another 35 miles west into the piedmont. Latitude and proximity to a very warm body of water (relative to temps needed for snow). There is a lag effect on the temperatures during seasonal changes. A lot of this is due to waters influence. Water takes longer to gain and release heat. Some due to the PV taking time to mature. But even though solar is at a min in December the thermal profile of the northern Hemisphere won’t bottom out until sometime later in January and the Jet often becomes most favorable due to buckling and shortening wavelengths as the PV starts to wane in Feb. Our snow chances are centered in Jan and Feb. Even early March is probably better then most of Dec for a big snow. This is the ugliest point also. If you look at the last two frames the low has halted it’s due north motion and turned NE at this point. It’s not earth shattering and it won’t help some. But if you’re on the edge that shift is significant.
-
Maybe, those things count sleet as snow and looking at the temperatures at different levels...I think there is a LOT of sleet up here. It isn't AS bad as I originally thought...that deform really clips us good at the end...but the front end is really not good at all...and relying all on the wrap around is living dangerously if you want a big storm. First of all I was analyzing the thermal structure to get an idea what I think falls as SN/PL/RN, not using those ptype maps that are awful. By 21Z we are losing a snow look imo. We are still at about -2 at 850 but there is likely a warm layer somewhere with that screaming southeast wind. I see about .23 qpf before that...so we likely only get 2-3" before a flip to sleet on this run. We waste a LOT of qpf as sleet in the next 6 hours or so. I count about .7 qpf that falls as sleet. At least I think it is sleet...its close whether the cold layer is thick enough or if it goes over to just rain for a time. Maybe freezing rain with a temp at 30 but whatever. That is probably about 2" of sleet if it is sleet. But we lose a lot of the meat of the storm there. The deform clips us after that and we get about .8 QPF as snow...assuming our typical high ratios once temps crash at all levels...we probably get 10" on the back. But again...I am always nervous relying on that back side for the bulk of our snow. Those deform bands can be really tricky for models to nail down this far out. If for whatever reason that shifts north some...suddenly we are looking at a messy muck storm instead of a big snow. Not gonna over react to one op run of the typically most amped model. But it was the worst run for us so far. Those maps are LOL. It counted a period where my 850's are +2C as snow.
-
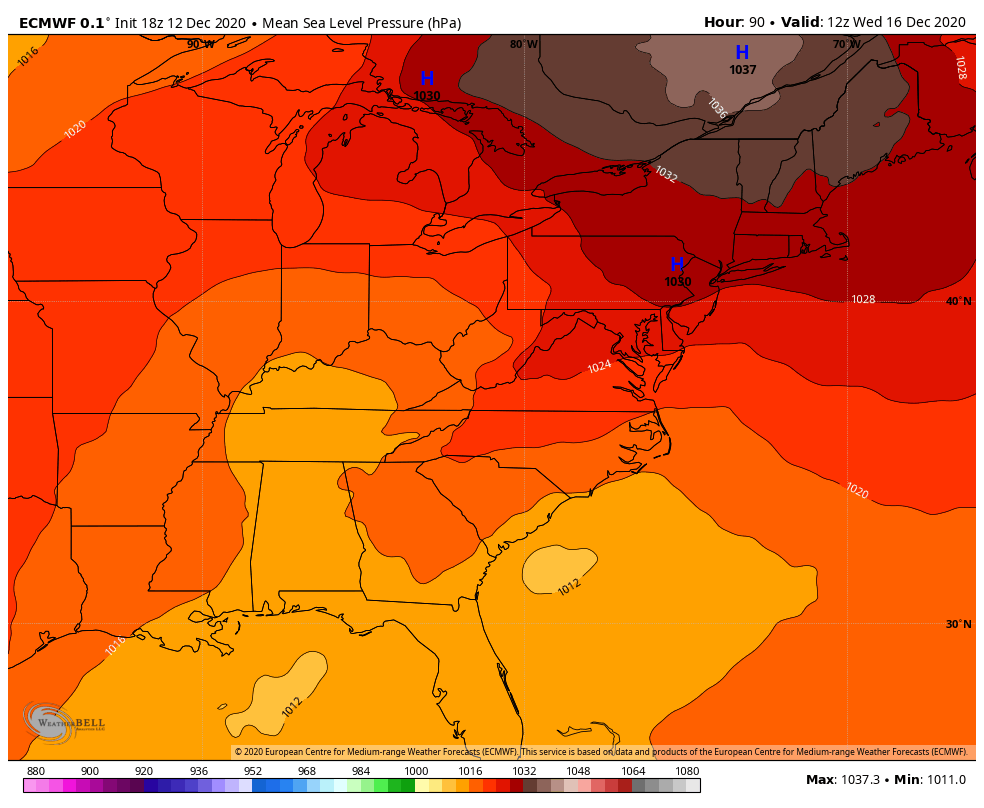
It does what the 18z GFS op did...tucks the storm north up the bay before shifting east.
-
It's pretty meh even up here
-
This from MAG5035 in the central PA forum "Hmm, well at least on the WeatherBell products it appears the op data for the GFS and Euro is 0.25º and 0.1º respectively while their ensembles are both at 0.5º resolution. Without getting into a whole thing on GIS/mapping/degrees to meters conversion, the short answer would be yea the ensembles are run at a lower resolution (higher degree number). The high res Euro at 0.1º would be a bigger resolution difference vs it's ensemble. So I guess it could be implied that the lower resolution could flatten mesoscale features and thermal boundaries a bit and that difference could show with coastal low development, especially with how warm the water is off the eastern seaboard. Also, ensembles aren't going to see CAD as well as an op or especially a meso model for that same general reasoning. The higher resolution of the ops might be promoting a more explosive coastal response (and also closer to the coastline) just simply on the premise of modeling a sharper clash of warm vs cold. Given the +SST anomalies present on the eastern seaboard and a fairly respectable cold air air mass being supplied by the Canadian high, it may be wise to lean that direction with trying to blend guidance. Ultimately, I'm not sure how much the resolution difference actually plays in the grand scheme of things, as an ensemble is made of individual members that have their own specific conditionals to form a mean within a range of possible outcomes, which pretty much can have a similar effect as lower resolution flattening features out. Thing with ensembles is we're typically looking at them to get a handle on overall larger scale things with these events (QPF fields, pressure/height fields, accumulation probabilities, etc).. especially at this middle range where we don't have our short range or meso models in range quite yet. "
-

Central PA - Winter 2020/2021
psuhoffman replied to MAG5035's topic in Upstate New York/Pennsylvania
Thank you -
We finally found some use for that thing The 2010 cutoff was crazy. Razor thin...cutoff even went south of due east as it hit the wall. Crazy blocking. This cutoff is more typical of big storms...1996, 2016...where there is a sharp northern cutoff somewhere as you hit the confluence but its not like going from over a foot to nothing in 30 miles like some places in 2010. yea...because for us to get crushed we need that confluence to our north...not just to stop the storm from cutting but to create the crazy lift and fgen you get from the WAA be resisting. If there is no resistance the warm air just pushes north and you don't get the same VV's. The more the cold resists the more lift. But that means there is likely a wall of confluence somewhere to your north and the northern edge will hit a brick wall somewhere. Add in the subsidence you will get outside that NW most banding and you can get a pretty sharp cutoff. It is definitely more Miller A then it was represented a few days ago. And I would agree with your assessment. But there are some that classify any system with a primary that initially gets up west of the apps as a hybrid. Some even argued that 96 was hybrid because there was a trough up west of the apps early in its development. I think that is going a bit far but...I am not one to argue over definitions much. Yea the guidance has been on a long range roll lately. It pegged this from super long range as a "window of opportunity" and there was about 36 hours where it became a bit murky there but for the most part this was a time to watch from weeks ago. Guidance is hinting at another period after xmas that bears watching now...lets see if they remain on a heater.
-
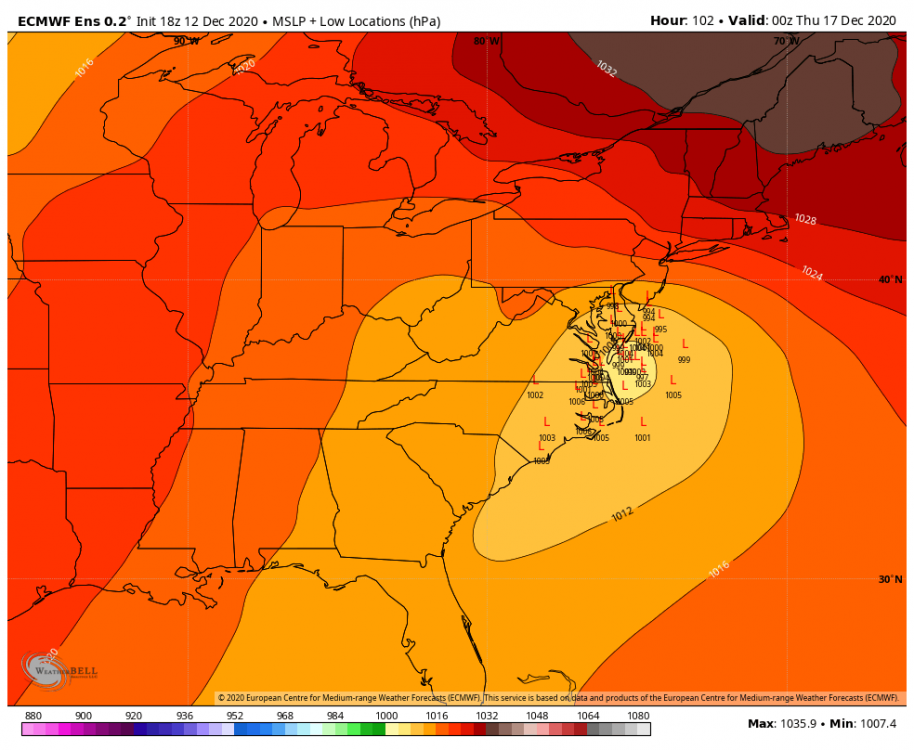
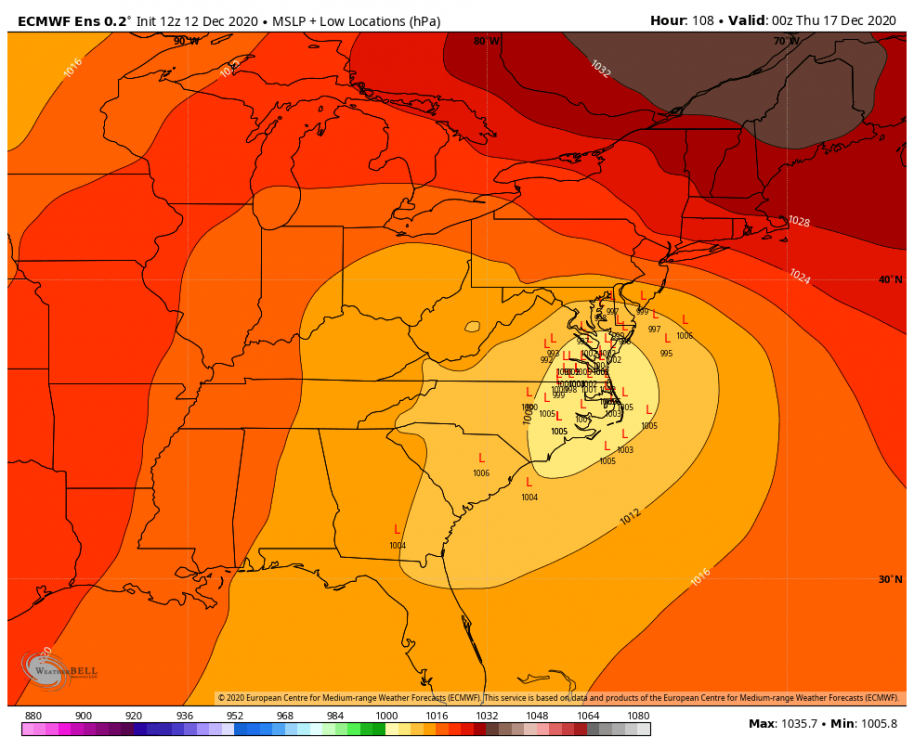
It's actually 2mb deeper this run at the critical moment for us...from 90-96 hours...it just lost that wonky due north jog that screwed us 18z. More in line with the ensembles. The SW associated with the primary was slightly less amplified originally and that helped. Don't want that to go negative too soon.
-
Before things get crazy with the 0z runs... the long range GEFS from last night really reloads a great looking -AO/NAO pattern in January. It's workable to favorable straight through actually.
-
Sorry I posted this in the wrong thread a min ago @dtk @WxUSAF @high risk do you know what resolution the GEFS and EPS members are run at compared to the operational? I have noticed that the ensemble members (of both the EPS and GEFS) have been running warmer even with similar or further east tracks then the operational runs. This has been a consistent correlation for several runs across both ensemble suits. The track of the operationals has changed but the presentation of the thermal structure of the storm has remained fairly consistent...meaning where you expect the thermal boundaries to be wrt to mslp is roughly the same places each run dependent on the MSLP. But those same thermal boundaries seem to be further NW given the same MSLP track on the individual ensemble members of both the EPS and GEFS. I am wondering if they are run at a lower resolution...they may be warmer due to not modeling the meso scale features as well. That may not be correct...just grasping at possible causality for the observation I noted. I know back in the day the NAM would pick up on CAD better due to its higher resolution...one of the few things it was good for at range with a winter synoptic event. You had to adjust for its over amplified bias...but you could get an idea what the thermal structure of the storm might look like.
-
Central PA - Winter 2020/2021
psuhoffman replied to MAG5035's topic in Upstate New York/Pennsylvania
@MAG5035 do you know what resolution the GEFS and EPS members are run at compared to the operational? I have noticed that the ensemble members (of both the EPS and GEFS) are often warmer even with similar or further east tracks then the operational runs. This has been a consistent correlation for several runs across both ensemble suits. The track of the operationals has changed but the presentation of the thermal structure of the storm has remained fairly consistent...meaning where you expect the thermal boundaries to be wrt to mslp. But that seems to be different on the ensembles. I am wondering if they are run at a lower resolution...they may be warmer due to not modeling the meso scale features as well. That may not be correct...just grasping at possible causality for the observation I noted. ETA: I know back in the day the NAM would pick up on CAD better due to its higher resolution...one of the few things it was good for at range with a winter synoptic event. You had to adjust for its over amplified bias...but you could get an idea what the thermal structure of the storm would look like. -
Before the 0z starts..fwiw I think the 18z rgem looked great at 84 hours. High stronger and further SW then most other guidance. Faster wave. It looked like it was about to get good.
-
March 18 clipped his area pretty good
-
best run yet wrt mslp track 18z v 12z
-
Was comparing these wrt the colder profile on top of the primary in KY. Thermals did retreat SLIGHTLY in VA too.
-
I wasn’t picking on you. That was totally ok. Not your fault. That map did say what you said. Those multi plot precip type charts aren’t as precise with estimating pressure locations as the mslp plots.
-
Lol. Not your fault but that map has the high from the 12z run in the wrong spot. I think because the map cuts off just below the true center of the high. Here.. like I said maybe a few miles apart...

-
@WxUSAF one other minor different wrt 18z euro. The thermal boundary shifted north ever so slightly in southern VA by like 10-15 miles but the cold is still draining increasing the gradient so the entire profile didn’t retreat just along the edge. However, it’s colder west of the apps in KY on top of the primary. I don’t the primary would make it as far north on the 18z v 12z. That is provably a trade off I would take for the ever so slight changes in the temps and pressure among the coast. Thoughts?
-
By like 3 miles maybe
-
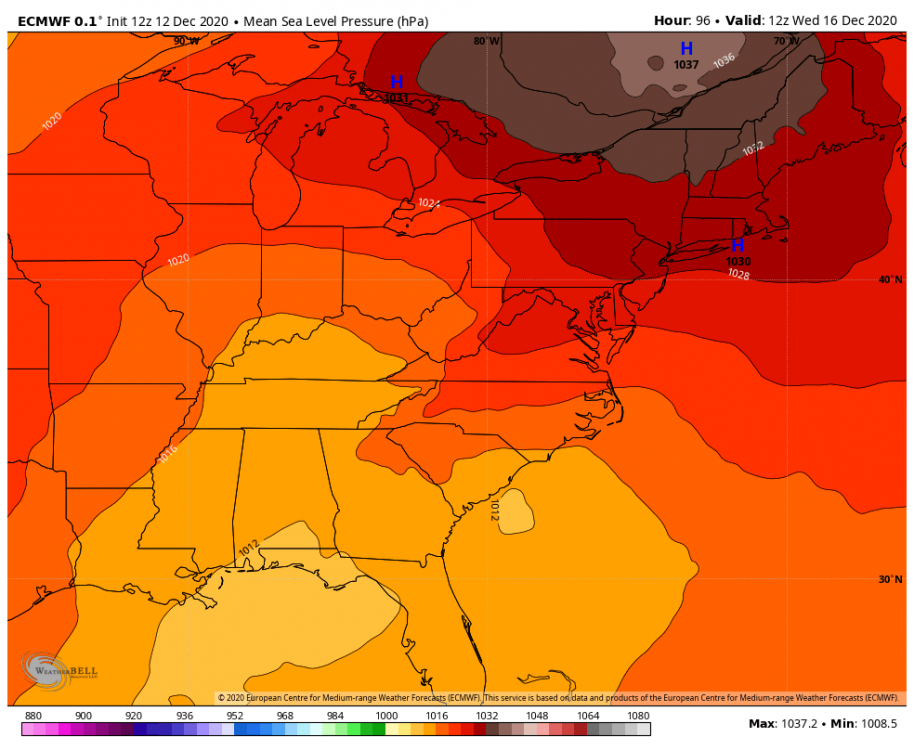
Other than the slightly weaker system the rest of the representation is remarkably similar for 84 hours. The pressure field up top is nearly perfectly identical. Wrt slightly weaker...if we lose a tiny bit of the mega banding qpf but get this to tuck just a little less that’s probably a winning trade off for most of us. We have dynamics to spare here, room to breath with the track not so much.
-
You’re right. I was comparing it to 12z op. The 18z is slightly slower so it’s not a perfect comp but they seem to be identical in track through 96h but then 18z jumps due north into the CAD wedge. It is definitely in response to SW going neg. But while the 18z SW is slightly more amplified then 12z I feel like that looks overdone wrt the surface tuck there v 12z. If course maybe 12z was underdone! Lol. Either way the op would be the second most inside track of all the ensembles so it’s an outlier. For the comments WRT the gefs being warmer. They are lower resulting I believe. So they might tend to be warmer by missing some of the dynamic cooling. But what I am more sure of is when you have a few inside runners in the mean they will skew the temps warm a little. I would worry more about the slp clusters and getting a good track more than the mean temps on those plots.