NittanyWx
-
Posts
758 -
Joined
-
Last visited
Content Type
Profiles
Blogs
Forums
American Weather
Media Demo
Store
Gallery
Everything posted by NittanyWx
-
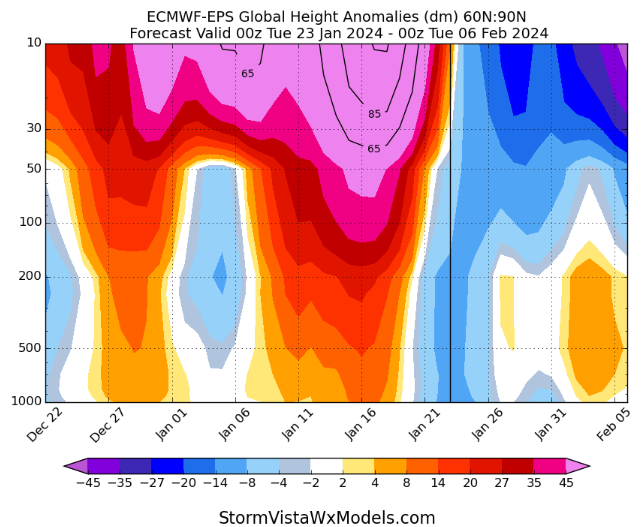
Please, for the love of God, look at hovmollers to diagnose forcing. Happy Sunday.
-
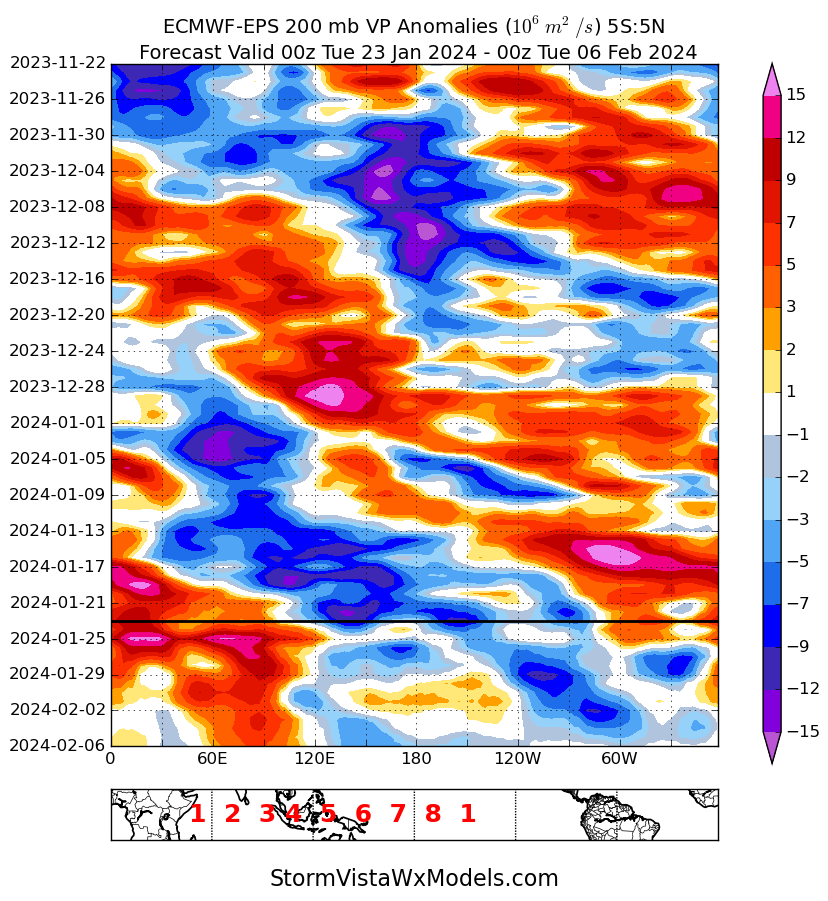
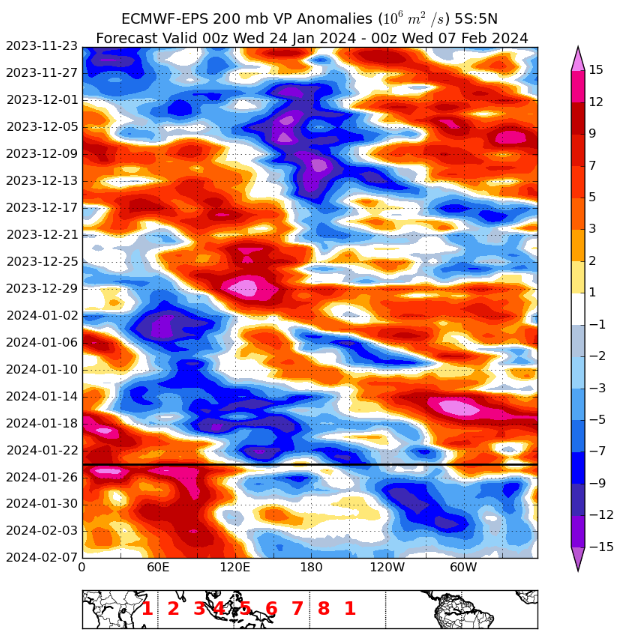
Not accurate. Subsidence emerging in p7 for the next week or so. Strong -VP anoms/forcing in E Pac. If this busts warm, cant blame p7.
.thumb.png.2dd75a59917b1fe791dad54953bb0c05.png)
-
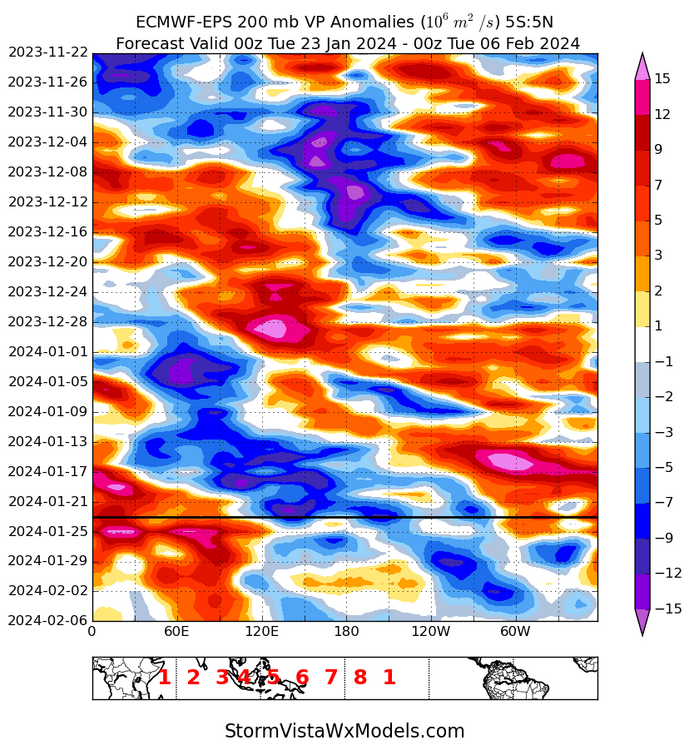
Let me try to explain this a second time, becuase I'm not sure you're understanding what I'm saying. Those hovmoller charts are showing a +OLR anomaly in the phase 7 region for the 11-15 day window in response to an eastward propagation of the main negative VP200 anomaly. In laymans terms, the EC Ens today is showing progression. Now, the model is also trying to add some -VP anom noise late 11-15 day in those west/cpac regions too. But at a window where it's RMSE MJO forecast performance has been...not great. We've already had phase 8 physical forcing responses this year, the signal just wasn't particularly strong. That wasn't the case for phase 1/3 response, where we had a very nice and clean forcing for end December and early Jan...certainly that was shown at the VP200 level. Isolating out OLR:
-
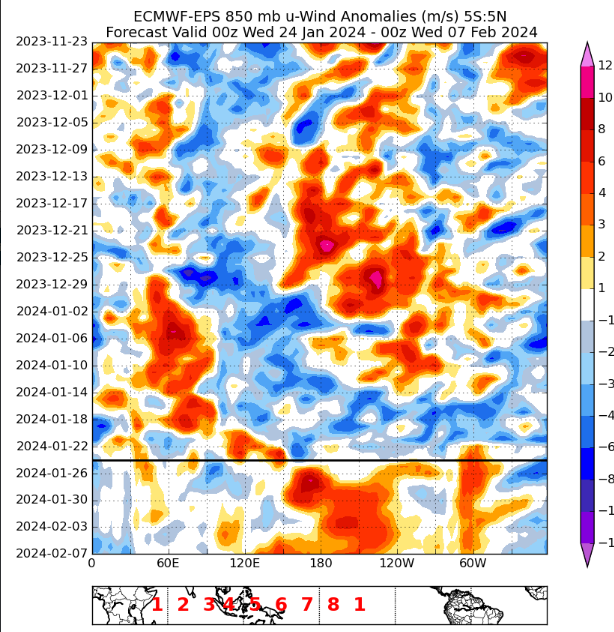
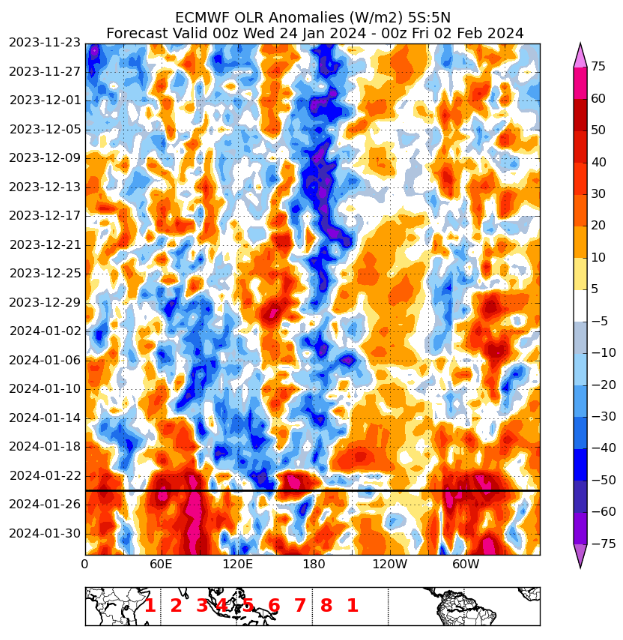
VP200, 850 u-wind and OLR all show convection and the expected forcing response eastward with a progressive MJO signal. There really isn't much debate here as to the progressive nature of tropical forcing. There is a lot of debate on whether this parlays into cold in the windows it's supposed to for early-mid Feb. IO convection is shut off for the time being.
-
The VP signal for the MJO was and is a clear P-8-1 in Dec and it failed to produce expected results for reason's we've outlined in this forum in the past. A question I'm asking myself is whether the SPV/TPV decoupling actually allows wave breaking to do it's thing via jet retraction mid month. Think it's possible, but not yet totally sold on it. I still don't think we should be using wheeler plots as any sort of predictive basis for snow forecasting in this region... Your Hovmoller diagrams get you a much cleaner and disaggregated picture of the things that you would consider to matter from the tropical forcing perspective anyway.
-
This is the warmest winter on record nationally Dec 1 to date (total HDD).
-
As have I. And you know what has been observed in a fairly recent study? Weak vortex events leading to west pacific convection flaring 2 weeks later. A sign potentially the SPV was modulating the tropics and not the alternative and they went a step further to suggest tropo-strato interactions in the tropics themselves modulated MJO activity. Response of tropical convection over the western Pacific to stratospheric polar vortex during boreal winter - Wang - 2022 - International Journal of Climatology - Wiley Online Library And you know what I think? We're getting so far down the rabbit hole in trying to find any sort of signal or jam any sort of convective activity into the equation that we're losing the ability to use it in a forecast. I do know I can use strato-tropo coupling periods in a forecast though, and I did that this season.
-
I don't see how it would be given the strato-cross section view. Could be wrong, but it appears to be a top-down cooling response in this scenario. There's some wave breaking potential for mid-feb.
-
Cohen is to strato as some of the MJO/GSDM folks are to their chosen variable. Judah's about as one track as it gets to strato. Both sets of folks have their correlations fail spectacularly at times in the mid/high latitudes, especially when it comes to spatial distribution of 2m temps.
-
Correct, the SPV is completely decoupled right now (this wasn't the case a few weeks ago), and thus strato warming interactions (top down) at this point are likely to only play out in the typical 3-4 week delay. The reasons for this coupling in January can be traced back to about 3 separete things occurring, but I think this is a very nice and clean way to show the couple/decoupling of the SPV/TPV:
-
The arctic region shifts cannot be adequately explained by El Nino, warm SSTs and tropical forcing alone. And we've already determined the lagged MJO h5 charts via Roundy argued for more blocking in this period. You're practicing selective verification here.
-
If @bluewaveand other MJO folks want to argue amplification of the MJO in p6-p7 is driving the bus, that's fine. I'm gonna point out that the VP anomaly signal during this supposed 'lag' period that folks were trying to sell is 1) Nowhere near as prolonged and intense as late Novy 2) Displaced further west in the 'lag' period. 3) Not getting 'stuck' or 'slowing down' and again the VP signal is progressive. I admire the dedication to the cause though. I once again am gonna throw a challenge flag on this. I understand the argument, I've read the research and even a cursory look at the current observations via their own methodology is not lining up.
-
I see a very noticeable strato/troposphere decoupling over the pole which is again leading to a TPV displacement and polar air being shunted away from NA. We had the opposite occur in mid January. In an extremely warm climate year globally it makes sense that warm patterns are more extreme. But this is being exacerbated by the displacement and erosion of source region and the lack of snowpack recovery accordingly. It makes less physical sense that this is primarily an MJO byproduct. You're ignoring several large pieces of the puzzle.
-
Welp, good to see absolutely no one took my MJO comments to heart this week
-
My personal view is that if your lag time changes from next to nothing to 7 days and you don't have a predictive way to determine how long the lag actually is in a given moment, it is almost a hindrance to getting the forecast right in the timeframe you need it to be right. The models are also assimilating this data too, so I'm not really sure where the skill score improvement is coming from. I think the strato coupling had merit and I used it for this period.
-
So you're arguing a lagtime of two weeks effectively. Peak convection in this area is Jan 1-5. We got cold here Jan 14-20 and lingering into the 21st. Why was the lagtime two weeks and not one week? Most of the MJO lagtime papers argue one week. I've been on the receiving end of a lot of forecasts that purported to use the MJO for last week and extending into this one, and I can tell you that very few of them got the timing of this right, particularly when it came to the west and Canada. I can tell you why I made my forecast cold MLK week...it was because I saw an increased blocking signature developing first week of Jan, particularly Atlantic side and a potential for a displaced lobe of the TPV being cut off and pinched into western Canada and eventually that moving eastward. I saw the signal for this in late December, used it accordingly. The impetus for my view was blocking, which the MJO lagged signature incorrectly is predicting would linger into next week in the AK/EPO regions..it isn't. So if your two week (to be clear, this is the argument) lagtime is supposed to continue here, I'd be expecting an MJO P3 response next week, and I'd be expecting blocking to continue across the upper latitudes. Neither of those things are happening. What's the lag time now?
-
This is inaccurate. We had a >1 St Dev RMM phase 1 response for the majority of end December. By Zhou's definition for a coherent MJO signal, this is significant. I hate wheeler plots, but Zhou uses them for the MJO composites so it's worth remembering that. If you want to look at the VP space you had a coherent subsidence response in the maritime continent over peak warm pool areas in mid to late December: You can argue it was less amplified (true) but I don't view that as an incoherent progression in the VP space.
-
For anyone interested, there's also this paper on the subject: Time-Lagged Response of the Antarctic and High-Latitude Atmosphere to Tropical MJO Convection in: Monthly Weather Review Volume 146 Issue 4 (2018) (ametsoc.org) With this wonderful caveat: 'However, the time lag between the MJO and the Antarctic atmosphere has been found to vary between less than 7 and greater than 20 days.' Go forecast that. Impact could be less than 7, could be greater than 20 days. But don't worry, we promise this is adding skill...
-
I went back into my notes yesterday after you spoke about the lagged fast, slow response...i had a paper from Yadav on the subject: scholar.google.com/scholar_url?url=https://repository.library.noaa.gov/view/noaa/48317/noaa_48317_DS1.pdf&hl=en&sa=X&ei=nZKqZZTgGMrJy9YPkL-OiAY&scisig=AFWwaeYaGB4mXHwpJvzQ8GUFrEZc&oi=scholarr
-
Our peak warm spells this winter have been in MJO 8 1, what does that tell you?
-
The MJO composites you are using as the basis for 'what to expect in p3' are not lagged. They are the H5 pattern you get during the OLR/VP MJO identified week 3. This is, bluntly, a total cop out. I've read all this research on lagged response times and the lagged stuff Roundy uses wasn't any better in the polar regions. The answer, in this case, was the MJO P4 composites gave you a negative skill forecast for this week. What should be happening is dissecting what variables made that fail rather than passing it off as 'oh it's lagged'. You don't know that and when I ask 'how many days does it lag' you're essentially telling us the historical MJO composites are bullshit. I'll be blunt, I think a lot of people are learning the wrong lessons from this week.
-
\ We have composites built off of historical analogs for an expected h5 pattern during MJO P1, P2, P3 etc. We further filter them by El Nino/La Nina cycles, etc. Those analog h5 composites are used in predictive forecasts. During MJO P4 I should expect 'X' pattern. That's the point of using these analog forecasts. The pattern we are seeing now at H5 is not matching up the typical p4 composite. Roundy's analog work got the polar regions really, really wrong. So even the lagged methodology isn't working. Arguing that in this situation the cold we see now is a lagged impact /response completely ignores the fact that you're using a nonlagged composite as the basis forecast in the first place. So if you sat here and said i expect a P3 look when we're in P4...why do the analog cases argue the exact opposite? This is why I kinda get frustrated at how people use the MJO. If the response is lagged, why are you using unlagged composites for the MJO analogs? Like I think it's OK to sit here and say 'hey this didn't work, it's a bust this go'
-
For interested homeowners, where can one buy a weed zapping laser....
-
In recent times it is mostly Pacific differences (EPO region), differences in the strength/location of the PV, and also big differences in the amount of blocking.
-
I'm not sure what this post is responding to. The amplification of the VP signal over the warm pool wasn't ever in question. It was also further assisted by an equatorial rossby wave traversing the region too. Once again, all play a factor. What I was questioning was your comment that the MJO 'slowed down' this year which led to extra warmth. There was no 'slow down' in this sense of the VP anomaly signal (as we define it). It did a full cycle at a fairly quick rate of speed and was pretty coherent throughout. You saw the OLR response as well. So that theory of 'slowing' isn't really an accurate way to describe December. Highest amplification/VP anomaly in p7 is absolutelty correct, but the MJO slowed/stalled? No. Further, I'm making a comment about sub-seasonal forecast usability at the weekly timeframe above all else here and pointing out that 2002 didn't have the depth of that warm pool response, but did have a Modoki signal to achieve a very similar OLR result. The temperature pattern was not nearly as amplified warm in the northeast and east in general, which speaks to potential bg warming climate itself, a dislocation of cold air on this side of the pole (for several reasons) and an h5 response that, while may have looked good to some on the EC weeklies, ended up advecting mP air with a displaced PV on the other side of the pole. For what it's worth I had a very warm December as well and also faded very aggressively the last week of December as you may remember. Had I been one who believed in p8-1 VP anomaly traversing eastward (as it clearly did) as the primary driver for temperature regime change, I would've been one who would've 'bitten' on the cold for Christmas werk. This was my real point about sub-seasonal bust potential following the agreed upon MJO/GSDM methodology. You had colder phases, you didn't produce expected results during the 'colder' phases for several reasons. This is why it's just a piece of a forecast puzzle and not a sole driver. There is a strong seasonal correlation to warmth in December El Nino's nothern tier and west, so most forecasters who do their homework should've been warm to very warm nationaly (there's also a seasonality to eastern warmth the week around Christmas too in Nino's). But I do question the validity of blaming the amplitude of the warmth solely on a highly amplified p7. There was more to it this season and it was pretty clear early on.


.png.80abfe6d20353b307adf251344d93413.png)