Layman
-
Posts
699 -
Joined
-
Last visited
Content Type
Profiles
Blogs
Forums
American Weather
Media Demo
Store
Gallery
Everything posted by Layman
-
-
I think that's what that just was...
-
-
Potential Sasquatch sighting in you first pic here
-
Definitely! @CoastalWx If you're taking out the loan anyway to head up, be sure to leave room to stay at one of Alex's place. Great quality of service and nice, convenient options. Well worth it!
-
Definitely agree with all of this. Nice, gentle terrain and far less crowded than anywhere else. Can't beat the scenery either!
-
Feb 10-11 Mid Week Minor Event - Ride the hot hand?
Layman replied to HoarfrostHubb's topic in New England
Left was Saturday morning after the last snow. It compacted down a bit after this but I didn’t take a pic to confirm depth. Right is this morning after the snow.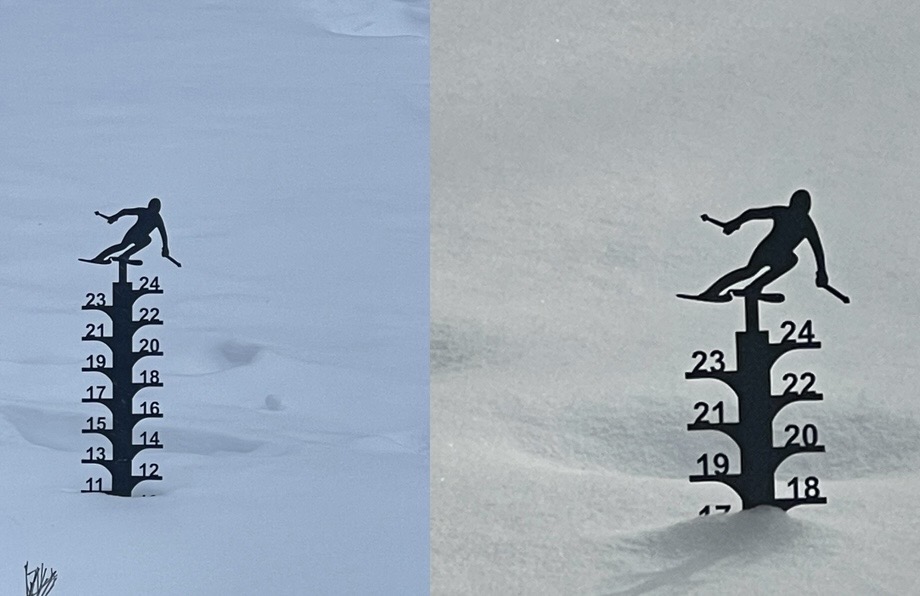
-
Feb 10-11 Mid Week Minor Event - Ride the hot hand?
Layman replied to HoarfrostHubb's topic in New England
Solid 7" here last night. Wasn't really expecting that. -
I was in Salisbury on Saturday night between 6pm and 11pm or so and they clearly had some decent accumulation but how they ever got an accurate measurement is beyond me. The wind was blowing pretty good and snow was drifting across the road all going out to sea. There were a few driveways that were untouched where you could see a good 6"-10" or so via the tire tracks of cars pulling in or out. No real problems getting around but the local DPW was definitely going to need to hit those drifts periodically.
-
-
Real light stuff here all morning. Maybe half an inch? We're going to dinner and a show in Salisbury tonight. We'll see how it compares down there.
-
I asked Chat GPT to give me a hand with this one - how do you think it did? "There’s a little bit of instability offshore, but strong upward motion in the part of the atmosphere where snow forms, which means good potential for precipitation (especially snow) even though the overall energy isn’t very high."
-
Indeed! But... There was no white Christmas in Weymouth... Everything sucks in Taunton... Dozens of ice storms have been forecast in Tolland to no avail... Methuen has had decent snows but the season is still only a C+.... Chickens are on the verge of freezing to death in central NH... You'll be happy to know that things remain pretty normal in Stowe though
-
Yep, especially when you were posting about Steve's D or whatever it was, we knew you had an iron grip on it.
-
Had a few random questions that I figured would fit best in this thread if anyone has knowledge about it: Was curious if snowguns/snowmaking equipment can be dialed in for water content if needed. Or, is it simply air pressure and water forced through a nozzle? Is there a standard water content for man-made snow? Is there a prime percentage resorts go for when making snow? i.e.: 10:1, 15:1, etc Is there any core data from man-made snow? Do resorts ever have a need to check that?
-
Did you give them a hand?! "Doc, a little to the left. No! Give me that, I got this..."
-
My forecast is that this one trends up and in
-
I'm sensing a theme here as this thing has trended poorly... "moving quickly and entering the back side of the L/W..."
-
Regardless of this all ultimately plays out, from my standpoint the depth of the ongoing analysis in here has been excellent and really informative. There have been a lot of quality posts hiding in this thread that have been interesting to follow as this thing has evolved.
-
Psss....stop being pragmatic! It may be contagious!
-
That’s interesting and the visual is really helpful - Thanks
-
I think I get the gist of part 1 here, but does someone have a non-Tip explanation of part 2? I'm good up to the "biased/stretched toward said convection" part but get lost thereafter
-
That's crazy! I'm going to have to get out and about today to see the difference from where I'm at. Maybe if I was doing legit clearing/measuring the total would be different, but my little snowstake has been untouched and reflected a storm total of about 14" roundtrip. I'm probably no more than 8 miles max in a straight line from Portsmouth, Kittery and Dover and that seems like a huge difference. To be fair, we've got some massive snowbanks here and the plowing took some effort. It's not impossible that my stake is too close to the house/patio and has some sort of blocking going on, but who knows...?
-
-
From left to right, Sunday morning before snow started, Monday morning, Monday at dusk and Tuesday morning.