

Stormchaserchuck1
-
Posts
3,289 -
Joined
-
Last visited
Content Type
Profiles
Blogs
Forums
American Weather
Media Demo
Store
Gallery
Everything posted by Stormchaserchuck1
-
 Let's just say models going into a Stronger La Nina next year is interesting lol Natural Gas vs Oil/Gasoline is at an all time low.
 -
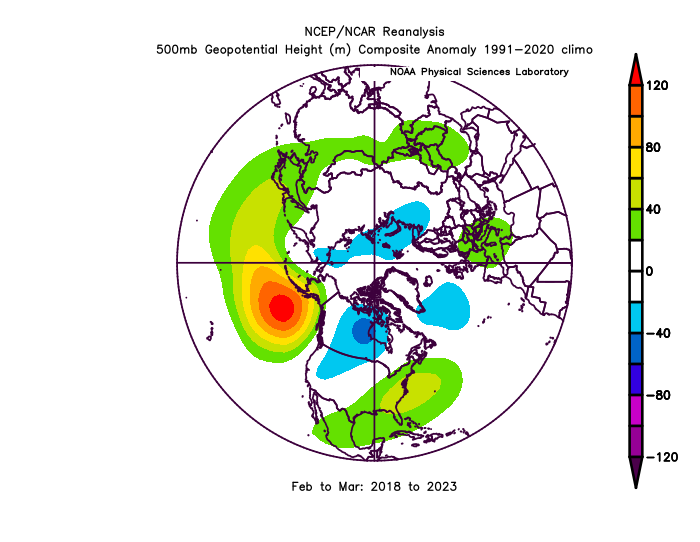
This is an amazing base state that we are coming out of. Since satellite record in 1948 there is no other 2-month composite for a 6-year period that has an anomaly this strong. #2 is over the NAO region in the '60s and has only 75% the strength of this N. Pacific High pressure anomaly. LR models are showing it again, despite this being a Strong El Nino year. https://ibb.co/5187RC7
- 2,509 replies
-
- 1
-

-
- weenie fest or weenie roast?
- weenies got roasted
- (and 2 more)
-
Just ask me to clarify if you have a question. I like to keep everything along the lines of scientific reasoning, so it's an unbiased input that people should be able to understand (because it's mutually external lol). They can also just simply say I agree, or disagree. You should be able to see the scientific point, and know if you are progressing toward an answer. Feel free if you ever need clarity. I learn by writing things out, also.
- 2,509 replies
-
- 3
-

-
- weenie fest or weenie roast?
- weenies got roasted
- (and 2 more)
-
Wow.. even the PNA/EPO region in the Pacific is close to opposite.
-
We are fighting a really strong multi-year base state. From 2018-2023, the average 500mb anomaly of the PNA region in the N. Pacific Ocean in February is >+150dm average. Since 1948, the only other 500mb anomaly for a consecutive month over a 6-year period is a -NAO signal at +105-120dm back from '64-69 (80% of that recent anomaly). Even March has started to trend toward this strong -PNA in recent years. So when the weeklies, etc, all were showing a cold +PNA pattern, it was suspect because the global trend was much different. They were showing Nino-climo, and you heard it all Winter by everyone "El Nino's are better after Jan 15th", "Most snow in 2nd half of Winter in Nino's", etc. There just really isn't enough data, and unscientific basis for why December should be a warm month and February so cold. No one makes the meteorological connection.. so we broke that ENSO-anomaly this Winter. That's all.
-
Believe it or not, the JFM ONI last year was -0.4, and we had net warm subsurface ENSO water, starting in January. We did have a La Nina earlier in the year, but for the Winter it was not "strong".
-
Yeah during +3std +AO. Strong Nina/+QBO strengthens the 10mb vortex about 70% of the time, just like Strong Nino/-QBO weakens the 10mb vortex 70-75% of the time. That 4-day example this year is 3:1 more likely to be an atmospheric state next Winter, that's all.
- 2,509 replies
-
- 1
-
-
- weenie fest or weenie roast?
- weenies got roasted
- (and 2 more)
-
It's a decadal La Nina-state. You are calling it -PDO, but the same extent of Pacific High pressure has hit the Hadley-mid latitude Cell in the southern hemisphere as the northern hemisphere.
-
We did get 3 Stratosphere warmings. When there isn't much data, it helps to know what the main function of a thing is. The QBO/ENSO hits the 10mb level with stronger or weaker vortex, and it's a strong effect historically. We hit that effect this year, but things like Hadley Cell expansion and the multi-year La Nina state did not allow us to fully maximize that favorable system.
-
https://en.wikipedia.org/wiki/Cumulus_cloud Big observable visual differences in the last few decades. Just pay attention. Cumulus is a sign of the lower atmosphere holding more ice crystals.
- 2,509 replies
-
- 1
-

-
- weenie fest or weenie roast?
- weenies got roasted
- (and 2 more)
-
Look out the window. The clouds are beautiful. I see purples, with pinks from the sun, fluffy low-atmosphere cumulus. They started appearing more frequently in 2021-2022 and really have been around every day with clouds (Summer too) for the last 2 years. No one has noticed? They are much different from the clouds in the sky every day several years ago. Kind of the same as how storms used to climb 40,000-50,000 ft in the atmosphere in the 1990s, but now they mostly make it to 15,000-20,000 ft. And everyone just blankly says its climate change. The recent happenings (cloud formation) are more conducive of a +PNA, I guess (more pressure systems)?
- 2,509 replies
-
- 3
-

-
- weenie fest or weenie roast?
- weenies got roasted
- (and 2 more)
-
The clouds have been A LOT fluffier. low atmosphere cumulus. They are out now, they have been out just about every day with clouds for the last 2 years. That's a sign of near-ground ice crystals. But 2013-mid 2018 was really bad on the opposite side of this, all high atmosphere cirrus and stratus, so it takes time to change the long term state imo.
-
With a +QBO 90% likely, no less. That with Stronger La Nina favors +AO conditions, and I'm just saying the last time we had that happen it hit 80 degrees in January.. that's kind of a baseline, although of course it could get cooler/colder at times.
- 2,509 replies
-
- 1
-
-
- weenie fest or weenie roast?
- weenies got roasted
- (and 2 more)
-
La Nina is not a function of climate change, and that is what the problem recently has been. https://ibb.co/34tJQXn
-
Models adjusted more than usual. They had a ridiculous strong 50/50 low signal at 10-13 day lead, that is now a High pressure anomaly on models for the same time. There was also a big N. Pacific Low that was suppose to develop and sustain, and it's pretty weak now. I've seen what happens a lot, is when the upper latitudes don't match what the models show in the CONUS (they never really showed big cold/trough over the EC), something, somewhere will adjust (lately it's been adjusting warm). Euro weeklies have been very little better than trash. I continue to stand by that.. they got January wrong by 4-5 degrees, and now the same thing is happening in late February and March. The LR images brooklynwx kept posting, through March 20th, are going to come to nowhere close to verifying, especially over the Pacific Ocean! NG futures (where the money is) was 5x more accurate all Winter long.
-
2024 Valentines Day Who the Hell Knows - Comeback Thread
Stormchaserchuck1 replied to DDweatherman's topic in Mid Atlantic
I ended up with less than 1". Really bad call saying that WSW's would go up, up here based on the RAP and Hrr consistently giving 4-6". It wasn't really cold enough in the end, and the precip under achieved a little (here). -
Signs that it could get very warm in the last few days of the month.. maybe 60s https://ibb.co/YBPYLdV
-
2024 Valentines Day Who the Hell Knows - Comeback Thread
Stormchaserchuck1 replied to DDweatherman's topic in Mid Atlantic
GFS and NAM had it in their snow depth charts. -
2024 Valentines Day Who the Hell Knows - Comeback Thread
Stormchaserchuck1 replied to DDweatherman's topic in Mid Atlantic
Snow picking up here. -
2024 Valentines Day Who the Hell Knows - Comeback Thread
Stormchaserchuck1 replied to DDweatherman's topic in Mid Atlantic
Cooled down nicely here in the last few minutes.. snow starting to land. 31F -
2024 Valentines Day Who the Hell Knows - Comeback Thread
Stormchaserchuck1 replied to DDweatherman's topic in Mid Atlantic
eh.. we'll see how the backend does, but this seems like a bust. -
2024 Valentines Day Who the Hell Knows - Comeback Thread
Stormchaserchuck1 replied to DDweatherman's topic in Mid Atlantic
I don't like that the dryslot is north of Rockville! -
2024 Valentines Day Who the Hell Knows - Comeback Thread
Stormchaserchuck1 replied to DDweatherman's topic in Mid Atlantic
Yeah, started changing over just when I posted that. -
2024 Valentines Day Who the Hell Knows - Comeback Thread
Stormchaserchuck1 replied to DDweatherman's topic in Mid Atlantic
That is a nasty dryslot working into DC. Still all rain in Fallston. Temperature says 33 degrees. Edit: just started to mix in with snow. -
Yeah but the Pacific dominates Only a 0.3 correlation in the South-SE, and it's technically all 3 areas. I'd rather just go to the source..
- 2,509 replies
-
- 1
-
-
- weenie fest or weenie roast?
- weenies got roasted
- (and 2 more)